Introduction
Weeds are the major competitors of crops as they compete for the resources like nutrients, water, sunlight, space etc. which otherwise are meant for the crop (Biswas and Dutta, Reference Biswas and Dutta2019). Therefore, it is wise to remove the weeds or to keep their population to a very low extent so that these cannot create harm for the crop. Use of toxic chemical herbicide is a very quick and effective way to control the weeds as the manual hand weeding faces issues like high cost, time, and labour crisis (Jana et al., Reference Jana, Biswas, Sarkar, Mondal and Mondal2024). However, these toxic herbicides persist in the environment for a long time and environment gets polluted through their toxic foot print (Baćmaga et al., Reference Baćmaga, Wyszkowska and Kucharski2024). Therefore, there is an urgent need to find out the alternatives of chemical and physical methods of weed management. Among the alternatives, cultural method of weed management through an intercropping system is showing good prospects as it not only suppresses the weeds, but also protects the top soil from erosion, moderates the soil temperature, improves soil biological properties and checks evaporation loss of water (Moreira et al., Reference Moreira, Gonçalves, Pinto, Prieto Lage, Carocho, Caleja and Barros2024). Cereal–legume intercropping system can create win–win situation as it does not allow weeds to grow much and improves system productivity through different benefits like biological nitrogen fixation (Rodriguez et al., Reference Rodriguez, Carlsson, Englund, Flöhr, Pelzer, Jeuffroy, Makowski and Jensen2020).
One of the oldest foods that humans are aware of is millet. Because of their resilience, millets are now widely recognized as the staple diet of those who live in drier regions of the world (El-Beltagi et al., Reference El-Beltagi, Mohamed, Khedr, Shalaby, El-Mogy and Khedr2025). Millets are climate-resilient cereal crops that contribute significantly to food and nutritional security by providing the inexpensive, wholesome food options. They are profoundly ingrained in the customs, culture, and food systems of indigenous peoples around the world, and they are well suited to arid and semi-arid environments. In recognition of their importance, the United Nations General Assembly proclaimed 2023 to be the International Year of Millets (IYM 2023) at its 75th session in March 2021 (United Nations, Reference Nations2023). Furthermore, in terms of protein, calories, vitamins, and minerals, millets are on par with or even better than rice and wheat (Rao et al., Rao et al., Reference Rao, Bhaskarachary, Arlene Christina, Sudha Devi, Vilas and Tonapi2017). Cultivated in tropical and subtropical regions, finger millet (Eleusine coracana (L.) Gaertn) is said to be able to survive on only 28% of rice’s water requirements. Finger millet production in India in 2020–21 was 1998 thousand tons, with an average productivity of 1723 kg/ha, and the crop covered 1159 thousand hectares (Niti Aayog, Government of India, 2023). A temporal and spatial intensification of agricultural systems is warranted by the continuously declining amount of land available per capita (Li et al., Reference Li, Han, Zhang, Sun, Peng, Xie, Guo and Ye2022). Intercropping involving finger millet and legumes has been recognized as a keystone in achieving agricultural sustainability. Because pulses can fix and transmit nitrogen, they play a critical role in intercropping systems (Chamkhi et al., Reference Chamkhi, Cheto, Geistlinger, Zeroual, Kouisni, Bargaz and Ghoulam2022). Additionally, intercropping with quick growing pulses will aid in the reduction of weed issues. Pulses are given second importance after cereals and they are rich in protein, fibres, vitamins and minerals such as magnesium, iron, zinc and low in fat, making them a great addition to any diet of humans, especially of Indian people who are not able to supply their body protein (Semwal et al., Reference Semwal, Painuli, Begam, Jamloki, Rauf, Olatunde, Rahman, Mukherjee, Khalil, Aljohani, Abdulmonem and Simal-Gandara2023). During the monsoon, one important annual pulse crop is black gram (Vigna mungo (L.) Hepper). It can serve as cover crop protecting the soil from erosion and restricting evaporation loss of water.
In the current study, it is hypothesized that cereal (finger millet)-legume (black gram) intercropping can suppress weeds and enrich soil through biological nitrogen fixation leading to improved system productivity. The overall goal of this study was the identification of the suitable intercropping system of finger millet and black gram for suppressing the weed infestation during the monsoon and generating the qualitative and quantitative production of crops and economic profitability under organic farming scenario. Although, in the studied regions, various other means of weed control has been tried, there is still a research gap to identify the potential of cereal-legume intercropping system on weed suppression and yield improvement. To shed light and narrow down this gap, the present investigation was made.
Materials and methods
Experiment details
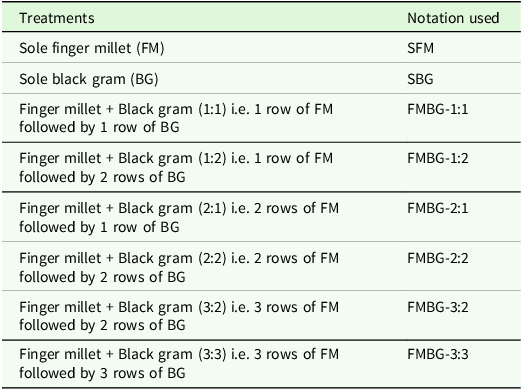
The experiment was carried out at Ramakrishna Mission Vivekananda Educational and Research Institute (RKMVERI), Ranchi, Jharkhand, during the monsoon season (July–November) of 2023 and 2024 in a randomized block design using eight cropping systems as treatments, with three replications (Table 1). The USDA Soil Taxonomy classifies the experimental soil as a sandy loam. Initially, the experimental soil pH was 6.73; soil organic carbon was 0.51%; available N was 207.5 kg/ha; available P2O5 was 43.5 kg/ha; and available K2O was 135.8 kg/ha (as measured using the methods suggested by Jackson, Reference Jackson1967; Jackson, Reference Jackson1973; Olsen et al., Reference Olsen, Cole, Watanabe and Dean1954; Subbiah and Asija, Reference Subbiah and Asija1956; Walkley and Black, Reference Walkley and Black1934, respectively). During the experimental period, July was the hottest month (32.9 °C), while November was the coolest one (26.0 °C). Relative humidity ranged from 86.6–87.0% and September received the highest rainfall (497.8 mm), followed by July (276.9 mm). Meteorological observations during the experimental months are presented graphically in Figure S1 of the supplementary file. The experiment was placed on the organic cultivation system without any usage of chemicals.
Treatment details

Table 1. Long description
A table with two columns and eight rows. The first column is labeled Treatments and the second column is labeled Notation used. The table lists different treatments involving finger millet and black gram and their corresponding notations. Row 1: Sole finger millet (FM), SFM. Row 2: Sole black gram (BG), SBG. Row 3: Finger millet + Black gram (1:1) i.e. 1 row of FM followed by 1 row of BG, FMBG-1:1. Row 4: Finger millet + Black gram (1:2) i.e. 1 row of FM followed by 2 rows of BG, FMBG-1:2. Row 5: Finger millet + Black gram (2:1) i.e. 2 rows of FM followed by 1 row of BG, FMBG-2:1. Row 6: Finger millet + Black gram (2:2) i.e. 2 rows of FM followed by 2 rows of BG, FMBG-2:2. Row 7: Finger millet + Black gram (3:2) i.e. 3 rows of FM followed by 2 rows of BG, FMBG-3:2. Row 8: Finger millet + Black gram (3:3) i.e. 3 rows of FM followed by 3 rows of BG, FMBG-3:3.
Crop management details
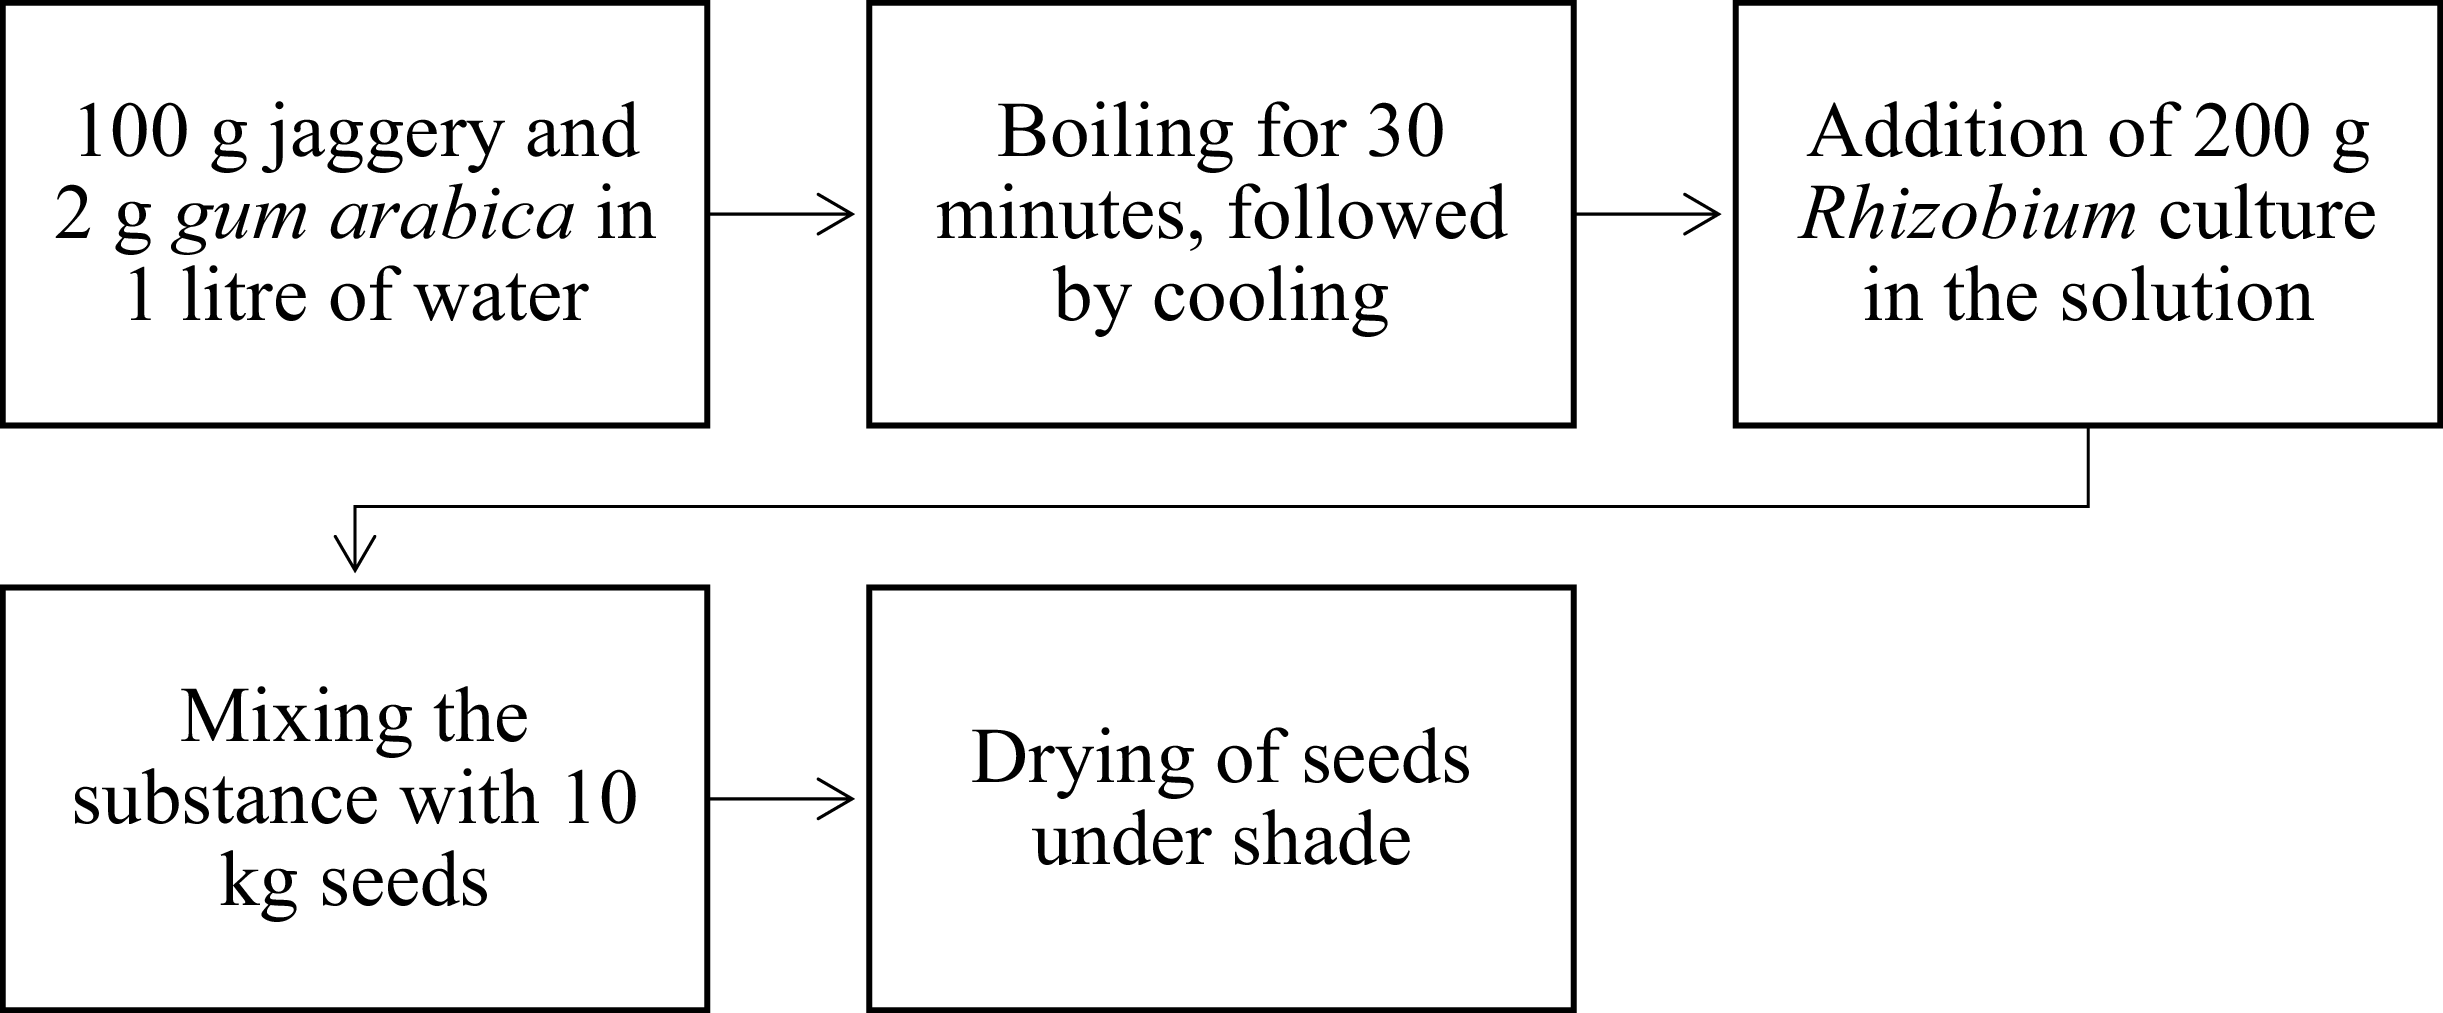
The variety of finger millet was ‘VL Mandua 379’ and that of black gram was ‘WBU-109.’ The sowing of finger millet seeds @ 6 kg/ha in the nursery was done on July 18 and July 14 of 2023 and 2024, respectively. The size of nursery for finger millet was 50 m2 which provided seedlings for 1 ha land. It was placed just beside the main field. The bed was raised for broadcasting of seeds. Before sowing, adequate moisture was ensured. In nursery, 45 kg well-rotten farm yard manure (FYM) was applied and mixed with the soil. No irrigation was required after sowing in nursery as rain occurred. With the use of tractor-drawn implements, the experimental main plot was ploughed, followed by harrowing twice. To make the sowing/planting process easier, the clods were broken and the crop and weed stubbles were removed. Then, the land was levelled properly with a leveler. Plots were made as per the requirements. Two irrigation channels were prepared. The entire field was made into ridge and furrow system with the help of spade maintaining the row-row spacing of the crop. The recommended doses of fertilizers for finger millet and black gram were 80: 60: 40 kg/ha and 20: 60: 40 kg/ha N: P2O5: K2O, respectively. The source of nutrients was FYM (0.9% N, 0.6% P2O5 and 0.8% K2O, tested on a dry weight basis using the protocol suggested by Page et al., Page et al., Reference Page, Miller, Kenny and Page1982) and it was applied to fulfill the nitrogen requirement of the crops. Since the FYM acted as a consortium of essential nutrients, beneficial microbes, phytohormones etc., application of manure for fulfilling the recommended N demand of the crop for the studied region additionally supplied P, K, other essential nutrients and substances beneficial for the crop growth. For sole finger millet as well as intercropping systems, 8.89 t/ha FYM and for sole black gram, 2.23 t/ha FYM were applied. The seedlings of finger millet treated with 10% Trichoderma solution (prepared by mixing 100 g Trichoderma powder in 900 ml of water and root dipping was done into the solution 20–30 minutes before transplanting) and the seeds of black gram @ 20 kg/ha inoculated with rhizobium culture (Rhizobium phaseoli; inoculation process shown in Figure 1) were planted in each 4.2 m × 3 m plot on August 6 and August 2 of 2023 and 2024, respectively, at row-to-row distance of 30 cm and plant-to-pant distance of 10 cm.
Rhizobium inoculation process in black gram.

Gap filling and thinning were also required after the black gram crop was sown to ensure optimum plant population. Hand gap filling and thinning were done 7 days after emergence. One light irrigation was provided immediately after sowing to facilitate the seed germination as well as seedling establishment for both the crops. Two irrigations at 20 days after sowing (DAS) (black gram)/ days after transplanting (DAT) (finger millet) and 45 DAS (black gram)/DAT (finger millet) were given further. In finger millet plots, one irrigation was additionally given during grain formation at 75 DAT. At 45 DAS (black gram) or DAT (finger millet), Panchagavya@10% was sprayed over the crops to boost the growth of the crops. For preparation of Panchagavya (a liquid organic formulation), five cow-based ingredients i.e. cow dung, cow urine, milk, curd, and ghee were mixed in 5:3:2:2:1 ratio, and incubated for 9 days in a wide mouth plastic container. Stirring with a stick was done every day two times during morning and evening, clockwise, and anti-clockwise. To protect the crop from insect pests such as termites and aphids, spray of neem oil @ 5% was done at 40 and 65 DAS (black gram)/DAT (finger millet). To control various lepidopteran and coleopteran insects, Dasparni @ 10% was applied at 75 DAS (black gram)/DAT (finger millet). No other pest attack was found during the period of investigation. Dasparni was prepared according the process suggested by Biswas et al. (Reference Biswas, Mukherjee, Saw, Das, Dey, Roy and Dutta2025).
Observations on crops
To record various agronomic observations, five plants each of finger millet and black gram (excluding border rows) were randomly selected, tagged, and the mean value was determined after recording the observations. Plant height (cm), and dry matter accumulation (DMA) were recorded at 30 days intervals up to 90 days and at harvest in finger millet, and 15-days intervals from 30 days up to 75 days and at harvest in black gram. For DMA estimation, five random plants were cut and sun dried for a day or two. The plants were then packed in brown paper bag and dried in a hot air oven at a temperature of 65 ± 20C until a constant weight was achieved. Afterwards, the dry weight was measured using a weighing balance. The mean value was then estimated from each plot and represented in g/m2. The crop growth rates (CGR) were measured for finger millet at 30–60, 60–90 DAT, and 90 DAT-harvest and for black gram at 30–45, 45–60 DAS, 60–75 DAS, 75 DAS-harvest. The CGR indicated the rate at which the crop was growing and it was represented as g/m2/day. It was computed as follows (Watson, Reference Watson1952):
 ${\rm CGR\ }= ({\rm W}2-{\rm W}1)/({\rm T}2-{\rm T}1)$
where W1 and W2 represented dry weights of plants (g) at times T1 and T2 in days, respectively.
At 45 DAS, nodule number and dry weight/plant of black gram were estimated by manually uprooting the five black gram plants from each plot. Instead of just only manually pulling, plants and entire root systems were carefully excavated using a hand hoe or spade up to a depth of about 75 cm around the root zone in order to reduce the loss of nodules during sampling. To preserve the major and secondary root branches, the complete root system was carefully lifted after the soil mass surrounding the roots was softly loosened. After that, detached nodules were recovered by washing the roots under slow-running water over a fine mesh sieve. Every nodule that could be seen on the main and lateral roots was collected and visually counted. To ensure uniformity in nodule study, the same sampling techniques were used for each treatment. The plant population (per m row length) was measured at harvest for both crops. Finger millet yield parameters during harvest were the number of effective tillers/plant, number of grains/panicle, 1000 grain weight (g), grain yield (kg/ha), and straw yield (kg/ha). Black gram yield parameters at harvest included number of pods/plant, number of seeds/pod, pod length (cm), pod breadth (mm), 100 grain weight (g), seed yield (kg/ha), and stover yield (kg/ha). To achieve grain yield of finger millet and seed yield of black gram, an area of 3.6 m × 2.8 m was selected excluding border rows. Matured panicles from finger millet plants or matured pods from back gram plants within the selected area were then cut or handpicked, respectively. Two panicle harvesting or pod pickings were made. Last panicle was harvested or last pods were picked along with the entire crop from the ground level (6–8 cm above the ground). Grains from those panicles or seeds from pods were manually separated through beating with stick. Further, grain weight of finger millet or seed weight of black gram was taken using weighing balance and represented in kg/ha. The harvest index (HI) for both the crops was determined using a formula proposed by Donald and Hamblin (Reference Donald and Hamblin1976).
 $H.I \left(\% \right)={{\rm Economic\ }\left({\rm grain\ or\ seed}\right){\rm yield} \over {\rm Biological\ }\left({\rm grain\ or\ seed\ }+{\rm \ stover}\right){\rm yield}}\times 100$
Furthermore, production economics were mapped out using the formulas listed below:
 $\eqalign {\bullet \;\; & Cultivation\;Cost\;\left( {Rupees/ha} \right) = \cr& Total\;cost\;involved\;in\;various\;inputs\;and\;package\;of\;practice}$
 \begin{align}\! \bullet \;Gross\;return\;\left( {Rupees/ha} \right) =& \,\,Yield\;\left( {kg/ha} \right)\; \\& \times Market\;price\;\left( {Rupees/kg} \right) \end{align}
 \begin{align}\! \! \bullet \;Net\;Return\;\left( {Rupees/ha} \right) =&\,\, Gross\;return\;\left( {Rupees/ha} \right)\\& - Cultivation\;Cost\;\left( {Rupees/ha} \right)\end{align}
 $\!\!\!\!\!\!\!\!\!\!\!\!\!\!\!\!\!\!\!\!\!\!\!\!\!\!\! \bullet \;\textit{Benefit} \colon cost\, \left(B\colon C\right)={\textit{Gross}\,\,\textit{return}\, \left(\textit{Rupees}/ha\right) \over \textit{Cultivation}\,\,cost\,\,(\textit{Rupees}/ha)}$
*Market prices of finger millet grain and straw were Rupees 30/kg and Rupees 0.5/kg, respectively and market prices of black gram seed and stover were Rupees 90/kg and Rupees 1.0/kg, respectively as decided based on the local market of the region. The costs included the labour wages for various activities like land preparation, sowing/transplanting, weeding, thinning and gap filling, application of manures and biopesticide, harvesting and post-harvest operations, machineries, inputs like seeds, biopesticides, Trichoderma, Rhizobium, irrigation cost etc.
Soil and plant analysis
Before beginning and after the experiment, soil samples were collected at depths ranging from 0 to 15 cm. Soil samples were air-dried, passed through a 2-mm nylon sieve, and then stored for analysis using established procedures (Jackson, Reference Jackson1967; Jackson, Reference Jackson1973; Olsen et al., Reference Olsen, Cole, Watanabe and Dean1954; Subbiah and Asija, Reference Subbiah and Asija1956; Walkley and Black, Reference Walkley and Black1934) (Table S1 of supplementary file). After harvesting, the finger millet grains and black gram seeds were thoroughly cleaned with running tap water, 0.01 N hydrochloric acid, and distilled water. The samples were dried for two days at 65 ± 2°C in a hot-air oven. Page et al. (Page et al., Reference Page, Miller, Kenny and Page1982) recommended that dried plant samples was to be ground into a fine powder using a mechanical grinder to allow further testing. The crude protein was estimated by multiplying the nitrogen percentage by a factor of 6.25 (Gupta et al., Reference Gupta, Pathak, Bhan and Singh1972). To evaluate the nitrogen content of plant materials, micro-Kjeldahl digestion, distillation, and titration were used (Page et al., Page et al., Reference Page, Miller, Kenny and Page1982).
Observations on weeds
Observations on weeds included dominant weed flora, weed density and biomass (/m2), and weed control efficiency (WCE) at 45 DAS/DAT using the following formula (Mani et al., Reference Mani, Malla, Gautam and Bhagwant1973):
 ${\rm{WCE}}\;\left( {\% \;} \right) = {{X - Y} \over X} \times 100$
where X = Weed density (/m2) in control (sole finger millet) plot and Y = Weed density (/m2) in treated (sole/intercrop black gram added) plot
System productivity and competition analysis
System productivity was estimated based on the yield of two crops. Using the crop equivalent yield approach, the yield of one crop was converted to the yield of another crop (as shown below) and added with yield of component crop’s yield to obtain system productivity (Lal and Ray, Reference Lal and Ray1976).
 ${\rm Crop\ equivalent\ yield}= {\Sigma\,\,{\rm YiPi} \over {\rm Pj}}$
where Yi = Yield of ith crop, Pi = Price of ith crop and Pj = Price of jth crop
Whether particular crop combination proved to be advantageous or not, a number of competitive functions such as competitive ratio (CR), land equivalent ratio (LER), aggressivity index, relative crowding co-efficient (RCC) and monetary advantage index (MAI) were worked out based on the standard formulas suggested by De Witt (Reference De Witt1960); McGilchrist (Reference McGilchrist1965); Ghosh (Reference Ghosh2004); Willey (Reference Willey1979) and Willey and Rao (Reference Willey and Rao1980), respectively, as follows:
Competitive ratio (CR)
The CR values quantify the competition between intercrops under intercropping system. Competitive ratio is the ratio of individual LERs of the two component crops, correcting the proportions in which the crops were initially sown.
 $CRa= {LERa \over LERb}\times {{\rm Zba} \over {\rm Zab}}$
 $CRb= {{\rm LERb} \over {\rm LERa}} \times {{\rm Zab} \over {\rm Zba}}$
where CRa was the CR of species a in mixture with species b and CRb was the competitive ratio of species b in mixture with species a; Zab and Zba were sown proportion of species a (in mixture with b), and sown proportion of species b (in mixture with a), respectively.
Land equivalent ratio (LER)
LER was defined as the relative land area under sole crops that was required to produce the yields achieved in intercropping.
 $LER= {{\rm Yab} \over {\rm Yaa}}+ {{\rm Yba} \over {\rm Ybb}}$
where Yab = Intercrop yield of species ‘a’ in presence of species ‘b’; Yba = Intercrop yield of species ‘b’ in presence of species ‘a’; Yaa = Pure stand yield of species ‘a’ and Ybb = Pure stand yield of species ‘b’
Aggressivity
It indicated relative yield advantage of species ‘a’ over species ‘b’ and aggressivity will be zero when the component species would be equally competitive. In other cases, value of one crop will be positive (dominant) and another crop will be negative i.e. dominated.
 $\textit{Aggressivity}\,\,\left(Aab\right)= {{\rm \ Yab} \over ({\rm Yaa\ }\times {\rm \ Zab})}- {{\rm Yba} \over (Ybb \times Zba)}$
where Aab = Aggressivity of species ‘a’ in presence of species ‘b’; Yab = Intercrop yield of species ‘a’ in presence of species ‘b’; Yba = Intercrop yield of species ‘b’ in presence of species ‘a’; Yaa = Pure stand yield of species ‘a’; Ybb = Pure stand yield of species ‘b’; Zab = Sown proportion of species ‘a’ (intercropped with ‘b’) and Zba = Sown proportion of species ‘b’ (intercropped with ‘a’)
Relative crowding co-efficient
It gave indication whether there was any yield advantage due to intercropping.
 $Kab={Yab \over (Yaa-Yab)} \times {Zba \over Zab}$
where Kab = Co-efficient of ‘a’ in presence of ‘b’; Yab = Intercrop yield of species ‘a’ in presence of species ‘b’; Yaa = Pure stand yield of species ‘a’; Zab = Sown proportion of species ‘a’ (intercropped with ‘b’) and Zba = Sown proportion of species ‘b’ (intercropped with ‘a’)
 $Kba= {Yba \over (Ybb-Yba)} \times {Zab \over Zba}$
where Kba = Co-efficient of ‘b’ in presence of ‘a’; Yba = Intercrop yield of species ‘b’ in presence of species ‘a’ and Ybb = Pure stand yield of species ‘b’
Now, when the total of the co-efficient i.e. K = Kab × Kba was greater, equal to and less than one, there was yield advantage, no advantage and disadvantage due to mixed stands, respectively.
Monetary advantage index
Monetary advantage can be determined as follows:
 \begin{align}\textit{Monetary}\,\,\textit{Advantage}\,\,\textit{Index}=&\textit{Value}\,\,of\,\,\textit{combined}\,\,\textit{intercrop}\,\,\textit{yield} \\& \times {{\rm LER}-\!\!1 \over {\rm LER}} \end{align}
Individual years’ data were shown in Tables S2-S14 of the supplementary file.
Statistical analysis
Data obtained from the field and laboratory were statistically analysed using analysis of variance method (ANOVA) suggested by Panse and Sukhatme, Reference Panse and Sukhatme1985). The treatment means were compared using Duncan’s multiple range test (DMRT) at 5% level of significance (p = 0.05) through SPSS statistical software (version 25.0). ANOVA was performed on the experimental data with year taken into account. The data were combined over the years and displayed as pooled means because the year × treatment interaction impact was found non-significant. Due to wide variations existed in the original data set, for analysis of variance, values of weed density and weed biomass were subjected to square root transformation (
 $\sqrt{X+0.5}$
).
Results
Combined ANOVA
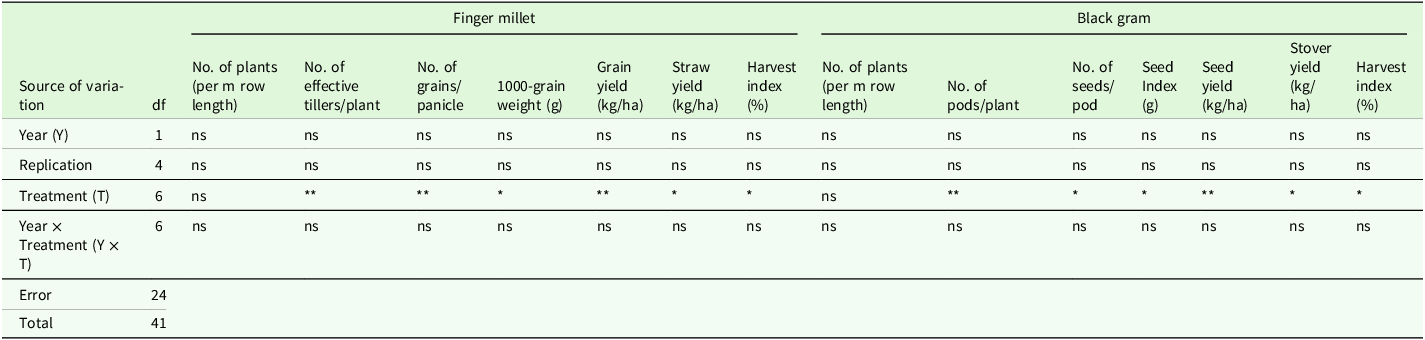
Year, replication, and year × treatment interaction did not significantly affect any of the finger millet or black gram characteristics, according to the combined ANOVA, indicating strong experimental uniformity and consistent crop performance over the two experimental years (Table 2). On the other hand, for the majority of yield-attributing traits and yield characteristics in both crops, treatment effects were significant. Effective tillers/plant, grains/panicle, 1000-grain weight, grain yield, straw yield, and HI were all considerably impacted by treatments in finger millet, although plant population was unaffected. In a similar vein, while plant population was not significantly impacted, treatments had a significant impact on pods/plant, seeds/pod, seed index, seed yield, stover yield, and harvest index in black gram. For later analyses, pooling the data across years was justified by the non-significant year × treatment interaction.
Combined analysis of variance (ANOVA) showing the effects of year, treatment, and year × treatment interaction on yield and yield-attributing characters of finger millet and black gram across two experimental years

Table 2. Long description
A table with 7 rows and 12 columns comparing the effects of year, treatment, and year-treatment interaction on yield and yield-attributing characters of finger millet and black gram. The table includes data for the number of plants per meter row length, number of effective tillers per plant, number of grains per panicle, 1000-grain weight, grain yield, straw yield, and harvest index for finger millet, and the number of plants per meter row length, number of pods per plant, number of seeds per pod, seed index, seed yield, stover yield, and harvest index for black gram. The table shows that year, replication, and year-treatment interaction did not significantly affect any of the finger millet or black gram characteristics, indicating strong experimental uniformity and consistent crop performance over the two experimental years. Treatment effects were significant for the majority of yield-attributing traits and yield characteristics in both crops. Effective tillers per plant, grains per panicle, 1000-grain weight, grain yield, straw yield, and harvest index were significantly impacted by treatments in finger millet, while plant population was unaffected. Similarly, treatments had a significant impact on pods per plant, seeds per pod, seed index, seed yield, stover yield, and harvest index in black gram, while plant population was not significantly impacted. Row 1: Source of variation, Year (Y), Replication, Treatment (T), Year x Treatment (Y x T), Error, Total. Row 2: df, 1, 4, 6, 6, 24, 41. Row 3: No. of plants (per m row length), ns, ns, ns, ns, ns, ns. Row 4: No. of effective tillers/plant, ns, ns, **, ns, ns, ns. Row 5: No. of grains/panicle, ns, ns, **, ns, ns, ns. Row 6: 1000-grain weight (g), ns, ns, *, ns, ns, ns. Row 7: Grain yield (kg/ha), ns, ns, **, ns, ns, ns. Row 8: Straw yield (kg/ha), ns, ns, *, ns, ns, ns. Row 9: Harvest index (%), ns, ns, *, ns, ns, ns. Row 10: No. of plants (per m row length), ns, ns, ns, ns, ns, ns. Row 11: No. of pods/plant, ns, ns, **, ns, ns, ns. Row 12: No. of seeds/pod, ns, ns, *, ns, ns, ns. Row 13: Seed index (g), ns, ns, *, ns, ns, ns. Row 14: Seed yield (kg/ha), ns, ns, **, ns, ns, ns. Row 15: Stover yield (kg/ha), ns, ns, *, ns, ns, ns. Row 16: Harvest index (%), ns, ns, *, ns, ns, ns.
df: Degrees of freedom, ns: non-significant (p ≤ 0.05), * p ≤ 0.05, ** p ≤ 0.01.
Weed management
Major weeds found in the experimental plots were Digitaria sanguinalis, Rumex sp., Trianthema portualcastrusm, Amaranthus viridis, Anagallis arvensis, Ageratum conyzoides, Oxalis corniculata, Commelina benghalensis, Euphorbia hirta, Cynodon dactylon, Alternanthera philoxeroides, Cyperus rotundus, etc. Infestation of sedges was comparatively less as compared to grasses and broad-leaved weeds, which had nearly same infestations.
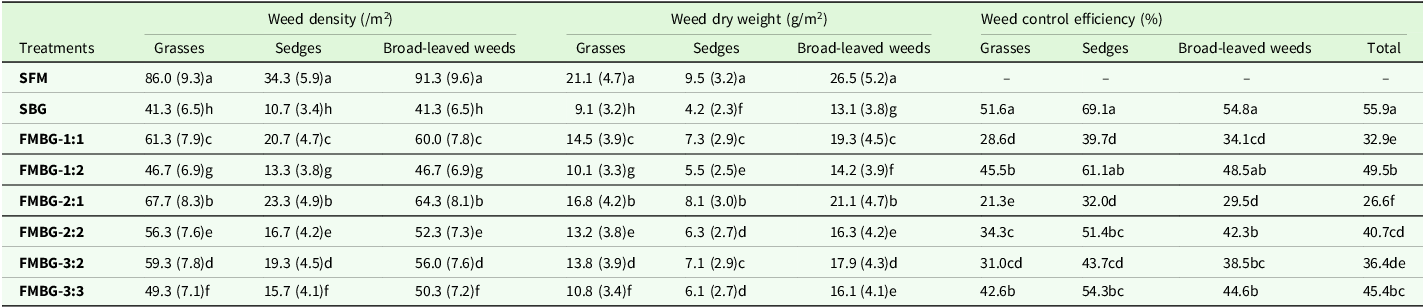
The maximum weed density of all types of weeds was significantly highest in sole FM (SFM) with 108%, 221% and 121% higher grasses, sedges, and broad-leaved weeds, respectively, than SBG. A similar trend was observed for weed dry weight where SFM recorded significantly higher values of 132%, 126% and 102% for grasses, sedges and broad-leaved weeds, respectively, than SBG. The total WCE under SBG was 55.9% (52.4% higher over intercropping system of finger millet and black gram (2:1) i.e. FMBG-2:1), with control efficiencies of grass being 51.6%, sedge being 69.1% and broad-leaved weeds being 54.8%; followed by intercropping system of finger millet and black gram (1:2) (FMBG-1:2) (49.5%) and intercropping system of finger millet and black gram (3:3) (FMBG-3:3) (45.4%), while the total weed control efficiency in intercropping system of finger millet and black gram (2:1) (FMBG-2:1) for grass, sedge and broad-leaved weeds were 21.3%, 32.0% and 29.5%, respectively (Table 3).
Weed density, dry weight, and weed control efficiency under various cropping systems of finger millet and black gram (mean of two years)

Table 3. Long description
The table presents data on weed density, weed dry weight, and weed control efficiency across different treatments involving finger millet and black gram. It includes measurements for grasses, sedges, and broad-leaved weeds. The table has 10 rows and 12 columns. Column headers are Weed density (/m^2), Weed dry weight (g/m^2), and Weed control efficiency (%). Row labels include treatments such as SFM, SBG, FMBG-1:1, FMBG-1:2, FMBG-2:1, FMBG-2:2, FMBG-3:2, and FMBG-3:3. Each row provides values for weed density, weed dry weight, and weed control efficiency for grasses, sedges, and broad-leaved weeds. Notable trends include the highest weed density and dry weight in SFM and the highest weed control efficiency in SBG. Specific values and comparisons are detailed in the table.
Data in the parenthesis indicated square root transformed data of original weed density and weed dry weight; SFM: Sole finger millet (FM), SBG: Sole black gram (BG), FMBG-1:1: FM + BG (1:1), FMBG-1:2: FM + BG (1:2), FMBG-2:1: FM + BG (2:1), FMBG-2:2: FM + BG (2:2), FMBG-3:2: FM + BG (3:2), FMBG-3:3: FM + BG (3:3); Means shown along with different letters within a column are significantly different at p ≤ 0.05 by DMRT.
Growth attributes
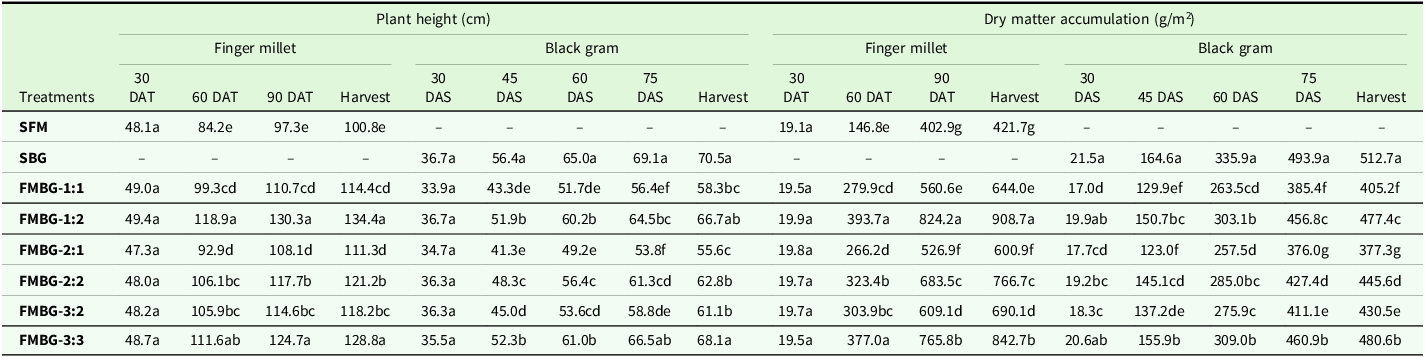
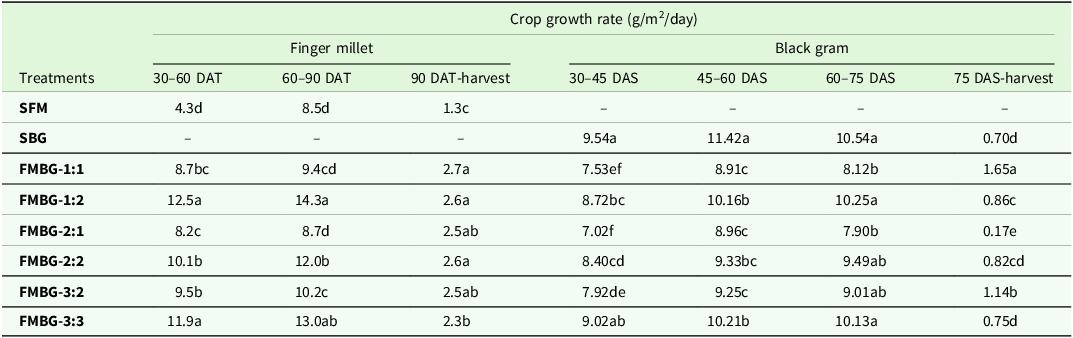
Observations on growth attributes of finger millet viz., plant height, and DMA were recorded at 30, 60, 90 DAT and at harvest (Table 4). The plant height as well as DMA gradually increased with the age of the plant towards maturity. Intercropping system of finger millet and black gram (1:2) (FMBG-1:2) recorded 33.33% and 115.48% more plant height, and DMA at harvest, respectively, than the SFM planting. The crop growth rate was taken at 30–60, 60–90 DAT and 90 DAT-harvest (Table 4). Intercropping system of finger millet and black gram (1:2) (FMBG-1:2) recorded 190.7%, 68.24% and 100% increase in crop growth rate over sole finger millet, respectively, for 30–60, 60–90 DAT and 90 DAT-harvest, while being statistically at par with 1:1 intercropping system of finger millet and black gram (FMBG-1:1) between 90 DAT-harvest.
Plant height and dry matter accumulation of crops as influenced by various cropping systems of finger millet and black gram (mean of two years)

Table 4. Long description
The table presents data on plant height and dry matter accumulation for finger millet and black gram under different treatments. It includes measurements at various days after treatment (DAT) and days after sowing (DAS) for both crops. The table has 8 columns and 9 rows, including headers. Column headers are: Treatments, Plant height (cm) Finger millet, Plant height (cm) Black gram, Dry matter accumulation (g/m^2) Finger millet, Dry matter accumulation (g/m^2) Black gram. Row labels include treatments such as SFM, SBG, FMBG-1:1, FMBG-1:2, FMBG-2:1, FMBG-2:2, FMBG-3:2, and FMBG-3:3. Each row provides specific values for plant height and dry matter accumulation at different stages of growth for both finger millet and black gram. Notable trends include variations in plant height and dry matter accumulation across different treatments and growth stages.
SFM: Sole finger millet (FM), SBG: Sole black gram (BG), FMBG-1:1: FM + BG (1:1), FMBG-1:2: FM + BG (1:2), FMBG-2:1: FM + BG (2:1), FMBG-2:2: FM + BG (2:2), FMBG-3:2: FM + BG (3:2), FMBG-3:3: FM + BG (3:3); Means shown along with different letters within a column are significantly different at p ≤ 0.05 by DMRT.
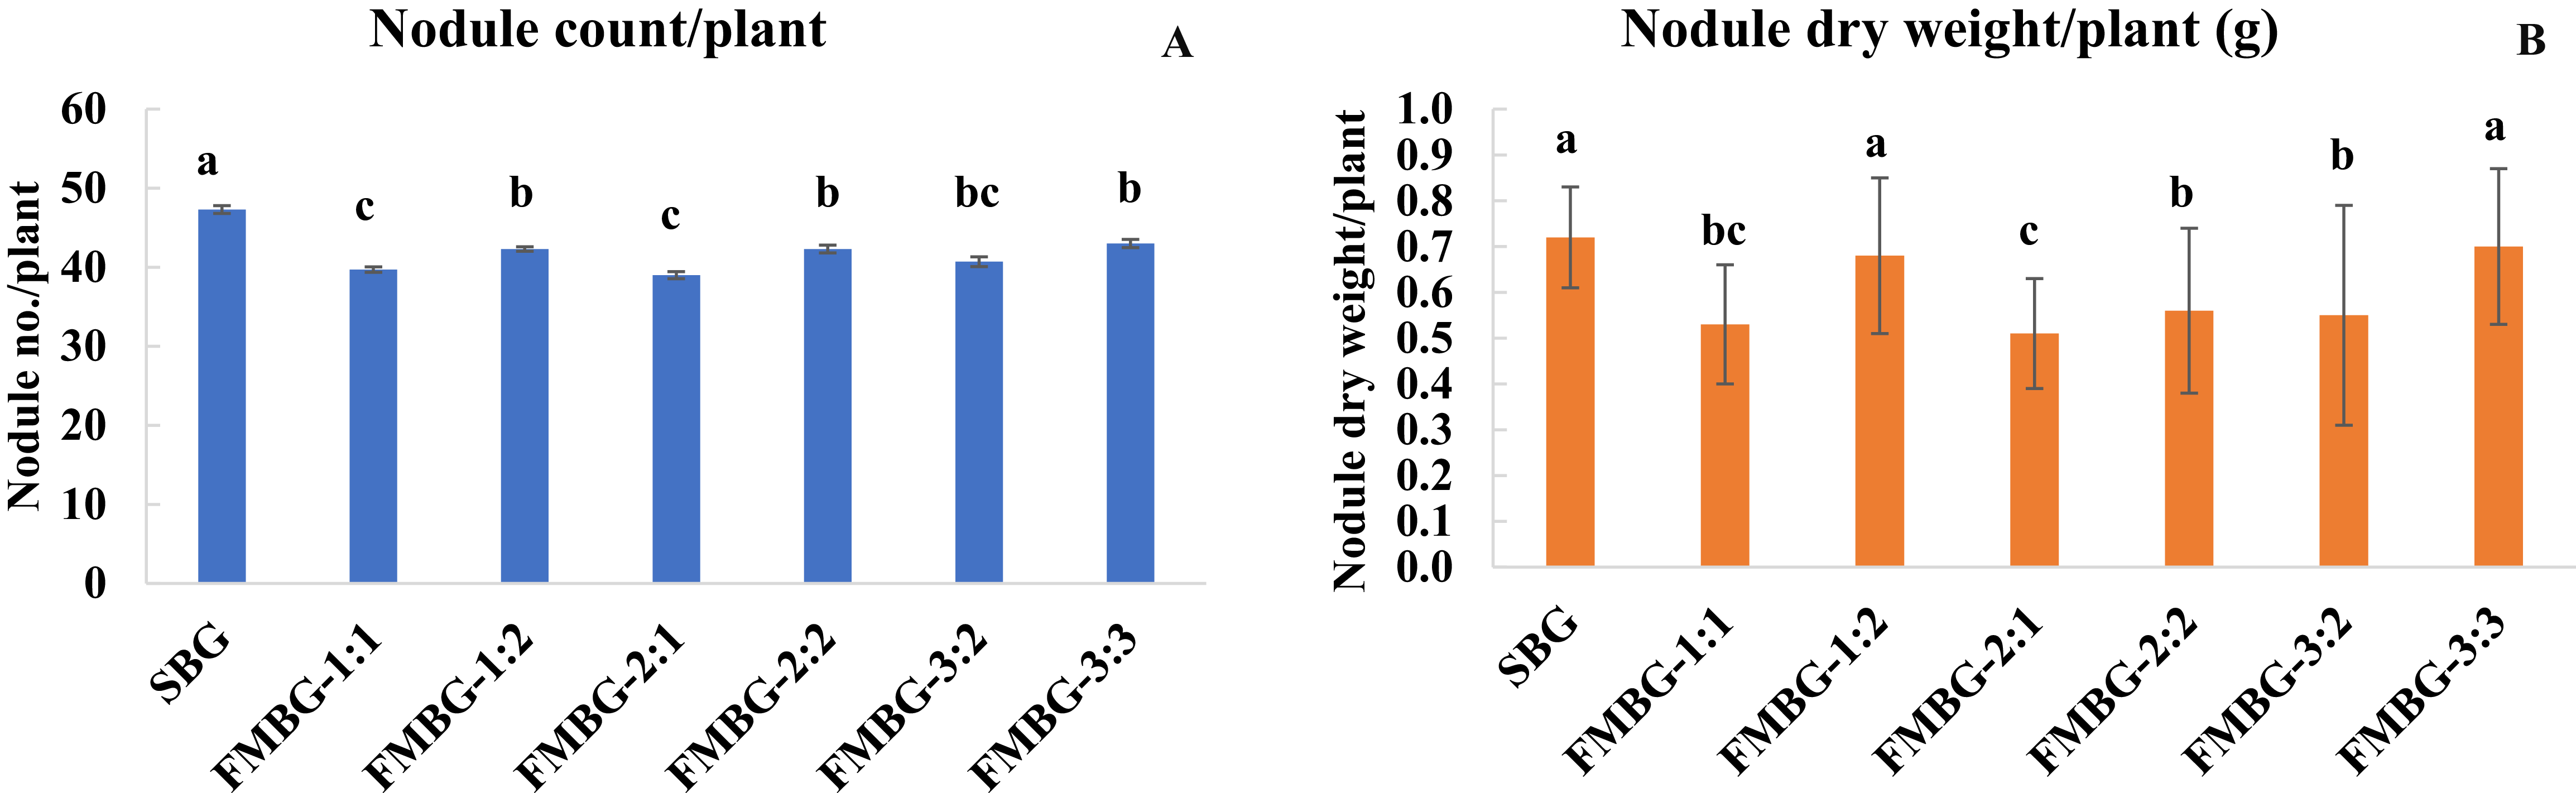
In case of growth attributes of black gram viz., plant height, and dry matter accumulation were recorded at 30, 45, 60, 75 DAS and at harvest (Table 4). At harvest, SBG recorded 26.79% and 35.87% more plant height, and DMA, respectively, over the lowest performing intercropping system of finger millet and black gram (2:1) (FMBG-2:1). Sole BG (SBG) was statistically at par with intercropping system of finger millet and black gram (3:3) (FMBG-3:3) between 30–45 DAS for CGR (Table 5). Among different cropping systems, numbers of nodule/plant and nodule dry weight with 21.28% and 41.18% increase, respectively, were obtained from SBG compared to the lowest count under intercropping system of finger millet and black gram (2:1) (FMBG-2:1), followed by intercropping system of finger millet and black gram (1:2) (FMBG-1:2) and intercropping system of finger millet and black gram (3:3) (FMBG-3:3). Intercropping system of finger millet and black gram (1:2) (FMBG-1:2), intercropping system of finger millet and black gram (3:3) (FMBG-3:3), intercropping system of finger millet and black gram (2:2) (FMBG-2:2) and intercropping system of finger millet and black gram (3:2) (FMBG-3:2) were statistically at par with each other for nodule/plant and sole BG (SBG) and intercropping system of finger millet and black gram (1:2) (FMBG-1:2) were statistically at par with each other for nodule dry weight (Figure 2A, B).
(A–B): Nodule characteristics of black gram at 45 DAS under differing cropping systems (mean of two years); SFM: Sole finger millet (FM), SBG: Sole black gram (BG), FMBG-1:1: FM + BG (1:1), FMBG-1:2: FM + BG (1:2), FMBG-2:1: FM + BG (2:1), FMBG-2:2: FM + BG (2:2), FMBG-3:2: FM + BG (3:2), FMBG-3:3: FM + BG (3:3); Means shown along with different letters in the graph are significantly different at p ≤ 0.05 by DMRT.

Crop growth rates as influenced by various cropping systems of finger millet and black gram (mean of two years)

Table 5. Long description
The table presents crop growth rates in grams per square meter per day for finger millet and black gram under different treatments. It has 11 rows and 9 columns. The columns are labeled as Treatments, Finger millet 30-60 DAT, Finger millet 60-90 DAT, Finger millet 90 DAT-harvest, Black gram 30-45 DAS, Black gram 45-60 DAS, Black gram 60-75 DAS, and Black gram 75 DAS-harvest. The treatments include SFM, SBG, FMBG-1:1, FMBG-1:2, FMBG-2:1, FMBG-2:2, FMBG-3:1, FMBG-3:2, and FMBG-3:3. Row 1: SFM, 4.3d, 8.5d, 1.3c, -, -, -, -. Row 2: SBG, -, -, -, 9.54a, 11.42a, 10.54a, 0.70d. Row 3: FMBG-1:1, 8.7bc, 9.4cd, 2.7a, 7.53ef, 8.91c, 8.12b, 1.65a. Row 4: FMBG-1:2, 12.5a, 14.3a, 2.6a, 8.72bc, 10.16b, 10.25a, 0.86c. Row 5: FMBG-2:1, 8.2c, 8.7d, 2.5ab, 7.02f, 8.96c, 7.90b, 0.17e. Row 6: FMBG-2:2, 10.1b, 12.0b, 2.6a, 8.40cd, 9.33bc, 9.49ab, 0.82cd. Row 7: FMBG-3:1, 9.5b, 10.2c, 2.5ab, 7.92de, 9.25c, 9.01ab, 1.14b. Row 8: FMBG-3:2, 11.9a, 13.0ab, 2.3b, 9.02ab, 10.21b, 10.13a, 0.75d.
SFM: Sole finger millet (FM), SBG: Sole black gram (BG), FMBG-1:1: FM + BG (1:1), FMBG-1:2: FM + BG (1:2), FMBG-2:1: FM + BG (2:1), FMBG-2:2: FM + BG (2:2), FMBG-3:2: FM + BG (3:2), FMBG-3:3: FM + BG (3:3); Means shown along with different letters within a column are significantly different at p ≤ 0.05 by DMRT.
Yield parameters, yield, and system productivity
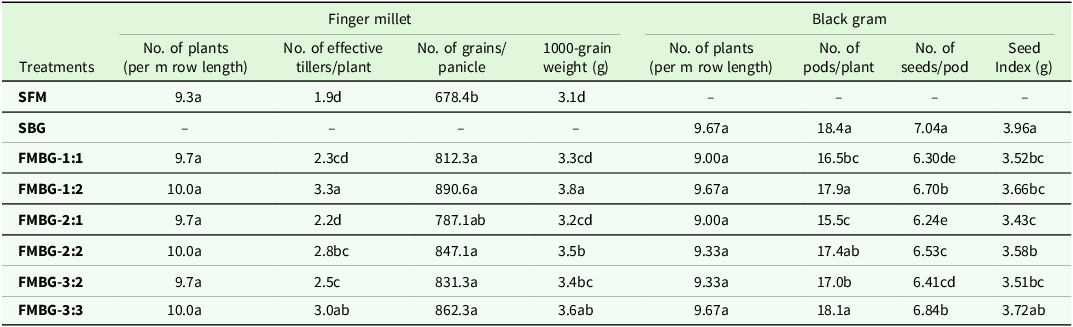
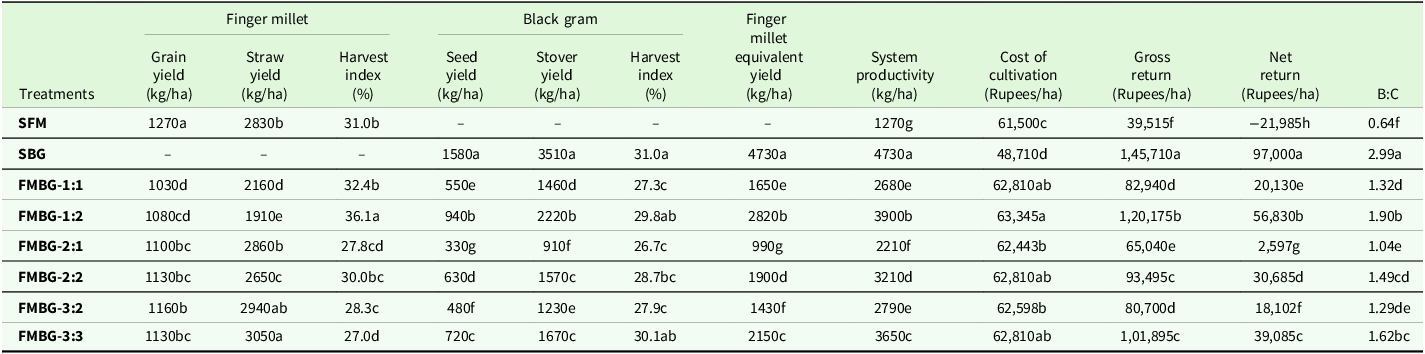
When compared to their respective sole crops, the results showed that intercropping had a positive impact on the yield parameters of both black gram and finger millet (Table 6). In finger millet, intercropping system of finger millet and black gram (1:2) (FMBG-1:2) outperformed others, specifically, registering 18.4%, 23.8%, 42.4% higher 1000-grain weight, grains per panicle, and effective tillers per plant, respectively, over the SFM, closely followed by intercropping system of finger millet and black gram (3:3) (FMBG-3:3). However, in black gram, sole BG planting (SBG) stood best by registering 15.8%, 11.4% and 13.4% higher pods per plant, seeds per pod, and seed index, respectively, over the lowest performing intercropping system of finger millet and black gram (2:1) (FMBG-2:1). Sole FM (SFM) cropping recorded 23.3% increase in grain yield compared to the lowest performing intercropping system of finger millet and black gram (1:1) (FMBG-1:1), followed by intercropping system of finger millet and black gram (3:2) (FMBG-3:2) (Table 7). Intercropping system of finger millet and black gram (3:3) (FMBG-3:3) recorded 7.78% increase in straw yield compared to SFM. Regarding harvest index (HI), intercropping system of finger millet and black gram (1:2) (FMBG-1:2) stood best as it recorded 33.70% higher HI of finger millet than lowest registering intercropping system of finger millet and black gram (3:3) (FMBG-3:3). In case of black gram, the maximum seed yield, stover yield and harvest index were recorded in SBG with an increase of 378.79%, 285.71% and 16.1%, respectively, compared to the lowest performing intercropping system of finger millet and black gram (2:1) (FMBG-2:1) (Table 7). System grain equivalent yield of finger millet was obtained when yield of black gram was converted to yield of finger millet based on their market price. Statistically significant variations existed among sole and different intercropping systems of finger millet and black gram regarding system productivity. System productivity was found maximum in case of sole BG (SBG) with 272.44% increase compared to the lowest system productivity of SFM. The sequence of system productivity varied among cropping systems was SBG > FMBG-1:2 > FMBG-3:3 > FMBG-2:2 > FMBG-3:2 > FMBG-1:1 > FMBG-2:1 > SFM (Table 6).
Yield attributes of crops as influenced by various cropping systems of finger millet and black gram (mean of two years)

Table 6. Long description
The table compares yield attributes of finger millet and black gram under various cropping systems. It has 8 rows and 10 columns. The columns are labeled as Treatments, No. of plants (per m row length), No. of effective tillers/plant, No. of grains/panicle, 1000-grain weight (g), No. of plants (per m row length), No. of pods/plant, No. of seeds/pod, Seed Index (g). The rows are labeled as SFM, SBG, FMBG-1:1, FMBG-1:2, FMBG-2:1, FMBG-2:2, FMBG-3:2, FMBG-3:3. Each row provides specific values for the yield attributes of finger millet and black gram under different treatments. Notable trends include the highest 1000-grain weight, grains per panicle, and effective tillers per plant in finger millet under the FMBG-1:2 treatment, and the highest pods per plant, seeds per pod, and seed index in black gram under the SBG treatment.
SFM: Sole finger millet (FM), SBG: Sole black gram (BG), FMBG-1:1: FM + BG (1:1), FMBG-1:2: FM + BG (1:2), FMBG-2:1: FM + BG (2:1), FMBG-2:2: FM + BG (2:2), FMBG-3:2: FM + BG (3:2), FMBG-3:3: FM + BG (3:3); Means shown along with different letters within a column are significantly different at p ≤ 0.05 by DMRT.
Yield and economics as influenced by various cropping systems of finger millet and black gram (mean of two years)

Table 7. Long description
A table comparing yield and economics of various cropping systems of finger millet and black gram. The table has 10 rows and 14 columns. Column headers are: Treatments, Grain yield (kg/ha), Straw yield (kg/ha), Harvest index (%), Seed yield (kg/ha), Stover yield (kg/ha), Harvest index (%), Finger millet equivalent yield (kg/ha), System productivity (kg/ha), Cost of cultivation (Rupees/ha), Gross return (Rupees/ha), Net return (Rupees/ha), B.C. Row 1: SFM, 1270a, 2830b, 31.0b, -, -, -, 1270g, 61,500c, 39,515f, -21,985h, 0.64f. Row 2: SBG, -, -, -, 3510a, 4730a, 31.0a, 4730a, 48,710d, 1,45,710a, 97,000a, 2.99a. Row 3: FMBG-1:1, 1030d, 2160d, 32.4b, 550e, 1460d, 27.3c, 1650e, 2680e, 62,810ab, 82,940d, 20,130e, 1.32d. Row 4: FMBG-1:2, 1080cd, 1910e, 36.1a, 940b, 2220b, 29.8ab, 2820b, 3900b, 63,345a, 1,20,175b, 56,830b, 1.90b. Row 5: FMBG-2:1, 1100bc, 2860b, 27.8cd, 330g, 910f, 26.7c, 990f, 2210f, 62,443b, 65,040e, 2,597g, 1.04e. Row 6: FMBG-2:2, 1130bc, 2650c, 30.0bc, 630d, 1570c, 28.7bc, 1900d, 3210d, 62,810ab, 93,495c, 30,685d, 1.49cd. Row 7: FMBG-3:1, 1160b, 2940ab, 28.3c, 480f, 1230e, 27.9c, 1430f, 2790e, 62,598b, 80,700c, 18,102f, 1.29de. Row 8: FMBG-3:2, 1130bc, 3050a, 27.0d, 720c, 1670c, 30.1ab, 2150c, 3650c, 62,810ab, 1,01,895c, 39,085c, 1.62bc. Row 9: FMBG-3:3, 1130bc, 3050a, 27.0d, 720c, 1670c, 30.1ab, 2150c, 3650c, 62,810ab, 1,01,895c, 39,085c, 1.62bc.
SFM: Sole finger millet (FM), SBG: Sole black gram (BG), FMBG-1:1: FM + BG (1:1), FMBG-1:2: FM + BG (1:2), FMBG-2:1: FM + BG (2:1), FMBG-2:2: FM + BG (2:2), FMBG-3:2: FM + BG (3:2), FMBG-3:3: FM + BG (3:3); Means shown along with different letters within a column are significantly different at p ≤ 0.05 by DMRT.
Economics
While comparing the cropping systems, intercropping system of finger millet and black gram (1:2) (FMBG-1:2) fetched maximum cost of cultivation (Rupees 63345/ha) which was 1.3 times higher over lowest cultivation cost requiring SBG (Rupees 48710/ha) and 1.03 times higher over SFM (Rupees 61500/ha). However, gross, net returns and B:C showed a different trend, in which sole BG (SBG) ensured the maximum gross return (Rupees 145710/ha) which was 3.69 times higher over lowest returning sole FM (SFM). Further, SBG also recorded the highest net return (Rupees 97000/ha) and B:C (2.99). Amongst intercropping systems, intercropping system of finger millet and black gram (1:2) (FMBG-1:2) registered maximum gross return (Rupees 120175/ha), net return (Rupees 56830/ha) and B:C (1.90), which were respectively 1.85, 21.9 and 1.82 times higher over poorest performing intercropping system of finger millet and black gram (2:1) (FMBG-2:1). Regarding economic return and profitability, FMBG-1:2 was closely followed by intercropping system of finger millet and black gram (3:3) (FMBG-3:3) which recorded 1.56, 15.05 and 1.56 times higher gross return, net return and B:C, respectively, over FMBG-2:1. The sequence of gross, net returns and B:C varied among cropping systems was SBG > FMBG-1:2> FMBG-3:3> FMBG-2:2> FMBG-1:1> FMBG-3:2> FMBG-2:1> SFM (Table 7).
Quality parameters
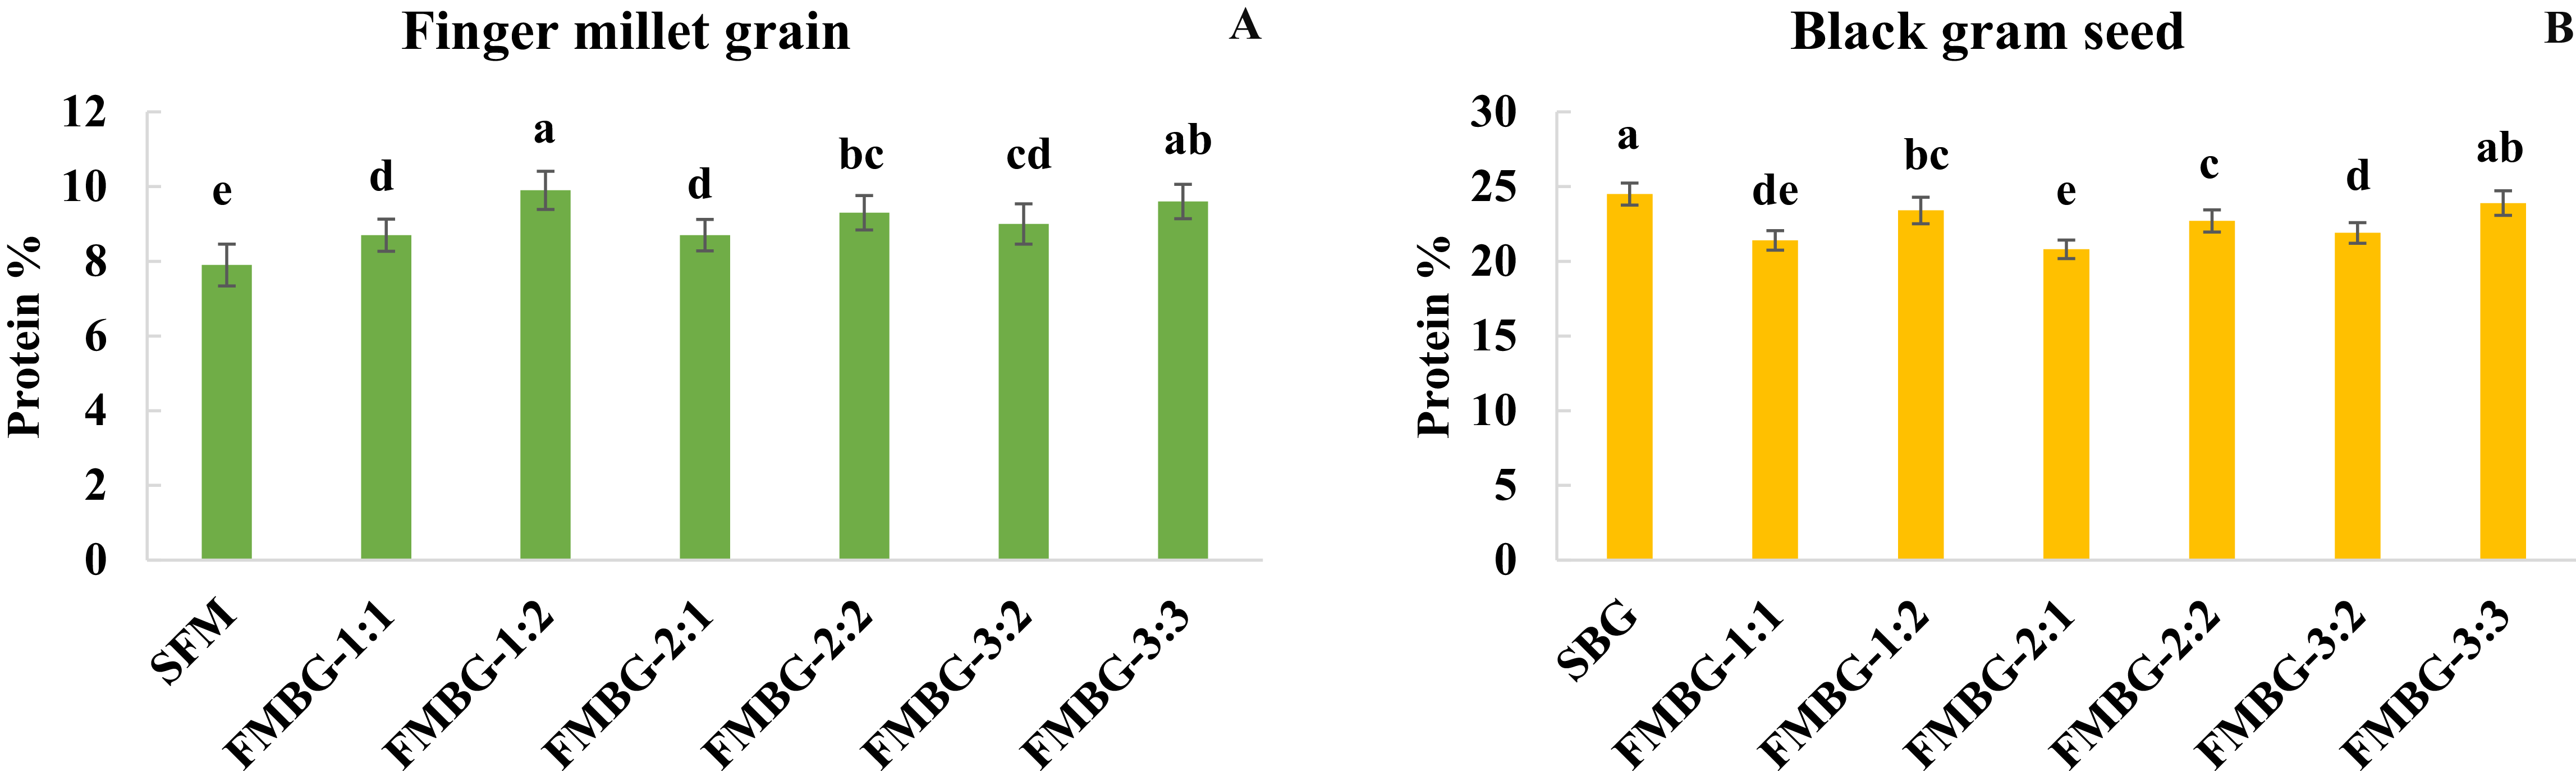
The protein content of finger millet increased by 25.3% under intercropping system of finger millet and black gram (1:2) (FMBG-1:2) over the poorest performing SFM. It was closely followed by intercropping system of finger millet and black gram (3:3) (FMBG-3:3) and intercropping system of finger millet and black gram (2:2) (FMBG-2:2) which recorded 17.7% and 15.1% increase in grain protein of finger millet over the SFM. Amongst the intercropping systems, intercropping system of finger millet and black gram (2:1) (FMBG-2:1) performed poorly in registering the grain protein of finger millet. In black gram, the seed protein content increased by 15.1% in case of sole BG (SBG) over the least performing intercropping system of finger millet and black gram (2:1) (FMBG-2:1). Amongst the intercropping systems, intercropping system of finger millet and black gram (3:3) (FMBG-3:3) attained 14.9% increments in the seed protein content over the intercropping system of finger millet and black gram (2:1) (FMBG-2:1) (Figure 3A, B).
(A–B): protein contents of finger millet grain and black gram seeds under differing cropping systems (mean of two years); SFM: Sole finger millet (FM), SBG: Sole black gram (BG), FMBG-1:1: FM + BG (1:1), FMBG-1:2: FM + BG (1:2), FMBG-2:1: FM + BG (2:1), FMBG-2:2: FM + BG (2:2), FMBG-3:2: FM + BG (3:2), FMBG-3:3: FM + BG (3:3); Means shown along with different letters in the graph are significantly different at p ≤ 0.05 by DMRT.

Soil status after harvest
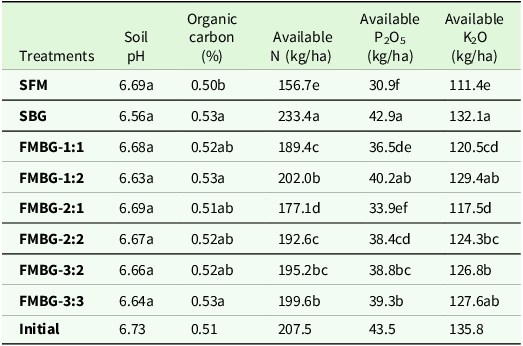
The soil status of the experimental field after crop harvest (Table 8) was found to be slightly acidic, which was almost similar as the initial pH of the soil. Organic carbon % after harvesting was found to be less than the initial percentage in SFM (0.50%). However, it was higher in the case of SBG (0.53%) which was statistically equivalent to intercropping system of finger millet and black gram (1:2) (FMBG-1:2) and intercropping system of finger millet and black gram (3:3) (FMBG-3:3). Available nitrogen (N), phosphorus (P2O5) and potassium (K2O) of the soil were also found to be less than the initial value except sole BG (SBG) which recorded the highest values of these, while the values were found lowest in sole FM (SFM).
Post-harvest soil status as influenced by various cropping systems of finger millet and black gram (mean of two years)

Table 8. Long description
The table presents the soil status of an experimental field after crop harvest, comparing various treatments. It includes measurements of soil pH, organic carbon percentage, and available nutrients (nitrogen, phosphorus (P2O5), and potassium (K2O)). The table has 11 rows and 6 columns. The columns are labeled as Treatments, Soil pH, Organic carbon (%), Available N (kg/ha), Available P2O5 (kg/ha), and Available K2O (kg/ha). The treatments include SFM, SBG, FMBG-1:1, FMBG-1:2, FMBG-2:1, FMBG-2:2, FMBG-3:2, FMBG-3:3, and Initial. Each row provides specific values for each treatment. Notable trends include SBG having the highest values for available nitrogen, phosphorus, and potassium, while SFM has the lowest values. The organic carbon percentage is higher in SBG, FMBG-1:2, and FMBG-3:3 compared to the initial percentage.
SFM: Sole finger millet (FM), SBG: Sole black gram (BG), FMBG-1:1: FM + BG (1:1), FMBG-1:2: FM + BG (1:2), FMBG-2:1: FM + BG (2:1), FMBG-2:2: FM + BG (2:2), FMBG-3:2: FM + BG (3:2), FMBG-3:3: FM + BG (3:3); Means shown along with different letters within a column are significantly different at p ≤ 0.05 by DMRT.
Competition indices in intercropping
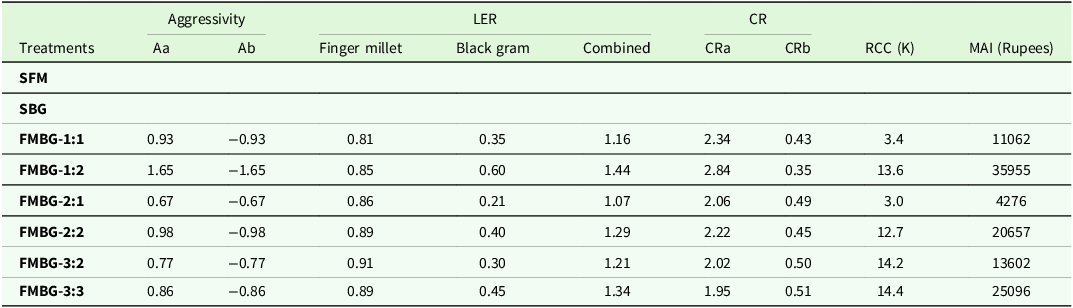
Among the six intercropping systems of finger millet and black gram, combined LER and aggressivity index (Aa) respectively showed a 34.6% and 146% increase in intercropping system of finger millet and black gram (1:2) (FMBG-1:2) than in intercropping system of finger millet and black gram (2:1) (FMBG-2:1) with the lowest LER of 1.07 and Aa of 0.67. Competitive ratio (CRa) was found 45.6% higher under intercropping system of finger millet and black gram (1:2) (FMBG-1:2) than under intercropping system of finger millet and black gram (3:3) (FMBG-3:3). On the other side, an opposite trend was found in CRb which indicated less competitiveness of black gram over finger millet among all the intercropping systems of finger millet and black gram. Among the intercropping systems of finger millet and black gram, RCC was 380% more in intercropping system of finger millet and black gram (3:3) (FMBG-3:3) than the lowest RCC was obtained from intercropping system of finger millet and black gram (2:1) (FMBG-2:1). MAI was found 741% more in intercropping system of finger millet and black gram (1:2) (FMBG-1:2) (Rupees 35955/-), than the lowest MAI in intercropping system of finger millet and black gram (2:1) (FMBG-2:1) (Rupees 4276/-); followed by intercropping system of finger millet and black gram (3:3) (FMBG-3:3) (Rupees 25096/-) and intercropping system of finger millet and black gram (2:2) (FMBG-2:2) (Rupees 20657/-) (Table 9).
Competition indices of various intercropping systems of finger millet and black gram (mean of two years)

Table 9. Long description
A table with seven rows and nine columns comparing different intercropping systems of finger millet and black gram. The columns are labeled Aggressivity (Aa), Aggressivity (Ab), LER Finger millet, LER Black gram, LER Combined, CR (CRa), CR (CRb), RCC (K), and MAI (Rupees). The rows are labeled with different treatments: SFM, SBG, FMBG-1:1, FMBG-1:2, FMBG-2:1, FMBG-2:2, FMBG-3:2, and FMBG-3:3. Each row provides values for the respective treatments across the different columns. Notable trends include the highest LER Combined value of 1.44 for FMBG-1:2 and the lowest LER Combined value of 1.07 for FMBG-2:1. The highest MAI value is 35955 Rupees for FMBG-1:2, while the lowest MAI value is 4276 Rupees for FMBG-2:1.
SFM: Sole finger millet (FM), SBG: Sole black gram (BG), FMBG-1:1: FM + BG (1:1), FMBG-1:2: FM + BG (1:2), FMBG-2:1: FM + BG (2:1), FMBG-2:2: FM + BG (2:2), FMBG-3:2: FM + BG (3:2), FMBG-3:3: FM + BG (3:3); Means shown along with different letters within a column are significantly different at p ≤ 0.05 by DMRT.
Discussion
Weed is a major competitor for all crops. In this study, cereal-legume intercropping systems suppressed weeds to variable extents. Black gram was a short-grown cover crop and, therefore, it covered the land area, especially, the vacant spaces from where weeds emerge. Additionally, it blocked the sunlight which was one of the essential factors for weed growth and thus, suppressed the weed population (Lemessa and Wakjira, Reference Lemessa and Wakjira2015). Accordingly, crop–weed competition for different essential resources might also vary resulting in variable availability and utilization of resources by crop. Hence, the present result might be due to the fact that under variable weed control by cropping systems, the crops responded positively to different essential resources like nutrients, water, space, sunlight etc. In 1:2 and 3:3 intercropping systems of finger millet and black gram, weed suppression was better than the other intercropping systems as the comparative population of black gram was higher leading to covering the vacant spaces and blockage of sunlight entry to a high extent. Earlier, Sathishkumar et al. (Reference Sathishkumar, Srinivasan, Subramanian and Rajesh2020) also found less weed density in cotton field under intercropping systems.
During the active vegetative stage of crop development, the crop growth rate (CGR) rose significantly. Increased branching and improved leaf area development raised the photosynthetically active surface. This, further, increased solar radiation interception and use. A higher CGR resulted from an increase in assimilate production and dry matter accumulation per unit area per unit time. Mukherjee et al. (Reference Mukherjee, Biswas, Sankar, Biswas, Sarkar, Yadav, Dey, Pathak, Gowtham, Biswas, Dhote, Mishra, Singh and Dutta2023) observed similar results, attributing the rise in CGR during the vegetative stage to enhanced photosynthetic efficiency and canopy growth. However, as the crop progressed towards maturity, rate of photosynthesis might be slowed down leading to a decline in crop growth rate at later stages of crop growth. Further, the best nodule characteristics was found in sole black gram possibly due to favourable growth condition for the crop as there was no competition with finger millet as well as suppression of weeds leading to better development of root and, thereby, nodulation. In intercropping systems, finger millet also benefitted from the component crop black gram, which fixed nitrogen through symbiotic association with rhizobium and root nodules of the crop (Sadiq et al., Reference Sadiq, Rahim, Iqbal, Alqahtani, Tahir, Majeed and Ahmed2023). The additional uptake of nitrogen (a constituent of chlorophyll) by the finger millet helped in photosynthesis and translocation of photo assimilates from source (vegetative parts) to sink (reproductive parts) (Biswas et al., Reference Biswas, Jana, Agrawal and Puste2020). The higher yield attributes were under intercropping of finger millet and black gram (1:2) as there were more black gram population than the finger millet in that plot, and that high black gram population fixed more nitrogen from atmosphere in the soil and finger millet growing along with black gram took the nitrogen up, resulting in improved growth and development of reproductive parts (Girisha et al., Reference Girisha, Bhairappanavar and Koler2020). Additionally, organic manure applied at basal might help in the early decomposition and quick release of nutrients at initial growth of the plants which promoted photosynthesis and further partition of dry matter for reproductive part development (Kumar et al., Reference Kumar, Singh, Yogeshwar, Sachchidanand and Singh2009; Mishra, Reference Mishra2014). The result was in conformity with the findings of Yadav et al. (Reference Yadav, Chand and Thenua2016) in maize-mungbean intercropping systems. As the occupancy of the land by sole finger millet was highest (100%), it showed the highest grain and straw yields (Bitew et al., Reference Bitew, Alemayehu, Adgo and Assefa2021). Intercropping systems showed variations in grain and straw yields of finger millet based on their respective land coverage. Choudhary (Reference Choudhary2014) also observed a similar type of result in maize–legume intercropping system. On the other hand, sole cropping of black gram received the benefits of maximum biological nitrogen fixation (as there was no finger millet to compete for it), whereas intercropping of finger millet and black gram, especially, at 3:3 and 1:2 ratios provided comparatively higher benefits of biological nitrogen fixation by comparatively more population of black gram than the other intercropping systems of finger millet and black gram, helping black gram plant to synthesize greater yield attributes. 2:1 intercropping system of finger millet and black gram resulted lowest yield attributes. It was because compared to others, 2:1 intercropping system of finger millet and black gram showed high competition from high no. of finger millet plants with black gram for the biologically fixed nitrogen in soil. Additionally, the variations in weed infestations in different cropping systems also created variation in the seed and stover yield of black gram. Like finger millet, in different cropping system involving black gram, yield variability occurred based on their respective land coverage also. Kakon et al. (Reference Kakon, Saha, Ahmed and Jahan2007) in maize–pea and Naik et al. (Reference Naik, Sumathi and Kadiri2017) in maize-legumes intercropping systems noticed similar observations. Further, the tall stature of finger millet posed shading effect on short black gram crop leading to less harvesting of sunlight by black gram under intercropping systems for photosynthesis and synthesis of crop yield. In case of 1:2 or 3:3 intercropping systems, the shading effect was comparatively less due to more space available for black gram strips resulting in higher growth and yield of black gram. Additionally, increase in yield attributes due to higher weed control by black gram as cover crop perhaps directly reflected to seed and stover yields of black gram. Similar type of result was observed by Fan et al. (Reference Fan, Chen, Cheng, Raza, Wu, Wang, Liu, Wang, Wang, Yong, Liu, Liu, Du, Shu, Yang and Yang2018) in maize-soybean relay intercropping system.
Production economics was the reflection of system productivity. Lowest cost of cultivation was noted from sole black gram, while intercropping system of finger millet and black gram (1:2) recorded the highest cost of cultivation. It was due to less cost required to purchase different inputs for sole black gram cultivation. Gross return was dependent on yield and market price of the produce. Here, sole black gram also ensured highest gross return, net return and B:C, while economic loss was incurred by sole finger millet. It showed poor growth and high crop–weed competition for resources in sole finger millet. Higher weed infestation in sole finger millet cropping possibly grabbed the resources like moisture, nutrients, sunlight etc. which were actually meant for the crop. Besides, leaching, runoff loss of nutrients, insufficient aeration, etc. during monsoon season also negatively affected the growth and yield of the crop, which reflected the economic returns of the crop under the sole cropping system. Due to decreased productivity and the lack of biological nitrogen fixation benefits from black gram, which are available in intercropping systems, sole finger millet reported negative returns. Furthermore, the absence of an intercrop decreased overall system income and yield, leading to gross returns that were insufficient to cover cultivation expenses. This negative net return indicated the inefficiency of the organic farming system for sole finger millet cultivation during monsoon season. Among the intercropping systems, finger millet + black gram (1:2) ensured comparatively higher gross return, net return, and B:C, indicating the economic profitability. Positive influence of weed suppression, biological nitrogen fixation, and complementary interactions between crops might facilitate the system productivity, leading to high economic profitability in this intercropping system (Biswas et al., Reference Biswas, Jana, Agrawal and Puste2020).
Nitrogen is the constituent of protein. Higher nitrogen uptake results in synthesis of high protein contents of the plant parts (Wan et al., Reference Wan, Gao, Wang, Lei, Tao, Feng and Gao2023). In this study, the highest protein content of finger millet grain was found in intercropping system of finger millet and black gram (1:2), closely followed by intercropping system of finger millet and black gram (3:3). It was due to higher plant population of black gram resulting in high biological nitrogen fixation than the other intercropping systems and that nitrogen was utilized by the component crop finger millet to synthesize protein (Singh et al., Reference Singh, Sujatha, Korav, Jadhav and Adishesha2025). Sole finger millet was devoid of the benefit of biological nitrogen fixation as there was no black gram crop associated with it, leading to lowest grain protein content of finger millet. However, in case of seed protein content of black gram, sole cropping outperformed others as the maximum biological nitrogen fixation and utilization of fixed nitrogen for protein synthesis took place in that system. Haq et al. (Reference Haq, Korieng, Shiekh, Bahar, Dar, Raja, Wani and Khuroo2018) similarly reported that crude protein yield was influenced positively by various cereal-legume intercropping system due to effect of biological nitrogen fixation.
The soil status after harvest indicted a non-significant change in soil pH from the initial value. However, relatively less pH from sole black gram indicated the nitrogen acquisition as N2 from air than as NO3 from soil. Further, there might be leaching loss of bases under monsoon season and application of organic manures turning soil to become slightly acidic. it was confirmed earlier by Singh et al. (Reference Singh, Ali and Venkatesh2009). The dynamic nature of nitrogen in soil during the monsoon season might be the reason for the discrepancy between the initial and post-harvest soil N status, even if the crops’ nitrogen requirements were satisfied by FYM. In addition to crop uptake, weed infestation in the field might cause weeds to absorb a significant amount of available nitrogen (Singh et al., Reference Singh, Singh and Kumari2018). The residual soil nitrogen might also be influenced by the mineralization–immobilization processes of FYM and potential nitrogen losses by leaching or denitrification under high rainfall situations, leading to differences in the initial and post-harvest soil N levels (Beiküfner et al., Reference Beiküfner, Kühling, Vergara-Hernandez and Trautz2025). Organic C and available N were found be less in sole finger millet due to crop consumption and these were improved under sole black gram and 1:2 and 3:3 intercropping systems expressing the positive influence of legume black gram on soil C sequestration and biological nitrogen fixation (Biswas et al., Reference Biswas, Jana, Agrawal and Puste2020). Available P and K also showed almost similar trend. Legume black gram might increase the availability of potassium and phosphorus at the surface by mobilizing them from deeper layers through root exudates (Sallaku et al., Reference Sallaku, Liko, Rada and Balliu2016).
Intercropping systems showed variations in LER based on their biological nitrogen fixation, shading effect of finger millet on black gram, and WCE (Pradhan et al., Reference Pradhan, Patil, Sao, Nag and Mukherjee2018). Aggressivity index estimated whether the relative yield increase in one was greater than that of the other or not. In this study, a positive value of the aggressivity index for crop finger millet indicated the less competitiveness of black gram over finger millet. It was further confirmed by CR. RCC (>1.0) indicated advantages of the intercropping systems (especially FMBG-3:3, FMBG-3:2 and FMBG-1:2) over sole cropping. MAI value showing best from intercropping system of finger millet and black gram (1:2) (FMBG-1:2) followed the trend of competition indices and confirmed the positive influence of this intercropping system on yield of both the crops. Biswas et al. (Reference Biswas, Jana, Agrawal and Puste2020) and Habineza et al. (Reference Habineza, Kinama, Olubayo, Wanderi, Muthomi and Nzuve2017) also reported similar findings in oat–lathyrus and maize–soybean intercropping systems, respectively.
Conclusion
The intercropping systems produced better overall system advantages even though sole black gram had the best individual crop performance and sole finger millet had relatively lower production. The 1:2 finger millet–black gram intercropping system outperformed the other cropping systems in terms of weed suppression, system yield advantage, soil nutrient status, and economic profitability. Thus, during the monsoon season, this intercropping system would be a good choice for Eastern Plateau and Hill region of India; however, additional multi-location studies are required to confirm these results.
Supplementary material
The supplementary material for this article can be found at https://doi.org/10.1017/S002185962610077X.
Author contributions
SB conceptualized, supervised the work and wrote the manuscript. AM, AM and RK executed the work. PK wrote the first draft and edited the revised draft of the results section of the manuscript. RD analysed the data and prepared graphs, figures and tables.
Funding statement
This research received no specific grant from any funding agency, commercial or not-for-profit sectors.
Competing interests
The authors declare there are no conflicts of interest.
Ethical standards
Not applicable.