

INTRODUCTION
Trawling is one of the most efficient methods for catching fish worldwide and it is also the most important human intervention to cause physical disturbance to the world's continental shelves, and consequently, the physical destruction of ecosystems (Jennings & Kaiser, Reference Jennings and Kaiser1998). Trawling is targeted at specific groups of organisms, and since the trawl net is non-selective, it catches everything available in its towing path. In general, non-targeted, non-commercial species in the bycatch will be thrown overboard; a practice called discarding (Van Beek, Reference Van Beek1998). The intensity of trawl fishing has a vicious impact on benthic ecology and biodiversity (Dayton et al., Reference Dayton, Thrush, Agardy and Hofman1995), and the biological and economic loss of discarding is one of the important issues fishery managers have to tackle (Kelleher, Reference Kelleher2005).
A checklist of regional marine species provides baseline information and an important source for comparative studies on biodiversity. It is an important tool in the recognition and delimitation of areas that need protection, in assessing the damage and impacts of anthropogenic activity, the assessment of the complexity of biological communities and in the estimation of resource availability (Ramaiyan et al., Reference Ramaiyan, Purushothaman and Natarajan1987; CMFRI, 1994; Hendrickx & Harvey, Reference Hendrickx and Harvey1999).
The Trophic Level (TrL) represents the position of an organism within the food web that largely determines the state of an ecosystem (Pauly & Palomeres, Reference Pauly and Palomeres2000). This is particularly relevant in the context of rapid climate change, which has resulted in changes in the distribution of marine fish in general and of top predators, particularly fishes (Perry et al., Reference Perry, Low, Ellis and Reynolds2005). The structure and function of marine ecosystems respond drastically to inter-annual changes and inter-decadal climatic variations (McGowan et al., Reference McGowan, Cayan and Dorman1998). The TrLs for marine organisms range between 2 (for herbivores/detritivores) and 5 (for predators of marine mammals), which explains the relative position of an animal in the food web that nourishes them (Pauly et al., Reference Pauly, Christensen, Guenette, Pitcher, Sumaila, Walters, Watson and Zeller2002).
TrLs are sensitive to how anthropogenic stress and climatic variations have important implications in the smooth functioning of pelagic ecosystems and how they can influence ecological interactions throughout the food web (Edwards & Richardson, Reference Edwards and Richardson2004; Litzow & Ciannelli, Reference Litzow and Ciannelli2007). The quality and quantity of food directly affects the growth, and indirectly, the maturation and mortality, of fishes (Wootton, Reference Wootton1990). The estimation of a TrL is also very useful in quantifying the effects of fishing on marine ecosystems because it allows the development of new approaches to the analysis of marine food webs.
Due to the unprecedented expansion of fishing along the Indian coast, fish landings have increased by more than five times (Srinath, Reference Srinath, Mohan Joseph and Jayaprakash2003). In the wake of the above, changes in TrLs are widely used in monitoring the sustainability of marine fish catches and in realizing the impact of fishing on marine ecosystems. Though many works have been undertaken in foreign waters, including those from tropical countries (Christensen, Reference Christensen1998), which record a decline in the mean TrLs of fishery landings (Baisre, Reference Baisre2000; Pauly et al., Reference Pauly, Palomares, Froese, Saa, Vakily, Preikshot and Wallace2001; Furness, Reference Furness2002; Valtysson & Pauly, Reference Valtysson, Pauly, Gudmundsson and Valtysson2003), only a minimum number of studies have been conducted in Indian waters. Recently, Vivekanandan et al. (Reference Vivekanandan, Gomathy, Thirumilu, Meiyappan and Balakumar2009) studied the TrLs of fishes occurring along the Indian coast and Bijukumar & Deepthi (Reference Bijukumar and Deepthi2009) studied the mean trophic index of fish fauna of the south-west coast of India.
Over 11% of trawl catches comprise economically less-important bycatch of finfishes. This constitutes not only small-sized and non-edible species, but also juveniles of commercially important species (Sujatha, Reference Sujatha1995). Region-wise checklists of trawl bycatch constituents can be of help in improving the ichthyological knowledge of the region and for fisheries management. They can also contribute to knowledge on the distribution of non-conventional species, which are poorly represented in the catches made by traditional fishing gear.
Therefore, in view of the facts given above, the present survey has been undertaken to update the distribution, identification and the TrL of fishes occurring in the trawl bycatch collected off Cuddalore and Parangipettai, south-east coast of India.
MATERIALS AND METHODS
Samples were collected in monthly intervals from the trawl operated in the inshore waters (5–35 m depth) of Cuddalore (Station I) (11°42′N 79°47′E) and Parangipettai (Station II) (11°29′N 79°46′E), on the south-east coast of India, during January 2009–December 2010. For each sampling effort, the net was towed at an estimated speed of 2.78 km h−1 (1.5 knots) for 1 h at a depth level ranging between 5 and 35 m, thus covering a swept area of 0.0243 km2 for a 75 min tow. Samples were not collected in May, as a fishing ban was imposed for this month. After washing, fish samples were brought to the laboratory in ice boxes and kept deep-frozen for identification. Samples of each species were sorted, counted and weighed. Later, the morphological characters of specimens were examined for identification. Each fish species in the trawl bycatch was identified to species level following the methods of researchers in the field of ichthyology (Day, Reference Day1878; Fischer & Bianchi, Reference Fischer and Bianchi1984; Ramaiyan et al., Reference Ramaiyan, Purushothaman and Natarajan1987, Reference Ramaiyan, Senthilkumar and Rajasegar2002; Ramaiyan & Sivakumar, Reference Ramaiyan and Sivakumar1991; Nelson, Reference Nelson1994; Sujatha, Reference Sujatha1995; Ramaiyan & Senthilkumar, Reference Ramaiyan and Senthilkumar1998; Froese & Pauly, Reference Froese and Pauly2015).
For the TrL study, data on adult fishes alone was taken into account for analysis and data on TrLs was collected from the FishBase website (www.fishbase.org). The data on TrLs that is provided by FishBase is based on the estimation of diet composition data, following the equation proposed by Christensen & Pauly (Reference Christensen and Pauly1992).
 $${\rm TL} = {1} + ({\rm DC}_{\rm ij}{\rm TL}_{\rm j})$$
where TL = 1 + (DCij TLj), where DCij, referred to as diet composition, is the proportion of prey (j) in the diet of the species (i), TLj is the trophic level of prey (j).
The diversity indices – namely, the Shannon–Wiener index, Margalef's species richness and Pielou's evenness – for the fishes at each TrL were calculated. Cluster analysis was also conducted to determine the similarities between the TrLs using the Bray–Curtis index. The diversity indices and other calculations were carried out using PRIMER (version 6.0) software (Clarke & Warwick, Reference Clarke and Warwick2001).
RESULTS
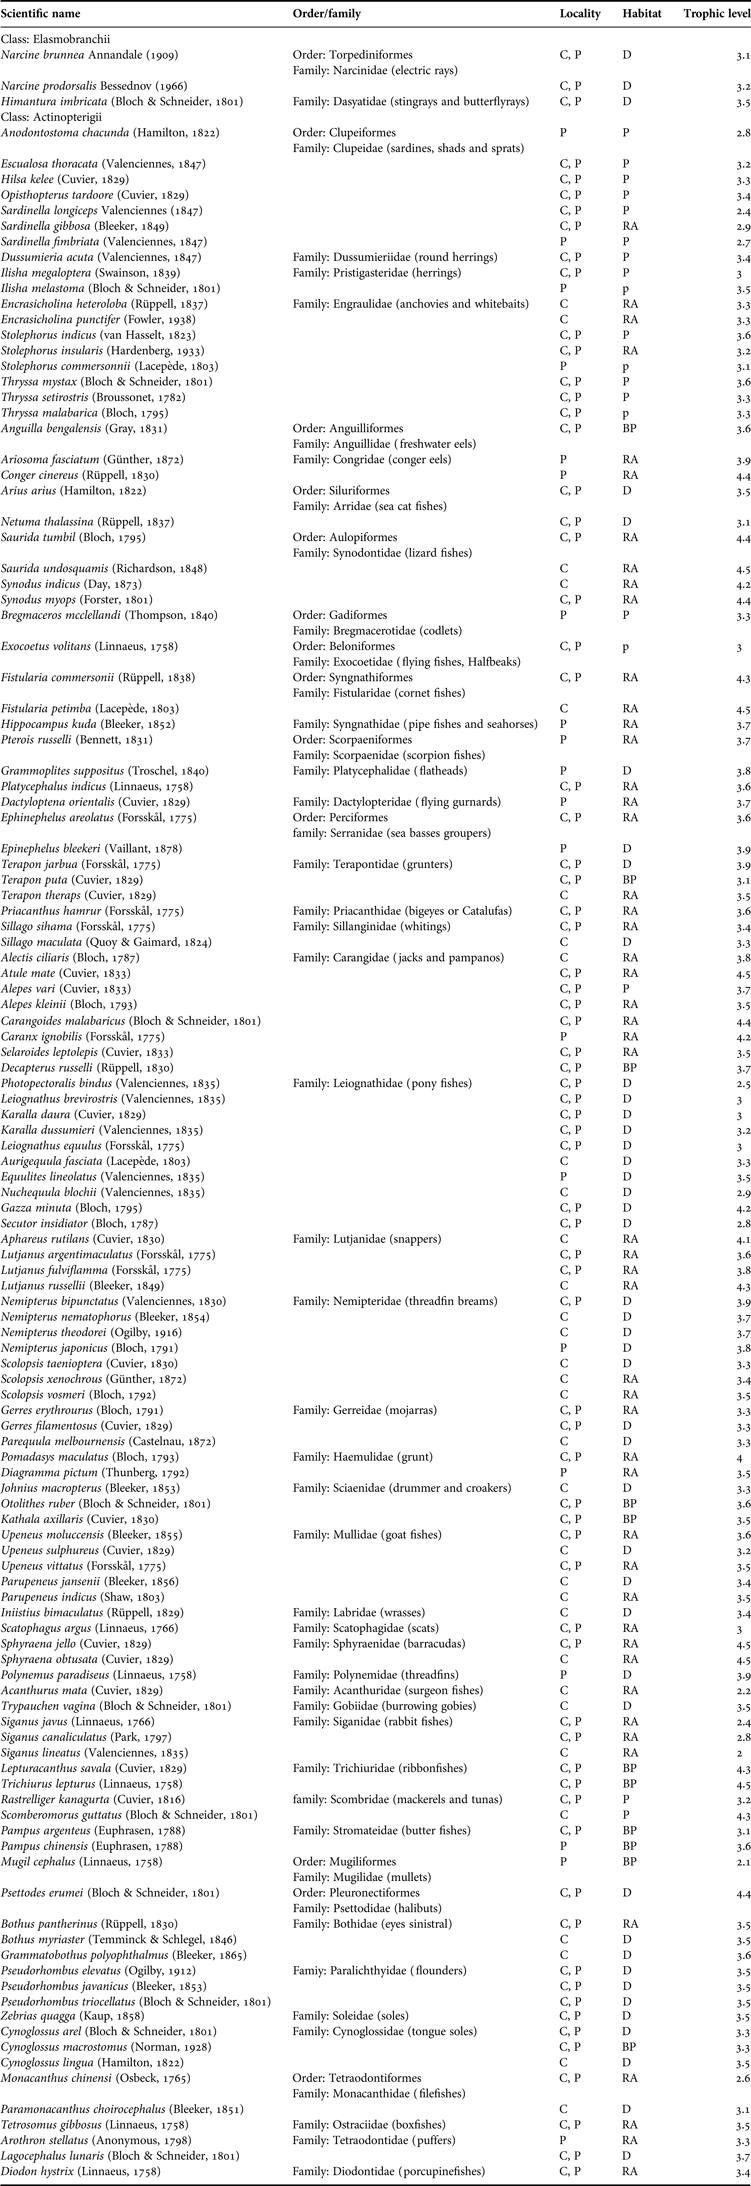
Fishes form a major contribution among the various groups in trawl bycatches. A total of 123 species of finfishes, belonging to 13 orders, 49 families and 82 genera were recorded in the trawl bycatch of stations I and II (Table 1). In Station I, as many as 103 species belonging to 11 orders, 43 families and 68 genera were recorded, while in Station II, 91 species belonging to 13 orders, 46 families and 66 genera were recorded in the trawl bycatch. Of this, 51 genera and 71 species were found to be common to both regions.
Checklist of finfishes recorded in the trawl bycatch over a period of two years, from January 2009 to December 2010, including habitat and TrLs of species.

Fish names follow FishBase (Froese & Pauly, Reference Froese and Pauly2015). C, Cuddalore; P, Parangipettai; D, Demersal; P, Pelagic; RA, Reef Associated; BP, Bentho Pelagic.
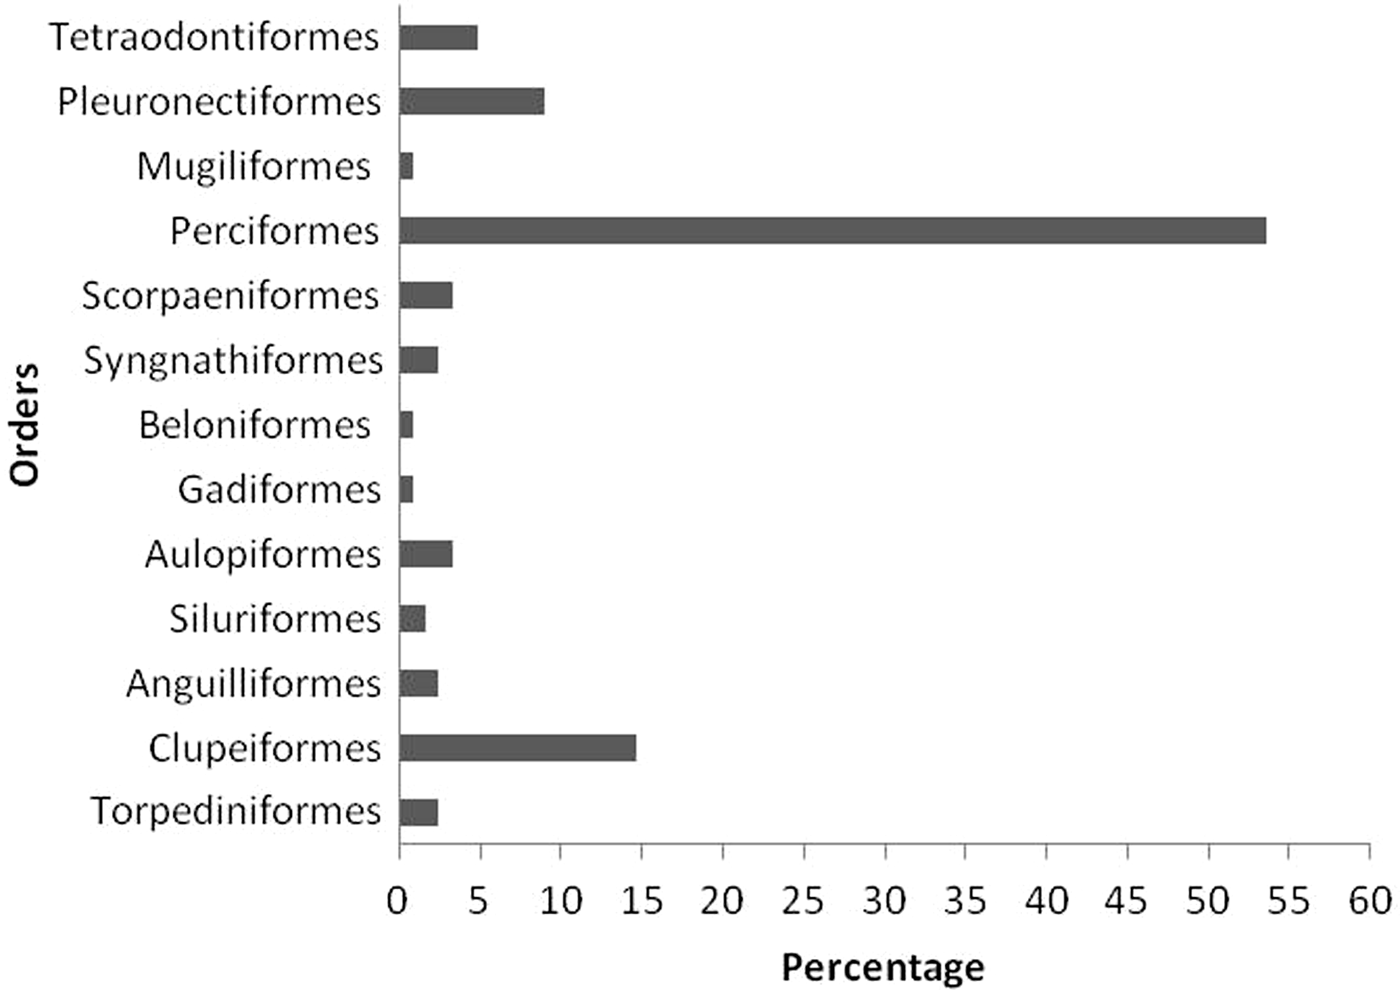
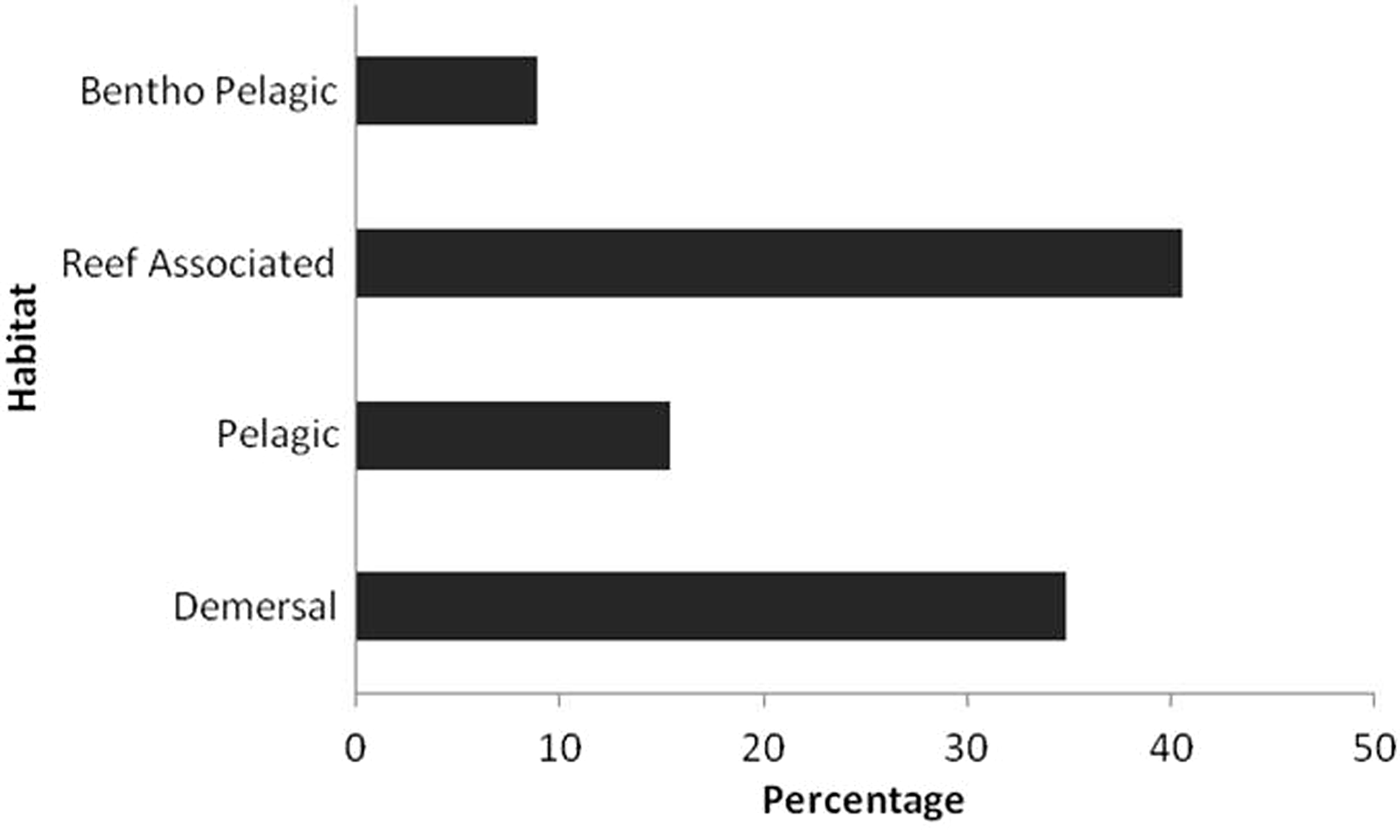
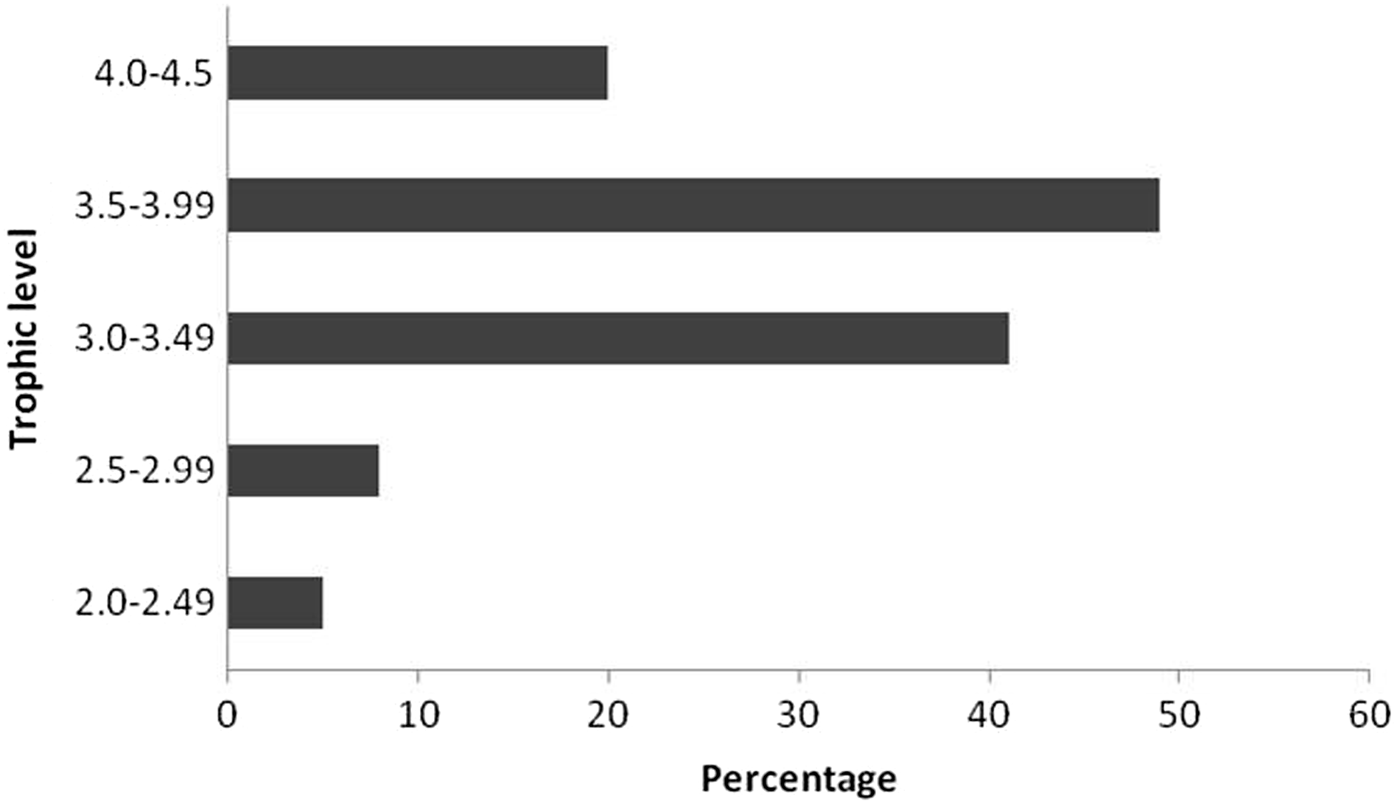
Among the orders, Perciformes dominated the catch, with 22 families, 40 genera and 66 species (53.6%), followed by Clupeiformes, with 4 families, 9 genera and 18 species (14.6%), and Pleuronectiformes, with 5 families, 6 genera and 11 species (8.9%). The other orders constituted less than ten species in both stations (Figure 1). Considering the habitat-wise species list, 50 species (40.6%) were reef associated, 43 (34.9%) were demersal, 19 (15.4%) were pelagic and 11 (8.9%) were benthopelagic (Figure 2). Among the regions, in Station I, 42 species (40.7%) were reef associated, 37 (35.9%) were demersal, 15 (14.5%) were pelagic and nine (8.7%) were benthopelagic, whereas, in Station II, 35 species (38.4%) were reef associated, 27 (29.6%) were demersal, 18 (19.7%) were pelagic and 11 (12%) were benthopelagic. Regarding the TrL species list, five species (4.0%) were recorded within the TrL range of 2.0–2.49; eight (6.5%) within 2.5–2.99 TrL; 41 (33.3%) within 3.0–3.49 TrL; 49 (39.8%) within 3.5–3.99 TrL and 20 species (16.2%) within 4.0–4.5 TrL in both stations (Figure 3).
Percentage-wise species list of various orders of fish recorded at stations I and II.
Habitat-wise species list for stations I and II.
TrL-wise species list for stations I and II.
Diversity indices of fishes within various trophic levels
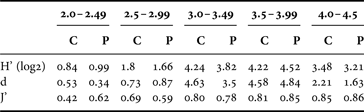
Diversity indices were calculated for the fishes recorded within various TrLs of both stations (Table 2). In Station I, the Shannon diversity and Margalef richness index ranged from 0.84 to 4.34, and from 0.53 to 4.63, respectively (minimum TrL 2.0–2.49; maximum TrL 3.0–3.49), and Pielou's evenness index ranged from 0.42 to 0.85 (minimum TrL 2.0–2.49; maximum TrL 4.0–4.5). In Station II, Shannon diversity, Margalef's richness index and Pielou's index ranged from 0.99 to 4.52 (minimum TrL 2.5–2.99; maximum TrL 3.5–3.99), 0.34 to 4.84 (minimum TrL 2.0–2.49; maximum TrL 3.5–3.99) and 0.59 to 0.86 (minimum TrL 2.5–2.99; maximum TrL 4.0–4.5).
Diversity indices calculated for fish within various TrLs in the trawl bycatch.
C, Cuddalore; P, Parangipettai; H’, Shannon-Weiner index; D, Margalef richness index; J’, Pielou's evenness index.
The dendrogram drawn using the Bray–Curtis similarity revealed that, in Station I, the TrLs of 3.0–3.49 and 3.0–3.99 showed a 98% similarity level, to which 4.0–4.5 joined at 65% and 2.0–2.49 and 2.5–2.99 formed another group at 85% similarity (Figure 4A). In Station II, 3.0–3.49 and 3.0–3.99 formed a group at 85% similarity level, 2.5–2.99 formed another group at 72% and 2.0–2.49 joined at 53% similarity level (Figure 4B). The TrLs 3.0–3.99 showed more similarity in species composition and abundance than other TrLs, which was also evident in the species list.
Dendrogram showing similarity between TrLs in: (A) station I; and (B) station II.
DISCUSSION
This study points out a large numbers of finfishes in the trawl bycatch of the inshore waters of these two stations. In total, 123 species of finfishes were identified from the trawl bycatch. Among the two coastal areas, Station I topped species numbers, with 103 species, followed by Station II, which had 91 species. Sujatha (Reference Sujatha1995) reported that around 228 species belonging to 68 families of fish have been recorded in trawl catches from Visakhapatnam (Andhra Pradesh), south-east coast of India. Gibinkumar et al. (Reference Gibinkumar, Sabu, Pravin and Boopendranath2012) reported 191 species of fishes belonging to 12 orders, 59 families and 109 genus of fishes in trawl catches from Cochin, south-west coast of India. When compared to the above references, the present study has registered a lesser number of finfish species (123 species). However, Kurup et al. (Reference Kurup, Premlal, Thomas and Anand2003) and Dineshbabu et al. (Reference Dineshbabu, Sujitha and Radhakrishnan2012) reported more or less similar numbers of species from the south-west coast of India and the Karnataka coast, respectively. This could be due to the samplings areas, the duration of catch, climatic change or the environmental factors of these areas. But for the west coast region of India, more numbers of fishes have been recorded when compared to the present study (Bijukumar, Reference Bijukumar, Natarajan, Jayachandran, Kannaiyan, Ambat and Augustine2008; Bijukumar & Deepthi, Reference Bijukumar and Deepthi2009).
Among the two stations, Station I registered a higher number of species compared to that of Station II. This might be due to the presence of more breeding grounds and, consequently, a greater abundance of fishes. Among the orders, Perciformes dominated in both study areas and a similar result was reported by Sujatha (Reference Sujatha1995) and Gibinkumar et al. (Reference Gibinkumar, Sabu, Pravin and Boopendranath2012).
Considering the habitat-wise distribution of fishes in stations I and II, reef associated fishes were dominant with 50 species, followed by demersal with 43 species, pelagic with 19 species and benthopelagic with 11 species. Among the two stations, in Station I, the reef-associated fishes were found to be the most abundant group with 42 species, followed by demersal with 37, pelagic with 15 and benthopelagic with nine species. Furthermore, in Station II, reef-associated fishes were dominant with 35 species, demersal with 27, pelagic with 18 and benthopelagic with 11 species. A similar dominance of reef-associated and demersal groups was reported by Bijukumar & Deepthi (Reference Bijukumar and Deepthi2009) for Kerala, south-west coast of India and by Vivekanandan et al. (Reference Vivekanandan, Gomathy, Thirumilu, Meiyappan and Balakumar2009) for along the Indian coast.
A TrL is considered to be the prime tool employed in marine fisheries that provides information about the complex interactions between fisheries, and so, it also generates clues about the range of the replacement of species due to fishing practices in marine ecosystems (Pauly & Watson, Reference Pauly and Watson2005). TrLs of fishes vary widely with the composition of food webs and are usually higher for large predators and top carnivores (Vivekanandan et al., Reference Vivekanandan, Srinath and Kuriakose2005).
Among the TrLs, the maximum number of species (49 species) were at the TrL of 3.5–3.99, followed by the TrLs 3.0–3.49 (41 species), 4.0–4.5 (20 species), 2.5–2.99 (eight species) and 2.0–2.49 (five species). The present findings are in harmony with those of Bijukumar & Deepthi (Reference Bijukumar and Deepthi2009), who reported the maximum number of species within the TrL range of 3.0–3.99. Vivekanandan et al. (Reference Vivekanandan, Srinath and Kuriakose2005) recorded higher landings of top-level predators along the Indian coast by collecting data for the period of 1950–2002. The elimination of predatory fish communities has been reported from oceans around the globe due to rampant fishing activities, with potentially serious consequences for ecosystems (Myers & Worm, Reference Myers and Worm2003; Worm et al., Reference Worm, Sandow, Oschlies, Lotze and Myers2005). The presence of a large number of mid-level carnivores in the trawl bycatch indicates the large-scale removal of top-level predators, as suggested by Vivekanandan et al. (Reference Vivekanandan, Srinath and Kuriakose2005). The presence of species with higher TrLs in the bycatch could have far-reaching consequences, considering the high level of carnivores and top-level predators sustaining the fisheries in this region. As predatory fishes are selectively removed from the oceans, the trawl must increasingly rely on species in the lower TrLs. This is found true in the case of species in the trawl bycatch of stations I and II, as the bycatch is dominated by mid-level carnivores, particularly demersal species. Due to trawling, the longer-lived demersal species tend to decline faster than the shorter-lived pelagic species (Pauly et al., Reference Pauly, Christensen, Guenette, Pitcher, Sumaila, Walters, Watson and Zeller2002).
The occurrence of 90 species of fish with higher TrLs (>3.5) in the trawl bycatch (more than 50% of total fish abundance in the trawl bycatch) can have far-reaching consequences, considering the high-level carnivores and top-level predators sustaining the fisheries in the region. However, studies extending over longer time-scales are required to unequivocally establish the decline of predatory fishes in trawl landings.
According to Bhathal & Pauly (Reference Bhathal and Pauly2008), even though the deployment of mechanized fleets increases the catches, there has been a negative repercussion on the mean TrLs of marine fisheries in India. The relative abundance of various species in the ecosystem is also affected by fishing. After a few years, as a consequence of this, the community structure, biodiversity and functioning of the ecosystem may be affected (Jackson et al., Reference Jackson, Kirby, Berger, Bjorndal, Botsford, Bourque, Cooke, Estes, Hughes, Kidwell, Lange, Lenihan, Pandolfi, Peterson, Steneck, Tegner and Warner2001). The TrLs of fish are conservative attributes and they cannot change much over time, even when ecosystem structure changes (Pauly et al., Reference Pauly, Christensen, Dalsgaard, Froese and Torres1998). The fisheries production of an ecosystem depends significantly on food web dynamics (Link, Reference Link2002). Commercial fishing can decrease the average body size and age of stock, causing the truncated population to track environmental fluctuations directly (Anderson et al., Reference Anderson, Hsieh, Sandin, Hewitt, Hollowed, Beddington, May and Sugihara2008). Shareet et al. (Reference Shareet, Jonathan, Escorcia, Arenas, Sanchez, Silva and Vazquez-Lopez2009) reported that the trophic composition of the different species slightly differed with respect to seasons.
The present study provides baseline information on the bycatch of finfishes encountered from bottom trawl fishery along the stations I and II. The comprehensive data generated by the present study could be used to form a valuable reference for future studies.
ACKNOWLEDGEMENTS
The authors are grateful to the Dean and Director of the Centre of Advanced study in Marine Biology, Annamalai University, for providing facilities and encouragement. The authors are also thankful to the Ministry of Environment and Forests, Government of India, for financial assistance. The first author, P. Sambandamoorthy, was supported by the University Grants Commission (CPEPA Programme), Government of India, during the preparation of this manuscript.