INTRODUCTION
Given that savanna vegetation in Sub-Saharan tropical Africa is likely to be affected by major changes in climate, including temperature, rainfall, rainfall variability and atmospheric carbon dioxide (IPCC 2001), there is a compelling need to assess the response of African savanna tree species to climate change. Increasing temperatures in southern Africa are predicted to either extend the growing season in some ecosystems or shorten it in some others (Rutherford et al. Reference RUTHERFORD, POWRIE and SCHULZE1999) and these changes will undoubtedly impact on annual tree growth. It is most likely, however, that under these predicted changes in climate, species will probably respond individualistically. It is also conceivable that different types and levels of disturbance may induce interspecific as well as intraspecific differential responses to climate change. However, ascribing growth rate changes to climate change may be complicated by the existence of autocorrelated growth in trees. Autocorrelated growth may be defined as the correlation between growth in one time interval with that in a subsequent interval often calculated over all individuals in a population (Brienen et al. Reference BRIENEN, ZUIDEMA and DURING2006, Fujiwara et al. Reference FUJIWARA, KENDALL and NISBET2004, Pfister & Stevens Reference PFISTER and STEVENS2002). For example, Kohyama et al. (Reference KOHYAMA, KUBO and MACKLIN2005) suggested that temporal autocorrelation of growth rates may be quite common among forest trees. Separating the influence of past growth on current growth from the effects of climate factors is therefore necessary in order to understand how a changing climate might impact on the growth of African savanna tree species. Further, fire and cutting of trees (e.g. for charcoal) are common in African savanna woodlands, and in some areas such as central Zambia, shoot die-back is not uncommon. Resprouting is a common form of regeneration after these sorts of disturbances (Balfour & Midgley Reference BALFOUR and MIDGLEY2006, Bond & Midgley Reference BOND and MIDGLEY2001, Chidumayo Reference CHIDUMAYO1989, Higgins et al. Reference HIGGINS, BOND and TROLLOPE2000). A major question is whether trees recruited from coppice and saplings respond differently to climate and fire.
The primary purpose of the present study is to determine climate factors that affect growth of Bauhinia thonningii Schumacher (Fabaceae) trees originating from coppice and seedlings and to assess how fire and tree size modify the influence of climate factors on tree growth over a 10-y period (1997–2007). During the last 4 y of study (2004–2007), the results are compared with those of saplings under fire protection. Bauhinia thonningii produces indehiscent pods that are consumed by livestock and wild ungulates. The species is deciduous and in central Zambia, bud break and leaf flush start in late September or early October with a leaf duration that lasts until the following August (Chidumayo Reference CHIDUMAYO2007). The species is widely distributed in subtropical Africa.
MATERIALS AND METHODS
Study site
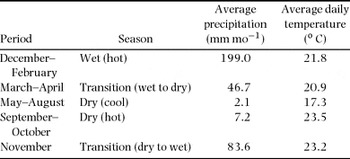
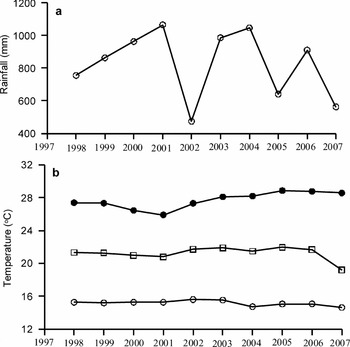
The study was conducted at a 1.0-ha permanent plot (15°28′S, 28°11′E, altitude 1260 m asl) in savanna vegetation, about 15 km south of Lusaka city, Zambia, southern Africa. The climate at Mt Makulu (15°33′S, 28°16′E, 1240 m asl), 13 km south of the study plot, is subtropical with three distinct seasons: hot-wet (December–February), cool-dry (May–August) and hot-dry (September–October), as described in Table 1. These correspond to the wet season, early and mid-dry season and late dry season of the savannas of northern Australia. In central Zambia, March to April is a transition period between the hot-wet and cool-dry seasons and November is a transition period between the hot-dry and hot-wet seasons. Year-to-year variation in temperature is negligible but precipitation is quite variable, from <600 mm rainfall to >1000 mm rainfall per year over the course of this study (Figure 1). However, weekly temperature variation may be large, especially during the cool dry season when minimum temperatures may range from 0 °C to >10 °C. The soil at the study plot is predominantly sand clay loam derived from limestone rocks. Average texture of 26 topsoil (0–30 cm depth) samples from the plot was 47% sand, 34% clay and 19% silt with a pH of 5.4.
Climatic seasons at Mt Makulu weather station at 1240 m altitude, 13 km south of the study site in Zambia.

Trends in climate factors at Mt Makulu weather station, 13 km south of study site, in central Zambia from 1997 to 2007. Annual rainfall (a) and temperature (b): annual daily average temperature (□), maximum temperature (●) and minimum temperature (○).

Five y prior to this study (1992–1993), all trees but the smallest saplings in the study plot were cut close to the ground (≈0.30 cm above ground) for charcoal production. Judging from the stumps in 1994, large trees before charcoal production were dominated by two species: Acacia sieberana DC. and B. thonningii. The herbaceous layer is dominated by the grasses Hyparrhenia dissoluta (Steud.) C.E. Hubbard, Loudetia superba De Not., Setaria sphacelata (Schum.) Stapf & Hubbard, Themeda triandra Forsk., Tristachya superba Schweinf. & Asch. and Urochloa brizantha (C. Hochstetter ex A. Rich.) R. Webster. The plot was fenced off in 1994 to keep out livestock and to minimize undesirable human disturbances in the re-growth woodland, consisting of small trees originating as sprouts on stumps (coppice) of cut trees and saplings (recruited from naturally established seedlings) that were not cut during charcoal production. There were no trees at the site that originated as root suckers that tend to dominate in sites where trees are uprooted during woodland clearing. The 1.0-ha study plot is subdivided into 12 blocks of variable sizes of which seven are under fire protection and five are burnt annually during the first half of the dry season (mid-April to mid-June). The precise timing of burning depended on the time when the seasonal rains ended. Each block is surrounded by firebreaks (≈3.0 m wide) that are annually cleared in April to prevent the spread of fire between blocks.
Sample saplings and trees
From 1998 to 2005, with the exception of 1999, 2000 and 2002, B. thonningii seeds from trees at the study plot were sown along firebreaks between blocks to raise saplings of known age (i.e. cohort saplings). Two seeds were sown per location at intervals of 1.0 m between locations and the total number of seeds sown ranged from 60 to 100. Seeds were sown at the end of November and seed locations were permanently marked so that individual saplings arising from sown seeds could subsequently be easily identified. Cohort saplings from sown seeds were protected from fire by annually clearing the herbaceous vegetation in April in the firebreaks and by ensuring that fire in adjacent blocks never damaged the saplings during annual burning.
Growth of B. thonningii was studied at two life history stages: tree and sapling. Saplings were defined as plants that were <2.0 m tall; trees were plants that were >2.0 m tall with a diameter at breast height (1.3 m above ground, dbh) of > 3.0 cm. All saplings were recruited from seedlings while trees originated from two regeneration sources: stump sprouts (coppice) arising from tree cutting for charcoal production and saplings of seedling origin not cut during charcoal production. Trees originating from seedlings and coppice were studied over a 10-y period (1997–2007) while saplings were studied over a 4-y period (2003–2007).
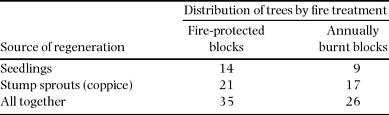
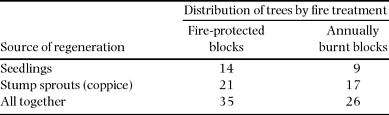
Although tree-ring chronology has a great potential for studying radial growth of African tropical trees (Hennenberg et al. Reference HENNENBERG, ORTHMANN, POREMBSKI and WORBES2006, Trouet et al. Reference TROUET, COPPIN and BEECHMAN2006, Worbes et al. Reference WORBES, STASCHEL, ROLOFF and JUNK2003), the present study involved radial growth measured with a tape due to difficulties associated with interpretation of tree-ring chronologies (Grundy Reference GRUNDY2006, Trouet et al. 2001). The study focused on B. thonningii, the dominant tree at the study site. Each tree was classified by source of regeneration (i.e. coppice or seedling). A total of 61 B. thonningii trees were in the blocks in June 1997 when initial measurements were made but tree distribution in the blocks, and consequently between the fire treatments, was uneven (Table 2). Each tree was then marked with numbered aluminium tags for subsequent identification and a permanent mark made at 1.3 m above ground on the trunk for dbh re-measurements.
Distribution of Bauhinia thonningii trees according to source of regeneration and fire treatment in June 1997 at a 1.0-ha savanna site in central Zambia.
Tree re-measurements were made annually at the beginning of the dry season in April over a 10-y period (1997–2007). Diameter measurements (to the nearest 0.1 cm) were made in the morning between 07h00 and 10h00. At the start of the measurements in 1997 the average dbh of trees regenerated from seedlings and coppice was 3.72 ± 0.39 cm and 4.18 ± 0.37 cm, respectively.
Sample saplings were either of mixed-age or seedling cohorts of uniform age raised from sown seeds at the study plot. Twelve mixed-age saplings of variable sizes were selected in one fire-protected block in June 2003 and permanently marked. In addition, 12 sample saplings representing all plant sizes in each seedling cohort were selected for study, with the exception of the 1999 cohort in which all the nine saplings (due to poor seedling emergence) were included. The mixed-age saplings and nine 1999 cohort saplings were measured annually in April for shoot basal (at ground level) diameter and main shoot length. The average basal diameter and shoot length of mixed-age saplings in 2003 were 8.8 ± 0.81 mm and 38.9 ± 3.20 cm, respectively, while similar measurements for the 1999 cohort saplings were 5.1 ± 0.58 mm and 15.3 ± 2.60 cm, respectively. From July 2006 to February 2007 bud break and appearance of new leaves were monitored and recorded every 28 d on saplings in the mixed-age group and those in the 1999 and 2003 cohorts. In December 2006, the length of the main shoot and shoot die-back incurred during the 2006 dry season, as well as diameter at the top of the live portion of the shoot (top-live diameter), were measured on all sample cohort saplings. In addition, the furthest distal point of bud break on the live shoot was also recorded on these saplings.
Data analysis
Linear modelling using regression analysis in Statistix 8® was applied at several stages of data analysis to determine the effect of climate factors and plant size on tree and sapling annual diameter increment. First the presence of autocorrelation in growth data was explored by regressing current-year on previous-year growth (Brienen et al. Reference BRIENEN, ZUIDEMA and DURING2006). If significant temporal autocorrelation was found, the data were detrended by rotating data points around the mean (Berryman Reference BERRYMAN1997) using the equation:

Where DDt is the detrended data point at time t, Dt is the observed data point at time t, d is mean of the observed data series, a is the regression intercept and b is regression slope. The radial growth data were then subjected to best subset regression analysis using five independent variables: (1) previous-year tree diameter or tree size (dpyr), (2) current-season total rainfall (r), (3) current-year mean daily maximum temperature (Tmax), (4) current-year mean daily minimum temperature (Tmin) and (5) current-year mean daily average temperature (Tavg). The variables with the highest influence on radial increment were selected on the basis of the value of the coefficient of determination (r2) and used to develop statistical models to describe how independent factors affect incremental radial growth using ordinary linear regression analysis. Because annual growth over the 10 y showed two distinct phases (1997–2003 and 2004–2007), analyses were conducted on each phase separately.
Analysis of variance (ANOVA) was used to determine the significance of differences in shoot die-back among cohort saplings. Data on percentage shoot die-back were first transformed using angular or arcsine-square root transformation to improve normality in data distribution before carrying out ANOVA.
RESULTS
Tree growth
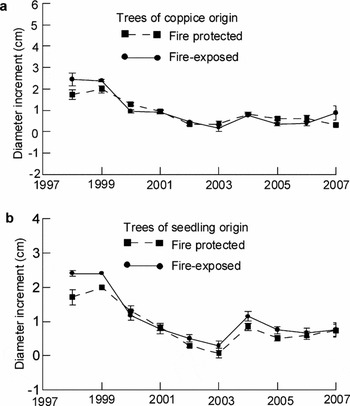
Trees were in a high radial-growth phase when the study began as reflected by annual growth rates in 1998 and 1999; from then on trees entered a phase of declining annual growth until 2003 before going into a phase of low but fluctuating growth until 2007 (Figure 2). The growth time-series data were therefore divided into two distinct sequences. Sequence (phase) 1 of relatively high and declining growth rate from 1998 to 2003 and sequence (phase) 2 of low but fluctuating growth rate from 2004 to 2007.
Tree annual diameter increment at 1.3 m above ground (dbh) of Bauhinia thonningii trees recruited from coppice (a) and seedlings (b) under fire protection (in unburnt blocks) and annual fire exposure (in burnt blocks) at a savanna site in central Zambia. Vertical lines show SE of mean.

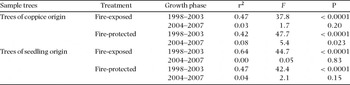
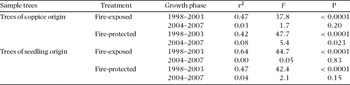
Regression of current-year diameter increment on previous-year increment yielded significant coefficients of determination (r2) for phase 1 (1998–2003) for all the sample trees regardless of source of regeneration and fire treatment but not for phase 2 (2004–2007), except for coppice trees that were protected from fire (Table 3). These results indicate the existence of a significant degree of autocorrelated growth in Bauhinia trees at the study plot during phase 1 and phase 2 for only fire-protected coppice trees. The data with significant autocorrelated growth were first detrended before subjecting them to regression analysis to determine the influence of climate factors and tree size on annual radial growth.
Results of regression analysis of current-year on previous-year diameter increment for determining existence of autocorrelated year-to-year growth in Bauhinia thonningii sample trees at a savanna site in central Zambia.
Under fire protection, climate factors and tree size had no significant influence on annual radial growth of trees of seedling origin in both growth phases. But in similar trees under annual burning, the combined influence of tree size, minimum temperature and average temperature explained 28% of the variance in annual radial growth during phase 1 while maximum temperature alone explained 15% of the variation in annual growth during phase 2 (Table 4).
Statistical models with significant explanatory power of variation in annual diameter increment (dependent variable, y) in Bauhinia thonningii trees during growth phase 1 (1998–2003) and growth phase 2 (2004–2007) at a savanna site in central Zambia. Explanatory variables are previous-year tree diameter or tree size (dpyr), current-season rainfall (r), annual daily minimum temperature (Tmin), annual daily average temperature (Tavg) and annual daily maximum temperature (Tmax). Significance level for r2: *P = 0.05, **P = 0.01, ***P = 0.001, ****P < 0.0001.

Under annual burning, the effect of the three temperature factors and rainfall explained 19% of the variation in annual radial growth of coppice trees during phase 1 while the influence of tree size and minimum temperature explained 14% of the variation in growth (Table 4). Under fire protection, however, the influence of tree size, minimum temperature and average temperature explained 18% of the variation in annual growth during phase 1 while the combined influence of tree size and rainfall during phase 2 explained 35% of the variation in annual growth among coppice trees.
Sapling growth
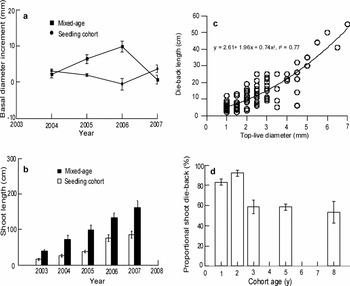
In phase 2 (2004–2007) there was no significant influence of previous-year basal radial increment on current-year increment of saplings in both the 1999 cohort and mixed-age saplings (Figure 3a). The effect of rainfall and maximum temperature explained 33% of the variation in basal radial growth of the 1999 cohort (y = 204 – 0.007r – 6.86Tmax, F = 6.28, P < 0.01) and 47% of the variance in basal radial growth of mixed-age saplings (y = 485 + 0.02r + 16.7Tmax, F = 18.7, P < 0.0001).
Sapling annual basal diameter increment (a) and shoot length growth (b) among mixed-age and 1999 cohort saplings and relationship between top-live diameter and shoot die-back length (c) and age versus shoot die-back proportion (d) among cohort saplings of Bauhinia thonningii at a savanna site in central Zambia. Vertical lines in (a), (b), and (d) represent standard errors of means.

Mixed-age and the 1999 cohort saplings showed a steady annual increase in shoot length from 2003 to 2007 (Figure 3b); this was in spite of cohort saplings experiencing annual shoot die-back. The length of the die-back portion of the shoot appeared to increase with top-live diameter (Figure 3c) and age of the cohort (F = 40.2, P < 0.0001): mean shoot die-back increased from 4.6 ± 1.12 cm in 1-y-old saplings to 32.4 ± 2.05 cm in 8-y-old saplings and these were significantly different at P = 0.05. However, the proportion of the total shoot length that died back decreased with sapling age (Figure 3d). Angular-transformed data indicated that the proportion of shoot die-back in saplings of 1–2 y old was significantly higher at 87.1% ± 2.60% than that of 57.7% ± 2.62% in saplings of over 2 y old (F = 63.6, P < 0.0001). The top-live diameter varied among cohorts: 1.13 ± 0.04 mm at 1 y, 1.7 ± 0.14 mm at 2 y, 2.5 ± 0.19 mm at 3 y, 2.7 ± 0.15 mm and 5.8 ± 0.34 mm at 5 and 8 y, respectively (F = 75.5, P < 0.0001) and the relationship between die-back length and top-live diameter was best described by a polynomial equation as shown in Figure 3c.
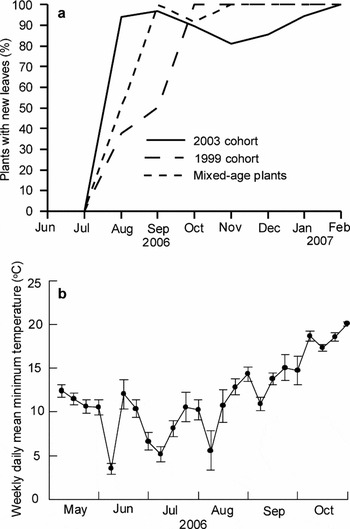
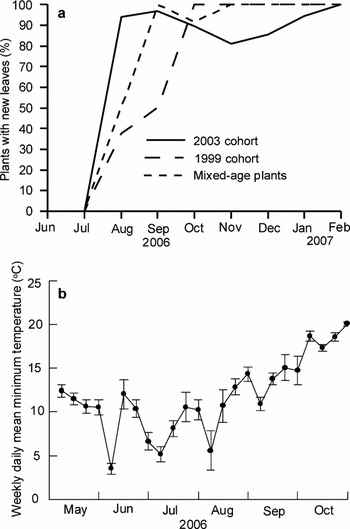
The majority of the saplings experienced shoot die-back during the cool-dry season (May–August) and resprouting occurred thereafter (Figure 4a). Weekly mean daily minimum temperatures during this period repeatedly fell to between 3 and 5 °C with a steady rise after September (Figure 4b). However, a few plants underwent a second phase of shoot die-back during October and November (Figure 4a) and almost all the saplings that died back in the hot-dry season suffered complete shoot die-back (top-kill) and recovered by resprouting from the base.
Resprouting Bauhinia thonningii saplings: per cent of plants with new leaves during 2006/2007 (a). Also changes in weekly daily mean minimum temperature during May to October 2006 (b). Vertical lines in (b) represent SE of mean.
DISCUSSION
Tree growth
That autocorrelation of growth was stronger in trees originating from seedlings compared with those originating from coppice may be due to the fact that the latter are less affected by temporal variations in growth resources due to the presence of large root biomasses carried forward from cut parent trees compared to the former that have smaller root biomasses and are therefore more vulnerable to temporal variations in growth resources and factors.
Temporally autocorrelated growth can mask the effects of climate and other factors on the growth of African savanna trees (this study; Trouet et al. (Reference TROUET, COPPIN and BEECHMAN2006) for Brachystegia spiciformis in western Zambia). The present study also found that autocorrelated growth can become very weak or even disappear during periods of low growth. Further, during a period of high and declining growth, the strength of autocorrelated growth can vary with tree origin type and fire treatment. I suggest that studies of year-to-year autocorrelation in tree growth also note other factors such as fire, seedling versus coppice and overall climate and growth status, since these undoubtedly affect results.
That tree radial growth is positively related to initial tree size also has been reported in Australian tropical savannas (Prior et al. Reference PRIOR, BROOK, WILLIAMS, WERNER, BRADSHAW and BOWMAN2006, Werner Reference WERNER2005, Werner & Prior Reference WERNER and PRIOR2007), dry tropical forests of Puerto Rico (Murphy et al. Reference MURPHY, LUGO, MURPHY, NEPSTAD, Lugo and Lowe1995), and semi-deciduous and moist tropical forests in Panama (Condit et al. Reference CONDIT, HUBBELL and FOSTER1993), Malaysia (King et al. Reference KING, DAVIES and NOOR2006) and Ghana (Swaine et al. Reference SWAINE, HALL and ALEXANDER1987). Elsewhere, however, Prior et al. (Reference PRIOR, EAMUS and BOWMAN2004) did not find such a relationship among saplings of eucalypt species in northern Australia, and Walker et al. (Reference WALKER, STONE, HENDERSON and VERNEDE1986) concluded that radial increments in Burkea africana in southern Africa were independent of size of individual, as did Nath et al. (Reference NATH, DATTARAJA, SURESH, JOSHI and SUKUMAR2006) for most common tree species in a tropical dry deciduous forest in southern India. As demonstrated by the present study, the differences in results may be due to other interacting factors such as fire or origin of the trees themselves.
Both short- and long-term studies in moist deciduous forests and wet evergreen forests have demonstrated a positive relationship between tree growth and rainfall (Baker et al. Reference BAKER, AFFLUM-BAFFOE, BURSLEM and SWAINE2002, Reference BAKER, BURSLEM and SWAINE2003; Breitsprecher & Bethel Reference BREITSPRECHER and BETHEL1990, Daubenmire Reference DAUBENMIRE1972, Pelissier & Pascal Reference PELISSIER and PASCAL2000), generally consistent with the results of the present study. In contrast, Prior et al. (Reference PRIOR, BROOK, WILLIAMS, WERNER, BRADSHAW and BOWMAN2006) found a negative relationship between tree radial growth and yearly average rainfall in a tropical savanna of northern Australia, which they attributed to the negative effect of the growth of competing herbaceous vegetation in high-rainfall years. The results are not necessarily inconsistent, however, due to the fact that fire and regeneration source of the trees can change the relationship between climate and growth rates, as demonstrated in the present study; competing herbaceous vegetation would be one more additional factor to understanding the growth responses of trees.
For coppice trees under annual burning, the interaction of all the four climate factors were important during the high and declining growth phase but only the interaction between tree size and minimum temperature was important during the low-growth phase. It is apparent therefore that fewer factors were involved in defining growth rate of B. thonningii trees at the study site during periods of low growth compared to periods of high and declining growth rate.
Sapling growth
It is often suggested that fire arrests the advancement of sapling height growth in African savannas causing them to remain in a ‘fire-trap’ phase (Higgins et al. Reference HIGGINS, BOND and TROLLOPE2000). Those saplings that do not die outright in a fire suffer fire-induced shoot die-back due to water stress following heat damage of the xylem (Balfour & Midgley Reference BALFOUR and MIDGLEY2006). Seedlings and saplings of miombo woodland canopy species in Zambia suffer such shoot die-back (Chidumayo Reference CHIDUMAYO1991, Trapnell Reference TRAPNELL1959). Shoot die-back in B. thonningii saplings, however, appears to occur during the cool-dry season but this damage is only evident after bud break and resprouting in the hot-dry season. The results suggest that in the absence of fire, water availability and high temperatures are key determinants of radial growth in B. thonningii saplings. Perhaps the development of an extensive root system in trees reduces the effects of rainfall and high temperatures on growth. The fact that the pattern of basal diameter growth differed between the larger mixed-age saplings and the smaller 1999 cohort saplings suggests that age and/or size may be important in determining the response of saplings to climate factors as was observed for trees.
The notion that shoot die-back was induced by low temperatures is supported by observations that chilling injury may take weeks for the full extent of damage to develop (Larcher Reference LARCHER2005) and that most tropical trees are killed at 5 °C (Coder Reference CODER2006).
I suggest that the shoot die-back in B. thonningii saplings during the cool dry season is due to low temperatures that induce xylem embolism although wilting was not observed on the already senescing leaves. The polynomial relationship between shoot die-back length and top-live diameter suggests that thicker shoot size (also linked to sapling age), did not reduce the chances of shoot die-back such that there was no clear threshold of shoot thickness at which death of sapling shoots due to low-temperature-induced die-back can be predicted. This contrasts with top-kill caused by fire and drought stress for which survival increases above a threshold stem thickness (Gignoux et al. Reference GIGNOUX, CLOBERT and MENAUT1997, Hoffmann & Solbrig Reference HOFFMANN and SOLBRIG2003).
The few saplings that died back in the late dry season and transition to the wet season (October and November) were younger saplings of the 2003 cohort; they died in spite of resprouting earlier in the dry season most likely due to water stress induced by an inadequate root system to cope with the excessive demands of evapotranspiration at that time of the year. Obviously climate factors affect both radial growth and shoot mortality in B. thonningii saplings even in the absence of fire, although fire has the capacity to alter the relationship between climate and intrinsic, allometric growth rates.
Implications for savanna responses to climate change
From the results of this study, both cutting (leading to coppicing) and fire alter the way African savanna trees respond to climate factors. How the land is managed does affect the trees ability to respond to climate. Changes in climate, both temperature and precipitation, will undoubtedly interact with fire in ways yet unpredictable, further producing changes in current growth rates of trees and saplings, die-back of stems, and regeneration from top-kill, which will have implications for structural changes in the savanna of central Zambia. Predicting the growth responses of African savanna trees to a warmer climate, however, is complicated by the likely feedback that this will have on herbaceous plant production leading to changes in fuel loads, fire frequency and intensity, shoot die-back in saplings and allocation of photosynthates to respiration and growth in trees. Good information on the growth behaviour of savanna trees and how this is affected by a multitude of factors is therefore necessary before meaningful attempts can be made to address uncertainties about climate change impacts on African savannas.