Introduction
The Clupeiformes are an important pillar for the development of marine economic fisheries. The Clupeiformes are distributed all over the world with nearly 400 marine, freshwater and diadromous species (Bloom et al., Reference Bloom, Fikáček and Short2014). The Clupeiformes have a wide range of habitats, including open oceans, coastal areas, estuaries, freshwater rivers and lakes. Systematic relationships between Clupeiformes have received increasing attention, but higher-level phylogenetic relationships remain to be addressed. In the past, many researchers had classified Clupeiformes using different methods. Previous research divided Clupeiformes into two suborders, Denticipitoidei and Clupeoidei (Bloom & Egan, Reference Bloom and Egan2018). Traditionally, the Clupeoidei was divided into five families: Clupeidae (herrings, shads, sardines), Engraulidae (anchovies), Pristigasteridae (longfin herrings), Chirocentridae (wolf herrings) and Denticipitidae (denticle herrings). However, Nelson et al. (Reference Nelson, Grande and Wilson2016) considered that Clupeoidei should be divided into four families including Engraulidae (two subfamilies), Pristigasteridae (two subfamilies), Chirocentridae (one genus), and Clupeidae (five subfamilies). Meanwhile, earlier morphology based studies hypothesized that the Clupeidae are sisters of the Chirocentridae, while the position of the Engraulidae and Pristigasteridae has not been determined (Grande, Reference Grande1985). So, it is necessary to assess their phylogenetic relationships based on molecular approaches.
To understand the phylogenetic position of the Engraulidae and Pristigasteridae in Clupeiformes, the complete mitogenomes of two target economic species respectively belonging to Engraulidae and Pristigasteridae were used in this study. Ilisha elongata belongs to the Actinopteri, Clupeiformes, Pristigasteridae, which live mainly in the ocean and offshore. Ilisha elongata is not only widely distributed in the Indian Ocean and the western Pacific, but also in China's Bohai Sea, the Yellow Sea, the East China Sea and South China Sea (Whitehead, Reference Whitehead1985; Cheng & Zheng, Reference Cheng and Zheng1987; Blaber et al., Reference Blaber, Staunton, Milton, Fry, Velde, Pang, Wong and Boon1998; Hatooka et al., Reference Hatooka, Yamada, Aizawa, Yamaguchi and Yagishita2013). Ilisha elongata is an important commercial resource in China, which creates huge profits for local fishermen every year (Wang et al., Reference Wang, Zhang, Matsumoto, Kim and Li2016). However, different areas along the coasts of Japan, South Korea and China had reported a decrease in the fishery of long Ilisha (Chen & Zhang, Reference Chen and Zhang1993; Kim et al., Reference Kim, Choi, Kim, Chang and Park2007; Yamada et al., Reference Yamada, Tokimura, Horikawa and Nakabo2007). This decline is reflected not only in total catches but also in smaller catches of adult fish and the absence of elongated elasmobranchs in the Bohai Sea (Chen, Reference Chen1988), a formerly abundant distribution area. Setipinna tenuifilis belongs to the Actinopteri, Clupeiformes, Engraulidae. It is a middle-lower fish in the offshore waters, which inhabits the bottom of mud and sea areas with slow currents (Liu, Reference Liu2002). Setipinna tenuifilis was not only an important fishing target but also an important bait for many large- and medium-sized fish. The production of S. tenuifilis was high in the Bohai sea (Meng et al., Reference Meng, Yong and Jun2004; Yong et al., Reference Yong, Jia and Sheng2004). However, the resources of S. tenuifilis in China have been greatly reduced with the dramatic increase in fishing intensity and fishery output, showing a trend of small size, low age and premature maturity in the population (Li et al., Reference Li, Wu, Shan, Wang and Jin2017). The decline of S. tenuifilis resources will destroy the material and energy cycle network structure of the whole coastal ecosystem. To maintain sustainable fisheries and a normal coastal ecosystem, it is important and useful to know the phylogenetic status of the target species in Clupeiformes and the phylogenetic relationship among Clupeidae, Chirocentridae, Engraulidae and Pristigasteridae in this study.
Vertebrate mitochondrial DNA (mtDNA) is a circular molecule with a length of 16–19 kb, containing 37 genes, encoding 22 transfer RNAs (tRNAs), 13 protein-coding genes (PCGs), two ribosomal RNAs (rRNAs) and a putative control region (CR) (Boore, Reference Boore1999; Miya et al., Reference Miya, Kawaguchi and Nishida2001; Yang et al., Reference Yang, Wu, Yan, Su and Yang2010). In animals, the mitochondrial CR is the only non-coding sequence in the mitochondrial genome, which is called the D-loop region in vertebrates and the A + T enrichment region in invertebrates (Fauron & Wolstenholme, Reference Fauron and Wolstenholme1976; Zhang et al., Reference Zhang, Ding, Wang, Tang and Sun2011). The mitochondrial genome of fish has the same organization as other vertebrates (Kartavtsev et al., Reference Kartavtsev, Jung, Lee, Byeon and Lee2007). The mitogenome has become a useful tool for studying phylogeny, molecular evolution and even conservation genetics due to its relatively simple genetic structure, maternal inheritance (in most cases) and high evolution rate (Saitoh et al., Reference Saitoh, Miya, Inoue, Ishiguro and Nishida2003; Kim et al., Reference Kim, Kweon, Kim, Kim, Gye, Lee, Lee and Lee2004; Lakra et al., Reference Lakra, Goswami and Gopalakrishnan2009; Habib et al., Reference Habib, Lakra, Mohindra, Khare, Barman, Singh, Lal, Punia and Khan2011). To date, many meaningful achievements have been made in phylogenetic analysis and fish classification through the study of the mitochondrion (Jia et al., Reference Jia, Zhang, Xu, Yang and Gao2020). However, short mitochondrial gene fragments have limitations in discussing and resolving more complex phylogenetic relationships in many fish lineages. The complete mitochondrial genome applied in this study may help to validate the accuracy of the traditional taxonomy of Clupeiformes.
In the present study, two complete mitochondrial genomes of I. elongata and S. tenuifilis were sequenced, annotated and compared with each other. The characteristics were described to evaluate the variation and conservation in the mitochondrial genome among I. elongata and S. tenuifilis. Relative synonymous codon usage (RSCU) and AT-skew values of protein-coding genes (PCGs) were analysed to better infer the functions of related genes. Moreover, we assembled the mitochondrial genome of I. elongata and S. tenuifilis and reconstructed the phylogenetic relationship of Clupeiformes based on 13 PCGs. The mitochondrial genomic information reported in this study can help to complement and enhance the existing molecular data and provide the necessary basis for the classification of Clupeiformes.
Materials and methods
Sample collection permit and experimental approval
All procedures in this study were performed under the guidelines of the Regulations for the Administration of Laboratory Animals (Decree No. 2 of the State Science and Technology Commission of the People's Republic of China, 14 November 1988), and were approved by the Animal Ethics Committee of Zhejiang Ocean University (Zhoushan, China). The adult I. elongata and S. tenuifilis were obtained from an aquaculture farm in Zhoushan (122.20°E 30.00°N), Zhejiang province, China. The adult I. elongata and S. tenuifilis were quickly transported to the laboratory at Zhejiang Ocean University (Zhoushan, China) and then were anaesthetized using tricaine methane sulphonate (100 mg l−1) to death.
DNA extraction and primer design
The collected samples were sent to the laboratory for 95% alcohol treatment and then stored at −4°C for further DNA extraction. The total DNA was extracted by using the SQ tissue DNA Kit (OMEGA) according to the manufacturer's protocol. Then the extracted DNA was prepared for the next polymerase chain reaction (PCR). The primers used in this experiment were designed based upon the mitochondrial genome sequence of I. striatula (GenBank no. MK391600.1) (Table S1) and S. taty (GenBank no. KC439458.1) (Table S2) by Primer Premier 6.0 (Singh et al., Reference Singh, Mangalam, Dwivedi and Naik1998).
PCR amplification and sequencing
The PCR was performed in a reaction volume of 25 μl, which contained 2.0 μl dNTP mixture (2.5 mmol l−1 for each), 1 μl each primer (10 μmol l−1), 2.0 μl magnesium chloride (2.5 mmol l−1), 0.5 μl Taq polymerase (5.0 U) (Takara, China), 2.5 μl 10× Taq buffer, and ~1 μl DNA template, and finally 25 μl were made up with sterile water. Using the following cycling conditions: (1) Denaturation step for 5 min at 95°C; (2) 35 cycles of denaturation at 95°C for the 30 s, annealing at 52°C (as the case may be) for 30 s, and extension at 72°C for 30 s; and (3) a final extension of 5 min at 72°C. The sequence was sequenced using the ABI 3730 automatic DNA analyzer supported by Sangon Biotech (Shanghai, China).
Assembly, annotation and comparative analysis
The sequence of the obtained fragment was assembled into a complete mitochondrial genome using the software CodonCode Aligner 5.1.5 (Lu et al., Reference Lu, Gong, Zhang, Chen, Liu, Jiang, Lü, Liu, Tong and Wei2020). Then, the complete mitochondrial genome sequence was obtained and annotated by Sequin version 15.10 (http://www.ncbi.nlm.nih.gov/Sequin). Protein coding genes were identified using ORF Finder, implemented on the NCBI (https://www.ncbi.nlm.nih.gov/). The 13 PCGs were used to blast with the homologous sequence to identify if the species were I. elongata and S. tenuifilis (Supplementary files 1 and 2). The tRNA genes were determined by the tRNAscan-SE search server with vertebrate mitochondrial codons and the default search mode (Lowe & Eddy, Reference Lowe and Eddy1997). The control region and rRNA genes were determined by the boundaries of the tRNA gene and compared with other Clupeiformes mitochondrial genomes (Lavoué et al., Reference Lavoué, Miya and Nishida2010; Sébastien et al., Reference Sébastien, Bertrand, Chen, Ho, Motomura, Sado and Miya2017). Prediction of the secondary tRNA structure was done through the MITOS web server (http://mitos2.bioinf.uni-leipzig.de/index.py) (Bernt et al., Reference Bernt, Donath, Jühling, Externbrink, Florentz, Fritzsch, Pütz, Middendorf and Stadler2013). The mitochondrial map was drawn using the online visualization tool OGDraw (https://chlorobox.mpimp-golm.mpg.de/OGDraw.html) (Greiner et al., Reference Greiner, Lehwark and Bock2019). The RSCU and base composition were calculated by MEGA 7.0 (Sudhir et al., Reference Sudhir, Glen and Koichiro2016). To understand the base composition deviation of the mitochondrial genome when AT biased and GC biased, the following formulae were used to estimate: when biased AT = (A − T)/(A + T) and when biased GC = (G − C)/(G + C) (Perna & Kocher, Reference Perna and Kocher1995). The ratio of non-synonymous substitutions (Ka) to synonymous (Ks) substitutions was estimated at DnaSP6.0 (Rozas & Rozas, Reference Rozas and Rozas1995).
Phylogenetic analysis
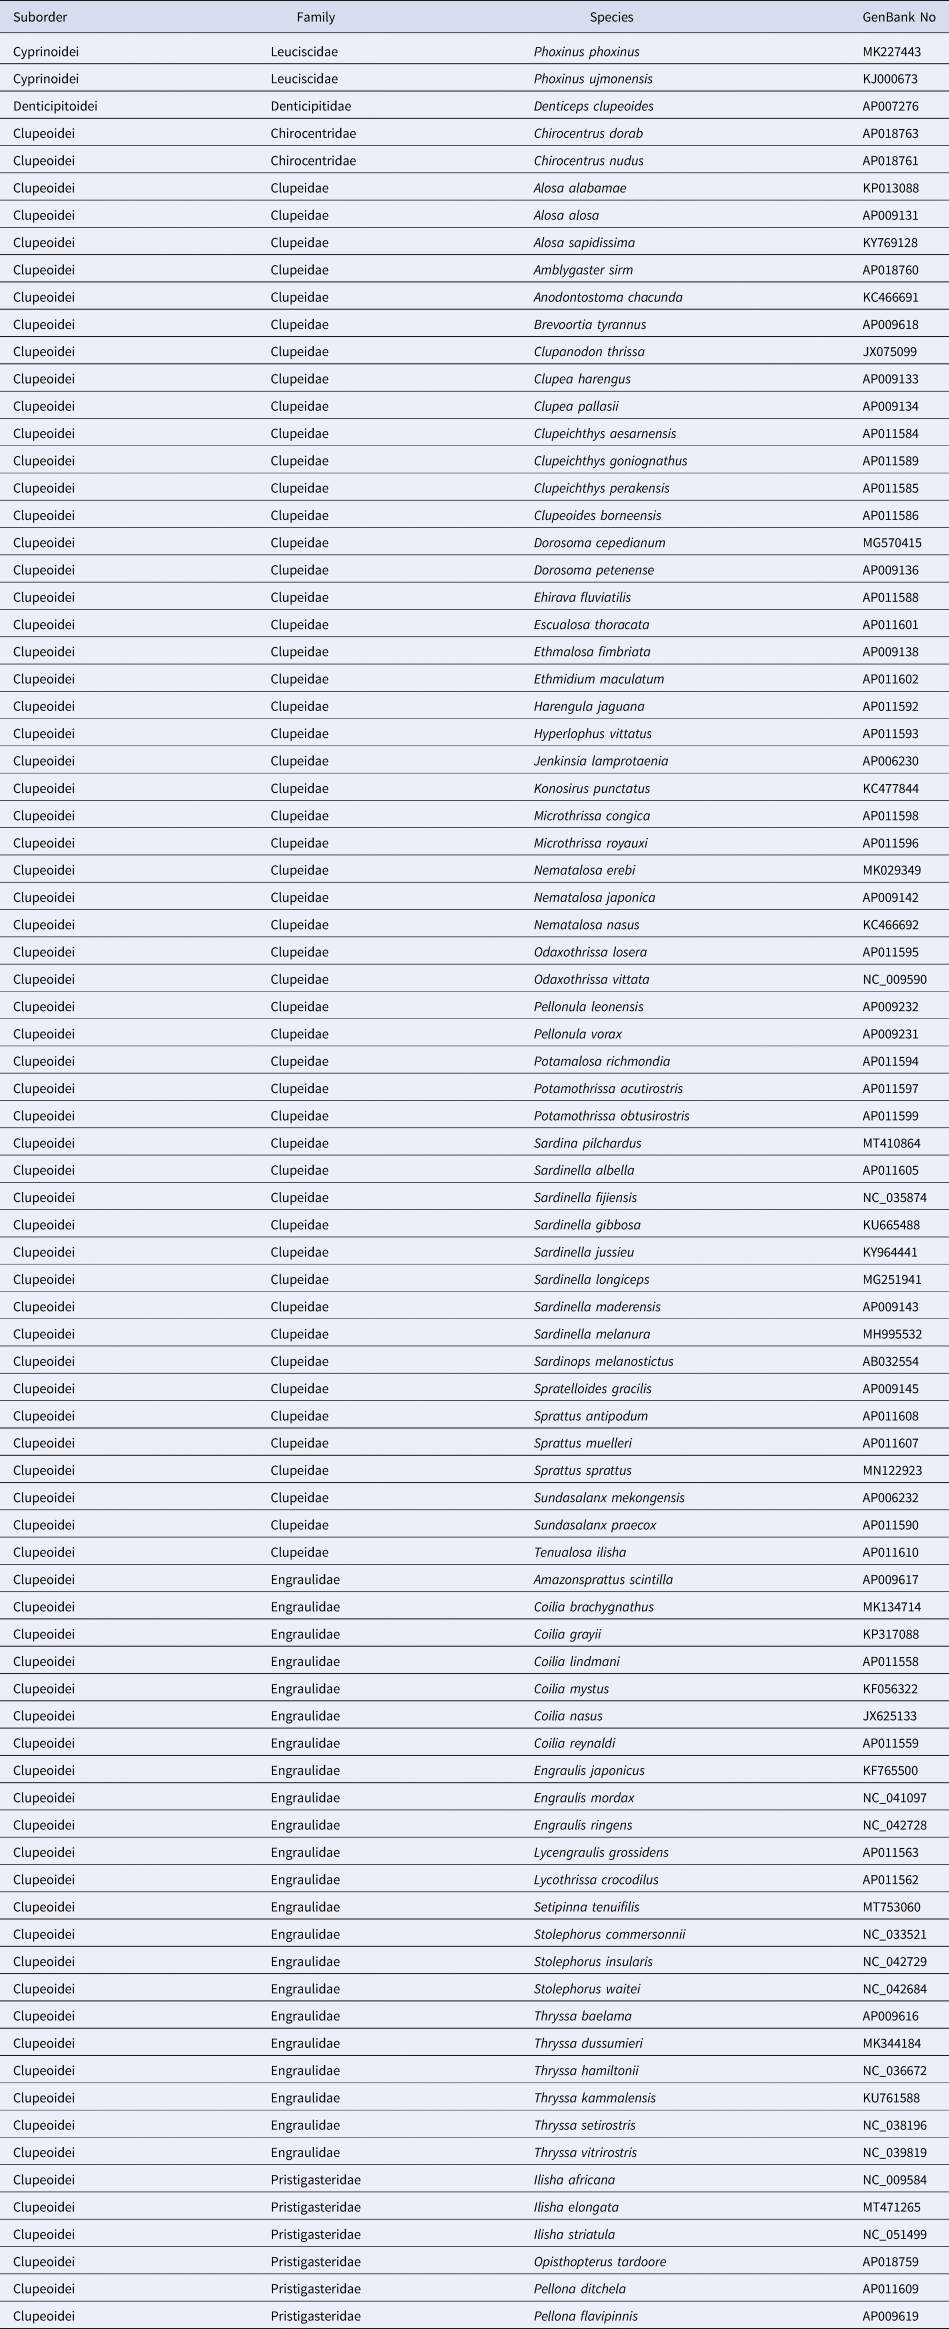
For phylogenetic analysis, 84 mitochondrial genomes were downloaded from the GenBank database (https://www.ncbi.nlm.nih.gov/genbank) to reconstruct the phylogenetic relationship of Clupeiformes, and two species were added for an outgroup (Table 1). The 13 PCGs sequences screened using DAMBE were used to construct a phylogenetic tree (Xia, Reference Xia2018). The filtered sequence was then aligned with the default parameters using Clustal X version 2.0 (Larkin et al., Reference Larkin, Blackshields, Brown, Chenna, McGettigan, McWilliam, Valentin, Wallace, Wilm, Lopez, Thompson, Gibson and Higgins2007) and manually checked using BioEdit (Hall, Reference Hall1999). The ambiguous sequence was eliminated by using Gblock (Talavera & Castresana, Reference Talavera and Castresana2007). The nucleotide sequences of the 13 PCGs were used as the dataset to construct the phylogenetic tree using Bayesian inference (BI) and maximum likelihood (ML) methods. By using MEGA and SequenceMatrix software, the Fasta sequence was converted into the nex and phylip format sequences of BI and ML methods. According to the Akaike Information Standard (AIC), the most suitable nucleotide sequence model was selected by MrModeltest 2.3 (Yamaoka et al., Reference Yamaoka, Nakagawa and Uno1978), and the most suitable model was GTR + I + G. BI phylogenetic trees were constructed by MrBayes 3.2 (Huelsenbeck, Reference Huelsenbeck2012) based on 10,000,000 generations and ML analysis was inferred by PhyML 3.0 (Montagna et al., Reference Montagna, Chouaia, Sacchi, Porretta, Martin, Giorgi, Lozzia and Epis2014) with 1000 replicates of bootstrap. In addition, nucleotide sequences of 13 PCGs were converted to amino acid sequences using MEGA and used to construct BI tree and ML tree as well. The most suitable model for ML method was mtREV24 + G + I + F and the same generation and replicates of bootstrap was applied with the methods based on nucleotide sequences. Finally, the results of the phylogenetic trees were shown in ITOL (www.itol.embl.de).
List of 82 Clupeiformes and two outgroups used in this paper

Results and discussion
Mitogenome structure
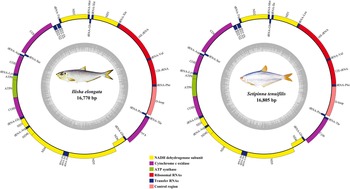
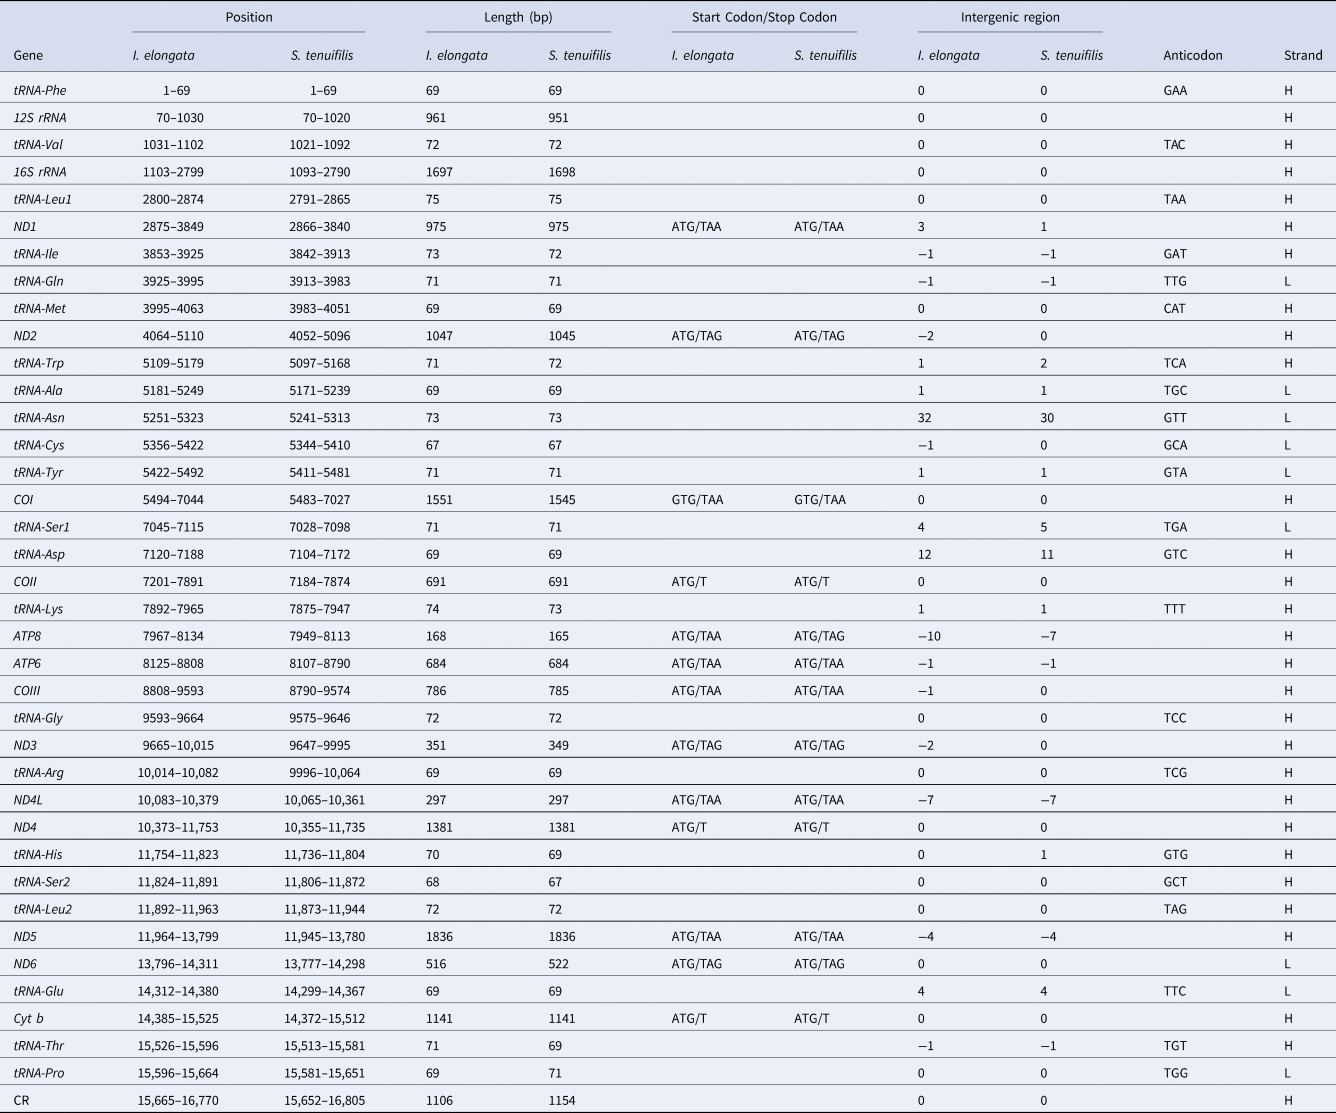
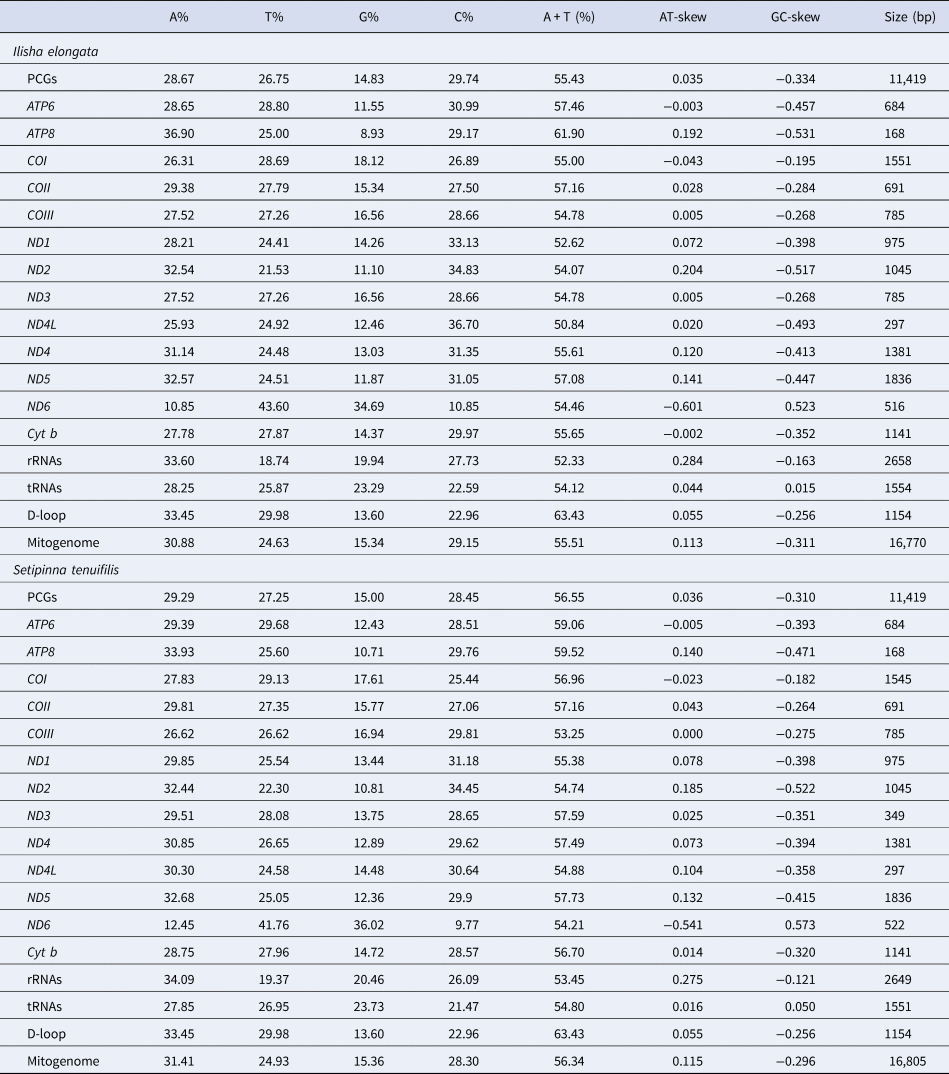
The lengths of the complete mitochondrial genomes of I. elongata and S. tenuifilis were 16,770 and 16,805 bp, respectively (GenBank under accession numbers MT471265 and MT753060). Both fishes contained a common set of 37 mitochondrial genes, including two rRNA genes (16S rRNA and 12S rRNA), 13 PCGs, 22 tRNA genes and a putative control region (Figure 1, Table 2). The majority of 37 genes were encoded on the heavy strand, except one PCG (ND6), eight tRNAs (tRNA- Gln, Ala, Asn, Cys, Tyr, Ser, Glu and Pro) which were encoded on the light strand (Table 2). The structures of the two mitochondrial genomes were the same. Under the basic composition, the A + T content of the mitochondrial genome of I. elongata and S. tenuifilis were 55.51 and 56.34%, respectively. The total base composition of S. tenuifilis mitochondria was A (31.41%), T (24.93%), G (15.36%) and C (28.30%), and the total base composition of I. elongata was A (30.88%), T (24.63%), G (15.34%) and C (29.15%). Both two mitochondrial genome sequences had a positive AT skew and a negative GC skew (Table 3). So, the percentage of the nucleotide composition of the mitochondrial genome of the two fishes was: A > C > T > G. As in other vertebrate mtDNAs, there were overlap areas and non-coding bases between genes (Inoue et al., Reference Inoue, Miya, Tsukamoto and Nishida2000). The minimum overlap between the mitochondrial genes of the two fish was 7 and 10 bp, and the maximum non-coding region between the genes was 30 and 32 bp, respectively (Table 2).
Mitochondrial genome map of Ilisha elongata and Setipinna tenuifilis.

Annotations for the Ilisha elongata and Setipinna tenuifilis mitogenomes

Nucleotide composition of Ilisha elongata and Setipinna tenuifilis mitogenomes

Protein coding genes and codon usage
The 13 PCGs of I. elongata and S. tenuifilis were both 11,419bp in length. Among them, 13 PCGs include seven NADH dehydrogenases (ND1 ~ ND6 and ND4L), three cytochrome c oxidases (COI ~ COIII), two ATPases (ATP6 and ATP8), and a cytochrome b (Cyt b), which was also common in other Clupeiformes (Lavoué et al., Reference Lavoué, Miya, Inoue, Saitoh and Nishida2005, Reference Lavoué, Miya, Musikasinthorn, Chen and Nishida2013). The initiation codon of all the 13 PCGs was ATG, except for GTG of COI (Table 2). Among the 13 PCGs, the stop codons of ND1, COI, ATP6, ATP8, ND4L and ND5 were ATT, and the incomplete stop codons were T. This incomplete stop codon was commonly found in other animal mitogenomes (Peng et al., Reference Peng, Wang and He2006). Several studies had demonstrated that incomplete termination codons can act as complete functional termination codons during polyadenylation and multinuclear transcriptional cleavage (Ojala et al., Reference Ojala, Montoya and Attardi1981; Liu et al., Reference Liu, Song, Yanagimoto, Han, Shui and Gao2017; Zhang et al., Reference Zhang, Cai, Yu, Storey and Zhang2018). The length of 13 PCGs ranges from 168 bp (ATP8) to 1,836 bp (ND5, Tables 2 and 3). Like other vertebrates, there are four pairs of coding genes adjacent to each other, located at ATP8-ATP6, ATP6-COIII, ND4L-ND4 and ND5-ND6 (Wei et al., Reference Wei, Shi, Chen, Sharkey, van Achterberg, Ye and He2010). The 13 PCGs of I. elongata and S. tenuifilis showed a positive AT skew and negative GC skew, which suggests that the nucleotides As and Cs have higher occurrence than their respective counterparts (Table 3).
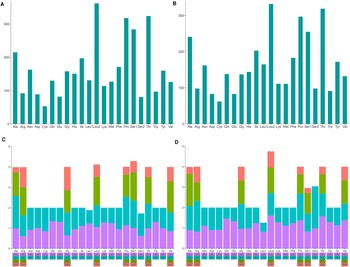
Following the codon degeneration pattern, the amino acids serine and leucine are encoded by six synonymous codons, and the remaining amino acids are encoded by four or two codons. The most used amino acids are leucine, serine and threonine, while the least commonly used amino acids are glutamic acid and cysteine (Figure 2A, C). The abundance of codon families and RSCU in the PCGs were investigated for all available I. elongata and S. tenuifilis mtDNA sequences; the results are shown in Figure 2B, D. The comparative analysis based on RSCU shows that the codon usage patterns of these two species are conservative and similar. So, codon usage frequency and RSCU were completely different metrics for evaluating mitochondrial gene codon usage (Comeron & Aguadé, Reference Comeron and Aguadé1998; Orešič & Shalloway, Reference Orešič and Shalloway1998). The codon distribution and amino acid content were consistent between species only if they have similar codon usage preferences.
The amino acid composition and RSCU in two mitogenomes. (A) Amino acid composition of Ilisha elongata mitogenomes. (B) The RSCU in Ilisha elongata mitogenomes. (C) Amino acid composition of Setipinna tenuifilis mitogenomes. (D) The RSCU in Setipinna tenuifilis mitogenomes. The x-axis of (A) and (C) plots represent the amino acid composition of the 13 protein-coding genes in the mitochondria of Ilisha elongata and Setipinna tenuifilis, respectively. The codon families are shown on the x-axis, and the RSCU values are shown on the y-axis in (B) and (D) plots.

Transfer RNA and ribosomal RNA genes
Like the mitochondrial genes of most fishes (Pavan et al., Reference Pavan, Raman, Koringa, Patel, Shah, Singh, Krishna, Joshi, Gireesh and Chaudhari2016; Lu et al., Reference Lu, Gong, Zhang, Chen, Liu, Jiang, Lü, Liu, Tong and Wei2020), the mitochondrial genes of I. elongata and S. tenuifilis both contain 22 tRNAs (Figures S1 & S2). The secondary cloverleaf structure of 22 tRNAs was predicted in two species, we found that the dihydroxyuridine (DHU) arm of the tRNA-SerGCT gene in the I. elongata and S. tenuifilis mitogenomes lacked any secondary structure, which was consistent with other Clupeiformes and vertebrate mitogenomes (Sun et al., Reference Sun, Zhang, Zeng, Liu, Huang, Zhang and Zhang2022; Zhang et al., Reference Zhang, Zhang, Peng, Zhou, Liu and Liu2022) (Figures S1 & S2). The total length of 22 tRNAs in the mitochondria of I. elongata and S. tenuifilis is 1554 and 1551 bp, respectively, and the overall A + T content of tRNA genes was 54.12 and 54.80%, respectively (Table 3). Both AT skew (0.016 and 0.044, respectively) and GC skew (0.050 and 0.015, respectively) values in the mitochondrial tRNA genes of I. elongata and S. tenuifilis were positive (Table 3). Like the mitochondrial genes of other fishes, there are two types of ribosomal RNA (12S and 16S) from I. elongata and S. tenuifilis. The total lengths of the 12S rRNA and 16S rRNA genes were similar in the two species. The total lengths of the 12S rRNA genes of I. elongata and S. tenuifilis were 961 and 951 bp, respectively. The total lengths of the 16S rRNA genes of I. elongata and S. tenuifilis were 1697 and 1698 bp, respectively. These two subunits are sandwiched by tRNA-Phe and tRNA-Leu, and tRNA-Val is located between the two rRNA subunits like other vertebrates (Broughton et al., Reference Broughton, Milam and Roe2001) (Table 2).
Non-synonymous and synonymous substitutions
The value of Ka/Ks is a common indicator to assess selective pressure and evolutionary relationships of species in molecular studies (Nekrutenko et al., Reference Nekrutenko, Makova and Li2002). Ka/Ks < 1, Ka/Ks = 1 and Ka/Ks > 1 represent purifying selection, neutral mutation and positive selection, respectively (Yang & Bielawski, Reference Yang and Bielawski2000). The Ka/Ks rates of 13 PCGs genes were under purifying selection with Ka/Ks values below 1 (Figure 3). This phenomenon has also been found in mitochondrial protein-coding genes of other fish (Jia et al., Reference Jia, Zhang, Xu, Yang and Gao2020). This result differed from deep-sea fish, where positive selection or convergent/parallel signals were present in all 13 PCGs except ND4L and ND5 genes (Shen et al., Reference Shen, Pu, Chen, Murphy and Shen2019). One of the important reasons may be that they live in different environments. The deep-sea has extremely harsh conditions, including high hydrostatic pressure, complete darkness, low temperatures with limited food and oxygen (Shen et al., Reference Shen, Pu, Chen, Murphy and Shen2019). However, I. elongata and S. tenuifilis live in relatively comfortable environments. Positive selection was usually associated with adaptation to new environments and the development of new functions, and most non-synonymous mutations were unfavorable (Yang, Reference Yang1998; Nielsen, Reference Nielsen2005). The Ka/Ks values in I. elongata and S. tenuifilis showed that they were under purifying selection which may be caused by environment variables.
The rates of non-synonymous substitutions and synonymous substitutions for each PCG in the pairwise mitochondrial genome of Ilisha elongata (IE) and Setipinna tenuifilis (ST). The red boxes mark the genes with the lowest Ka/Ks among the 13 PCGs. The colour change from blue to red shows the change of Ka, Ks, Ka/Ks values from small to large.

The highest Ka/Ks among the 13 PCGs of I. elongata and S. tenuifilis were ND6 (0.324) and ATP8 (0.275), while COIII (0.023) and COI (0.018) genes were the lowest (Figure 3, marked in red box). COI was more conserved than other genes, suggesting that it may be more advantageous in the identification of species.
Phylogenetic analysis
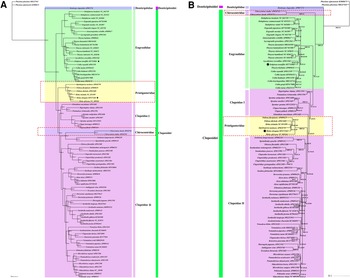
Phylogenetic relationships were reconstructed based on the nucleotide sequences of 13 PCGs of 84 mitogenomes using BI and ML methods. The phylogenetic trees constructed by the two methods had high intermediate bootstrap values and post probabilities, and the topological structure of the phylogenetic trees was essentially the same (Figure 4A). Meanwhile, the BI and ML tree were also constructed based on the amino acid sequences obtained from 13 PCGs (Figure 4B). The results of phylogenetic analyses based on nucleotide sequences indicated that I. elongata, I. africana and I. sirishai formed a sister group with high BI posterior probabilities value (PP = 1.0) and moderate ML bootstrap value (BP = 93) (Figure 4A). This result was similar to the study of Lavoué et al. (Reference Lavoué, Miya, Saitoh, Ishiguro and Nishida2007). While I. sirishai, Opisthopterus tardoore and I. elongata formed a sister group based on amino acid sequences with low BP = 69.1 and PP = 0.69 (Figure 4B), indicating the unreliable phylogenetic status of I. elongata (Wiesemüller & Rothe, Reference Wiesemüller and Rothe2006). The low support rate may confirm that the phylogenetic tree constructed with amino acid sequences is not a suitable method for determining the phylogenetic status of I. elongata. In parallel, based on nucleotide sequences, Pellona ditchela and P. flavipinis were divided into two branches and formed sister relationships with I. sirishai, I. elongata and I. africana with high support values (BP = 100, PP = 1.0) (Figure 4A). Furthermore, the phylogenetic analyses based on nucleotide sequences indicated that S. tenuifilis and Lycothrissa crocodilus formed a sister group with high BP = 100 and PP = 1.0 as did the phylogenetic tree constructed based on amino acid sequences (BP = 99.9, PP = 1.0). Lavoué et al. (Reference Lavoué, Miya and Nishida2010) determined that S. melanochir and L. crocodilus formed a sister group, indicating a close relationship between Setipinna fishes and Lycothrissa fishes, which was consistent with the results in this study (Figure 4A, B).
(A) The phylogenetic tree inferred from the nucleotide sequences of 13 mitogenome protein-coding genes using the maximum likelihood (ML) and Bayesian inference (BI) methods. Numbers on branches indicate bootstrap (ML) and posterior probability (BI). Star symbols indicate species in the study. (B) The phylogenetic tree inferred from the amino acids sequences obtained from 13 mitogenome protein-coding genes using the maximum likelihood (ML) and Bayesian inference (BI) methods. Numbers on branches indicate bootstrap (ML) and posterior probability (BI). Black dots indicate species in the study. The red box shows where the topology of the two methods of tree building differs significantly.

Based on nucleotide sequences, each family in Clupeoidei formed a clade, except for the family Chirocentridae which is deeply nested within Clupeidae (Figure 4A) while Chirocentridae form a sister group with other families in Clupeoidei based on amino acid sequences (Figure 4B). Chirocentrus dorab, C. nudus (Chirocentridae), Jenkinsia lamprotaenia and Spratelloides gracilis have formed sister branches together with high support value in a study conducted by Sébastien et al. (Reference Sébastien, Bertrand, Chen, Ho, Motomura, Sado and Miya2017), which was consistent with the phylogenetic relationships based on nucleotide sequences (Figure 4A). The data used to construct the phylogenetic tree in this study are four families in Clupeoidei. In our study, Clupeidae was divided into two groups (Clupeidae I and II) in both Figure 4A, B, which may be due to the existence of Chirocentridae (Figure 4A) or Pristigasteridae (Figure 4B). Previous morphological studies based on species have suggested that Pristigasteridae should not be included in the Clupeidae (Nelson, Reference Nelson1970), which was contrary to the phylogenetic tree constructed on amino acid sequences (Figure 4B). Meanwhile, the Pristigasteridae is nested within Clupeidae with low bootstrap values (PP = 16.7, BP = 0.53). The reason for the unstable phylogenetic status of Pristigasteridae may be that there are too few species in this family to form stable phylogenetic relationships based on amino acid sequences. However, in our phylogenetic study based on nucleotide sequences, it was found that Pristigasteridae is most closely related to Clupeidae and Chirocentridae but not included in Clupeidae, which is consistent with Nelson (Reference Nelson1970). Furthermore, to explore the division of Clupeoidei into two branch lineages by Chirocentridae, we removed the species from Chirocentridae and reconstructed two phylogenetic trees based on nucleotide sequences. Whatever Chirocentridae exist or not, we found that phylogenetic status of Pristigasteridae was unchanged compared with Figure 4A (Figure S3). Meanwhile, after the removal of Chirocentridae, the Clupeidae fishes clustered together. The position of the Chirocentridae may be caused by long-branch attraction. Some molecular studies have highlighted the differences between the molecular tree and the morphological tree in certain areas of the tree (Mongiardino Koch et al., Reference Mongiardino Koch, Coppard, Lessios, Briggs, Mooi and Rouse2018). Therefore, the phylogenetic relationships of species should not only rely on molecular methods but also need to be studied in conjunction with species morphology. In addition, more mitochondria of Chirocentridae and Pristigasteridae species should be developed for determining their taxonomic status in the Clupeoidei.
Conclusion
Complete mitochondrial genome information is useful for a wide variety of phylogenetic and genetic analyses. At present, due to the great progress in genetic research, many people believe that the richness of individual molecular information was better than morphological data, and molecular analysis has become the most useful method in the study of biological phylogeny. In this research, the mitochondrial genomes of I. elongata and S. tenuifilis were studied using conventional PCR. The length of the mitochondrial genomes of I. elongata and S. tenuifilis are 16,770 and 16,805 bp, respectively, and contains 37 genes and an AT-rich region, which is also common in other vertebrate mitochondrial genomes. The ratio of Ka and Ks indicated that two species were suffering a purifying selection, while the ND6 and ATP8 showed the highest Ka/Ks values. The phylogenetic tree constructed with two methods based on nucleotide sequences showed roughly the same results and indicated that I. elongata had a close relationship with I. africana. Both phylogenetic results based on nucleotide sequences and amino acid sequences showed that S. tenuifilis and L. crocodilus formed a sister branch. The data presented in this study provide the basis for the molecular identification of Clupeoidei species and phylogenetic studies. Of course, the use of mitochondrial genes for resolving the phylogenetic status of species is currently far from sufficient with newer sequencing technologies and increased speed. We can explore the phylogenetic relationships as well as evolutionary relationships of species more accurately and specifically by sequencing the whole genomes of species.
Supplementary material
The supplementary material for this article can be found at https://doi.org/10.1017/S0025315422000728.
Data
The data that support the findings of this study are openly available in ‘NCBI’ at https://www.ncbi.nlm.nih.gov/, reference number MT471265 (Ilisha elongata) and MT753060 (Setipinna tenuifilis).
Author contributions
B.J.L., Y.P., K.Z., Y.F.L. and L.Q.L. conceived and designed the research. B.J.L., Y.P., K.Z., Y.F.L., J.S.L., J.C., X.P.L., X.J., S.Z., Y.P.W., S.F.Z., L.G., Z.M.L. and L.Q.L. conducted experiments, analyzed data and wrote the manuscript. The authors critically reviewed and approved the manuscript.
Financial support
The study was supported by the Science and Technology Project of Zhoushan (2020C21016); Zhejiang Provincial Natural Science Foundation of China (LY22D060001&LY20C190008); National Natural Science Foundation of China (NSFC) (NO. 41806156); Fund of Guangdong Provincial Key Laboratory of Fishery Ecology and Environment (FEEL-2021-8).
Conflict of interest
The authors do not have any conflicts of interest to declare.
Ethical standards
All international, national and institutional guidelines for the care and use of animals were followed.