

1. Introduction
There has been a revival of interest on the role of the state in economic development, both in the economics and political science literature. At the intersection between political economy and development economics, the analysis of state capacity, defined as the institutional capability of the state to carry out various policies that deliver benefits and services to households and firms, has emerged as the cutting edge of research on the relationship between governance, institutions and long-term economic development.
Up to this point, the literature has been concerned mainly with the causal effect of state capacity on economic development (e.g. Dincecco Reference Dincecco2017; Dincecco and Katz Reference Dincecco and Katz2016; Johnson and Koyama Reference Johnson and Koyama2017). However, based on the interdisciplinary work on the historical origins of states, it has also highlighted that building fiscally capable states is at the heart of state formation and performance in providing public goods (e.g. Centeno et al. Reference Centeno, Kohli, Yashar, Centeno, Kohli and Yashar2017; Charron et al. Reference Charron, Dahlström and Lapuente2012; Grabowski Reference Grabowski2008; Kohli Reference Kohli2009; Osafo-Kwaako and Robinson Reference Osafo-Kwaako and Robinson2013).
Strengthening fiscal capacity is strategically important to economic development for two reasons. First, greater fiscal capacity implies, in most cases, greater access of the state to resources that are needed for public goods provision. Developing countries are only able to raise a small share of taxes over GDP relative to advanced market economies (Besley and Persson Reference Besley and Persson2014), whereas they would need higher revenues in order to invest in a number of economic and social areas that are crucial for their growth.Footnote 1 Second, greater fiscal capacity is usually associated with the creation of a large civilian bureaucracy that can itself become a distinct and powerful societal force, and provide an enabling environment for more capable states, with greater territorial reach (Brautigam et al. Reference Brautigam, Fjeldstad and Moore2008).Footnote 2
However, despite the importance of understanding the determinants of fiscal capacity, especially in the developing world, the existing evidence on the determinants of fiscal capacity is fairly limited and based mainly on conditional correlations (see Savoia and Sen Reference Savoia and Sen2015). In this paper, we make two contributions to this literature. First, we provide an econometric analysis that examines the role of checks and balances on executive power for the development of taxation systems in developing economies. We focus on the political economy of fiscal capacity, looking at the role of political institutions that provide a system of checks and balances on the executive power.Footnote 3 While the literature acknowledges that historical and geographical determinants may well explain cross-sectional differences in fiscal capacity, they have weak policy implications (Savoia and Sen Reference Savoia and Sen2015). Compared to history or geography, political economy explanations appear a more promising avenue to understand reforms or the inertia of fiscal systems in developing economies.
The second contribution we make to the literature is that we ‘unpack’ the concept of fiscal capacity, distinguishing between two aspects of taxation power: the accountability and transparency of fiscal institutions (impartiality) and their effectiveness in extracting revenues. Drawing from the institutional economics and political science literature, we posit that political systems that place strong constraints on the executive would be more likely to lead to taxation systems that have a higher degree of impartiality. In such political systems, non-state actors are able to demand greater accountability on the part of the state with respect to the taxes they pay (Moore Reference Moore2007). Greater constraints on the executive are expected to have a positive effect on the impartiality of the taxation system. In contrast, rational political elites, in both authoritarian regimes with limited constraints on the executive and democratic regimes with stronger constraints on the executive, are likely to invest in the effectiveness of the tax system in order to mobilise greater revenues, either for their own benefit or for greater public goods provision. Therefore, we would not expect any clear relationship between greater constraints on the executive and the effectiveness of the tax system.
To test the above hypotheses, we use a recently created set of indicators provided by PEFA (2006), the Public Expenditure and Financial Accountability project. In particular, these indicators allow us to unpack fiscal capacity and evaluate its two core dimensions – the effectiveness and impartiality of the taxation system. Because political economy factors often evolve endogenously with fiscal capacity itself, so making it hard to disentangle spurious correlation and causal effects, we resort to historical settlers’ mortality as an instrument to identify the effect of political institutions (as proposed in Acemoglu et al. Reference Acemoglu, Johnson and Robinson2001; Acemoglu et al. Reference Acemoglu, Johnson, Robinson and Thaicharoen2003). Using cross-national data for 47 developing countries and a variety of estimation methods to address the possible endogeneity of political institutions, we find the existence of constraints on the executive (our measure for a limited government) increases the impartiality in the tax system, whereas this variable is often insignificant in explaining the effectiveness of the tax system. We also provide evidence, based on a broader sample of former European colonies, on the effect of political institutions on tax effort, finding that the impact of constraints on the executive on both total tax revenues and income tax is economically relevant.
The paper is organised as follows. Section 2 discusses our measures of fiscal capacity, and explains how we will capture its impartiality and effectiveness dimensions. Section 3 provides the conceptual framework on the relationship between political institutions and fiscal capacity. Section 4 presents the empirical strategy, and section 5 the results of our empirical analysis. Section 6 concludes.
2. Fiscal capacity and its measurement
Fiscal capacity is defined as the capability of a fiscal system to raise tax revenues from a broad tax base (Besley and Persson Reference Besley and Persson2011). This concept has often been proxied in a cross-section of countries as the tax-to-GDP ratio or similar tax effort indicators. Slightly more refined measures are income taxes and nontrade taxes expressed as shares of total taxes, the income tax bias (the difference between income and trade taxes) and the formal sector share, which is inversely related with the ability of the government to raise taxes. These alternatives are based on the observation that income is more difficult to tax than goods, and therefore it requires a more structured administration.
Tax-to-GDP is readily available for many countries, hence its popularity. However, it also poses a number of problems. First, it strongly depends on the political preferences of a polity towards the size of the public sector, and the scope of redistribution, especially if we compare similar countries (Hanson and Sigman Reference Hanson and Sigman2013; Lieberman Reference Lieberman2002, Martin and Prasad Reference Martin and Prasad2014).Footnote 4 Second, consider two countries with the same tax-to-GDP ratio. They can afford that level in very different ways. One country could tend to expropriate its citizens, imposing a high administrative burden and giving them few or no rights to appeal; and, once revenues have been raised, it could be inefficient in transferring the money to the spending ministers who provide public services. If one country has these features that another one does not have, even if they have the same tax-to-GDP ratio, their fiscal capacity is arguably different. Other tax-effort based indicators do not provide better measures of fiscal capacity either. A higher share of income taxes in total taxes may simply reflect a culture of tax compliance (that is, a lack of tax evasion) in the country and does not tell us anything about the efficiency and effectiveness with which taxes are raised, and on the power that taxpayers have with respect to the revenue office.
More importantly, from our perspective, outcome-based measures of fiscal capacity, such as the tax-to-GDP ratio, cannot differentiate between two quite different dimensions of fiscal systems related to the exercise of taxation powers. One has to do with their effectiveness in raising tax revenues, i.e. the ability to coerce citizens to pay taxes. We call this the effectiveness dimension. The other has to do with the fairness of the exercise of taxation powers: the ability of tax systems to make the state accountable and transparent to its citizens. We call this the impartiality dimension.Footnote 5
In this paper, we use six indicators selected from the Public Expenditure and Financial Accountability (PEFA 2006) Program database, which provide a clear way of differentiating between the impartiality and effectiveness of tax systems. They are described below:Footnote 6
1. Transparency of taxpayer obligations and liabilities: evaluating taxpayers’ access to information on tax liabilities and administrative procedures;
2. Tax appeals: assessing the existence and functioning of a tax appeals mechanism;
3. Controls in the taxpayer registration system: assessing the quality and maintenance of a taxpayer database;
4. Effectiveness of penalties for non-compliance: addressing failures in registration and tax declaration obligations that assess whether penalties for all areas of non-compliance are set sufficiently high to act as a deterrence and are consistently administered;
5. Quality of tax audit: assessing the planning and monitoring of tax audit and fraud investigation programmes;
6. Effectiveness in collection of tax payments: looking at the frequency of complete accounts reconciliation between tax assessments, collections, arrears records and receipts by the Treasury.
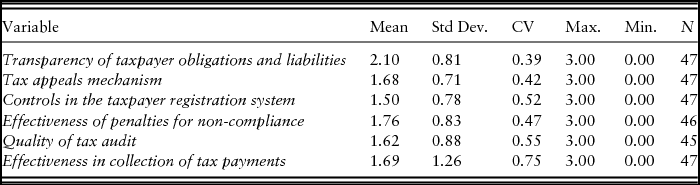
The first two indicators capture the impartiality aspect of fiscal capacity, since they hinge on the relationship between the state and the public: empowering it against the taxation powers of the former or making such power clearly defined and not subject to discretion. The third one can also be seen as a measure of impartiality, because it is related to the ability of the tax system to make taxation transparent to the citizens. But its description also indicates that there is a significant element of coerciveness. So we preferred to include it in the set of effectiveness measures, to avoid criticism that such classification is ad hoc. The last three measures assess the coercive aspects of the tax system: they are all desirable features of a tax machine that aims to raise revenues.Footnote 7 Table 1 provides descriptive statistics for the key variables of interest. Higher scores indicate greater levels of fiscal capacity: both impartiality and effectiveness.

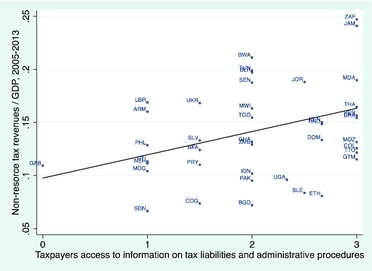
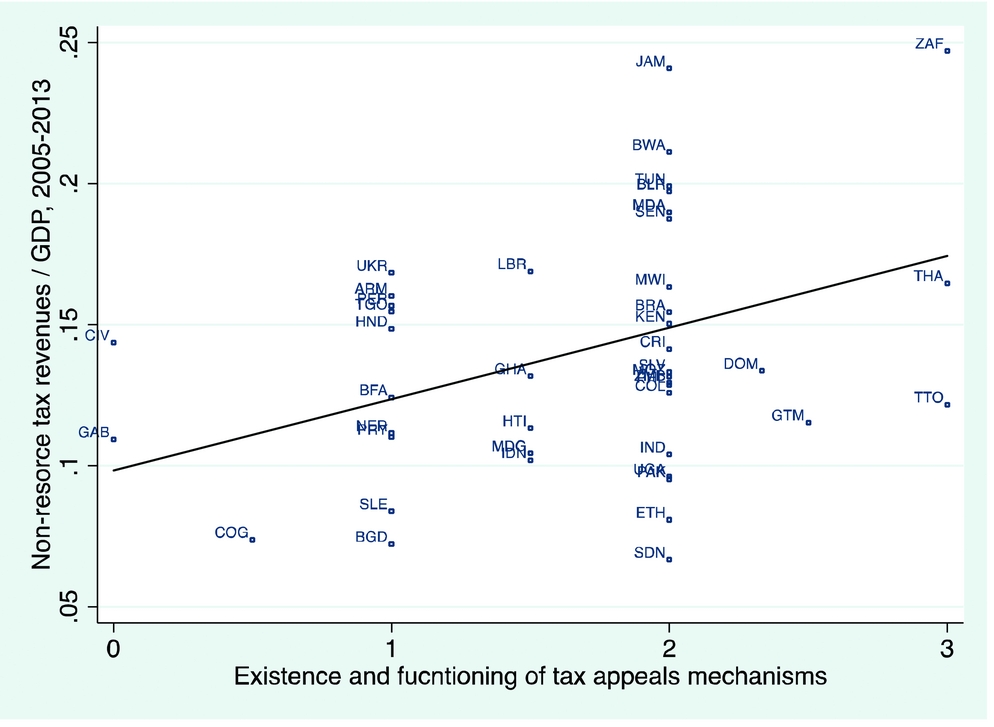
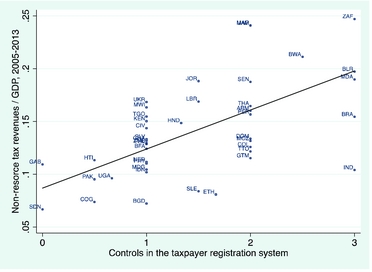
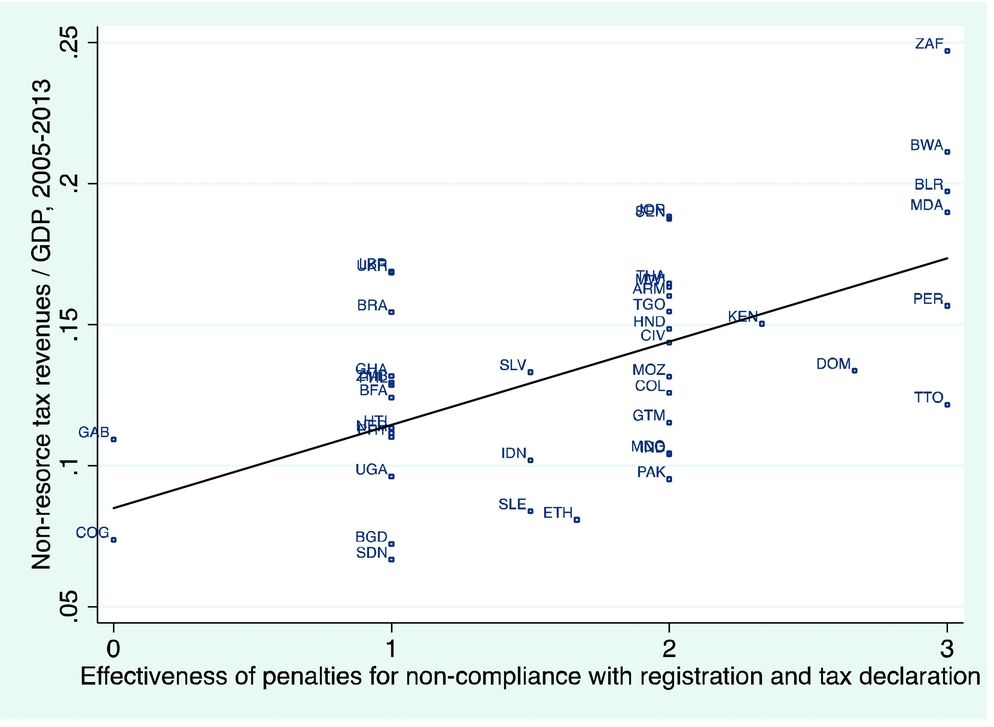
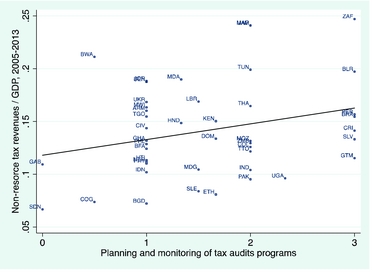
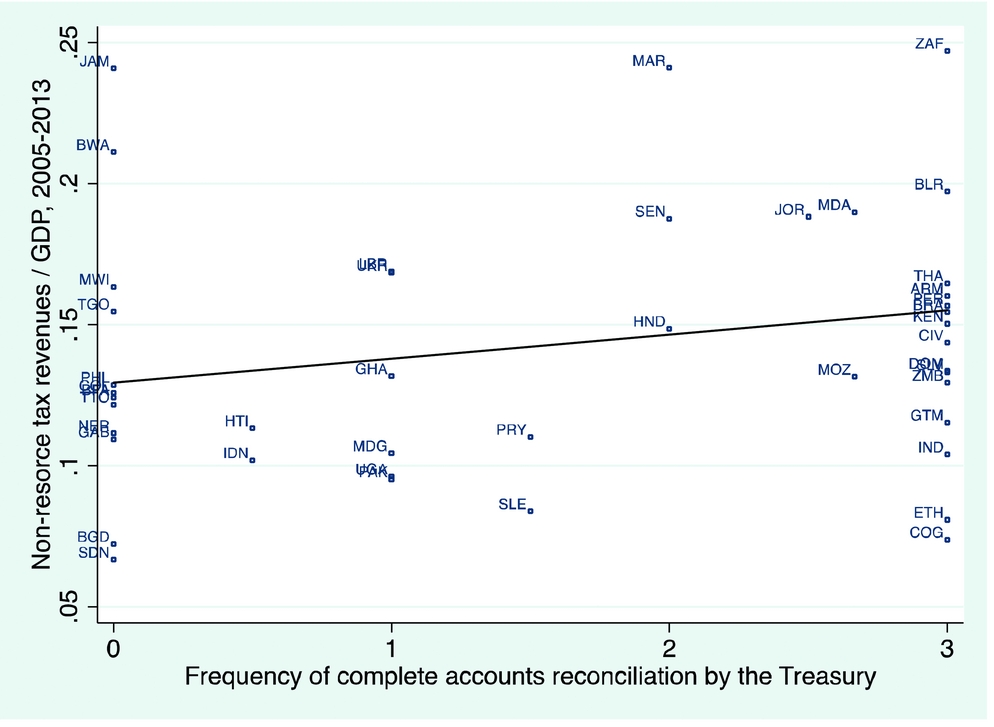
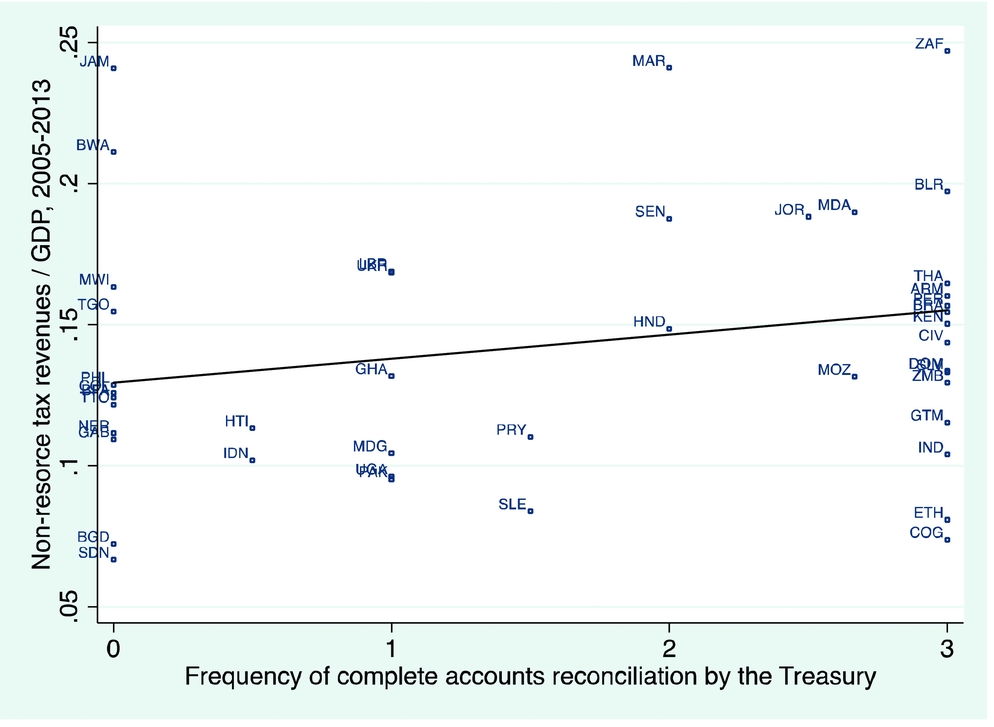
How correlated are the six PEFA measures of fiscal capacity with the more conventional measure of fiscal capacity – that is, tax revenues as a percentage of GDP? In Figures 1a–1f, we present scatter plots of the six measures against non-resource tax revenues/GDP for our sample of countries.Footnote 8 We find a positive relationship between the six PEFA measures capturing the impartiality and effectiveness of the tax system and tax revenue mobilisation. In particular, the positive correlation between the first two PEFA measures and tax revenue mobilisation suggests that how a developing country does in the impartiality dimension is a good predictor of its government's ability to raise tax revenues. Previous work by political scientists and fiscal sociologists on successful examples of tax reforms in developing countries also supports this point (see Brautigam et al. Reference Brautigam, Fjeldstad and Moore2008). In the next section, we discuss the political determinants of the impartiality and effectiveness dimensions of a taxation system.
Transparency of taxpayer obligations and liabilities and tax revenues/GDP

Quality of tax appeals system and tax revenues/GDP

Quality of the taxpayer registration system and tax revenues/GDP

Effectiveness of penalties for non-compliance and tax revenues/GDP

Quality of tax audit and tax revenues/GDP

Effectiveness in collection of tax payments and tax revenues/GDP
3. The political determinants of fiscal capacity
In the recent literature on the political economy of development, fiscal capacity is seen as a ‘pillar’ of economic development as the expansion of the tax base allows states to invest in the public goods essential for economic development (Besley and Persson Reference Besley and Persson2011; Dincecco Reference Dincecco2017). Cohesive political institutions, seen as a stronger system of checks and balances on the executive, are believed to be one key ingredient to improve tax systems, so developing infrastructures that can raise taxes from a broad base. Where subject to effective checks and balances, incumbents will tend to promote common interests rather than using the state to retain power or redistribute to their own cronies (Besley and Persson Reference Besley and Persson2009). Thus it follows from this literature that placing limitations on the executive power is an essential condition for developing fiscally (and legally) capable states. However, this literature does not differentiate between different aspects of a taxation system, and in particular, between the impartiality and effectiveness of a taxation system: this is important to understand how constraints on the executive affect the ability to raise revenues. We argue below that the causal effect that the degree of constraints on the executive may have on fiscal capacity may differ, depending on whether the effect is on the effectiveness dimension of fiscal capacity or on the impartiality dimension of fiscal capacity. In particular, we argue that constraints on the executive are a significant determinant of the impartiality dimension of fiscal capacity and are likely to have a positive effect, while they are not a significant determinant of the effectiveness dimension of fiscal capacity.
We first discuss the relationship between the nature of constraints on the executive and the effectiveness of taxation systems. To start with, consider two types of autocrats: the first is the autocrat as a ‘stationary bandit (that) has an encompassing interest in the territory he controls and accordingly provides domestic order and other public goods’ (Olson Reference Olson1993: 569). The second type of autocrat is a ‘roving bandit’ with a sufficiently short time horizon, so it would be ‘[in] his interest to confiscate the property of his subjects, to abrogate any contracts he has signed in borrowing money from them, and generally to ignore the long-run economic consequences of his choices’ (Olson Reference Olson1993: 572). The first autocrat, with a long time horizon, is a leader with a long-term vision and a commitment to enact institutional reforms and policies that are likely to be growth enhancing (such as Deng Xiaoping in China). The second type of leader has a short-term vision (perhaps because he is in an unstable political environment where he may lose power), and engages in high levels of predation (such as Mohammed Farah Aidid and Ali Mahdi Mohamed in Somalia in the 1990s). The autocrat with a long time horizon – the ‘stationary bandit’ – who is interested in staying in power, as well as maximizing long-term income to mobilise tax revenues both to provide public goods to his own citizens and to extract some of the revenues for his personal benefit, has a strong incentive to invest in the effectiveness of the taxation system. By doing so, the autocrat can maximise tax revenues for a given tax rate. On the other hand, the autocrat with a short time horizon – the ‘roving bandit’ – has little interest in investing in building up the effectiveness of the taxation system, when the returns to the investment are possibly far into the future, and not within the timespan that he considers to be of relevance. Similarly, in democracies, the median voter hypothesis suggests that there is an incentive for rulers to invest in effective tax systems, so that the party in power can provide the public goods necessary for re-election. At the same time, in democracies, ‘the tenure, terms and time horizons of democratic political leaders are even shorter than those of the typical autocrat, and the democracies lose a great deal of efficiency because of this’ (Olson Reference Olson1993: 572).
This suggests that when it comes to the effectiveness dimension of fiscal capacity, there is no reason to expect that executives with limited checks on their authority will behave differently from executives with significant constraints on their power with respect to making taxation systems effective in collecting more revenues for the state. Therefore, the degree of constraints on the executive is not a significant determinant of tax system effectiveness, with the relationship between constraints on the executive and the effectiveness dimension of fiscal capacity likely to go either way.
What about the relationship between the degree of constraints on the executive and the impartiality dimension of taxation systems? Here, we may expect authoritarian regimes to behave differently from democratic systems. Fairness in taxation systems may be seen as part of a ‘fiscal contract’ between the state and its citizens (Brautigam et al. Reference Brautigam, Fjeldstad and Moore2008). Transparency and accountability of taxation systems are about state–society relations, involving an exchange of tax revenues for services.Footnote 9 Creating mechanisms of accountability and placing constraints on rulers facilitate the existence of a fiscal bargain, at the heart of the relationship between citizens and rulers. According to Levi (Reference Levi1988), it should reduce the transaction costs of taxes by making compliance ‘quasi voluntary’ and by building ‘tax morale’ (Doerrenberg and Peichl Reference Doerrenberg and Peichl2013; Luttmer and Singhal Reference Luttmer and Singhal2014). Citizens should be more willing to enter into a fiscal contract with the state, as they have more control over its actions and greater belief in its legitimacy (Bates and Lien Reference Bates and Lien Da-Hsiang1985). Accountability and responsibility processes in tax systems ‘engage taxpayer-citizens collectively in politics and leads them to make claims on government for reciprocity, either through short-term conflict or long-term increases in political engagement’ (Prichard Reference Prichard2010: 13). Such processes are more likely to emerge in cohesive political systems where there are significant constraints on the power of the executive, and where politicians have an incentive to signal the legitimacy of the state by making the tax system more transparent and non-discriminatory (Cheibub Reference Cheibub1998). Furthermore, transparency in taxation systems is more likely to emerge in regimes where political elites are more constrained in their powers to evade taxes or bend tax rules in their favour (while in regimes with limited checks on the executive, elites face little constraints in avoiding taxes or in devising a non-transparent tax system that discriminates in their favour).
Lesotho and Rwanda are an interesting comparison among African countries. They are similar in many respects (both are small and landlocked, have analogous per capita GDP levels and comparable functional shares of GDP, and both have arranged semi-autonomous revenue authorities), but are somehow different in their openness, with Lesotho much more reliant than Rwanda on international trade. They differ from a political point of view: according to the Freedom in the World Report by Freedom House, Lesotho has been ‘partly free’ since 1992, with periods during which it was rated ‘free’ (e.g. the years 2002–8), whereas Rwanda has been consistently ‘not-free’. The two fiscal systems are quite different: Rwanda relies on direct and indirect taxes, whereas Lesotho mainly exploits trade taxes. Rwanda stresses effectiveness in revenue collection, while Lesotho does not attempt to chase the large unregistered economy, because voters can revolt in the ballot box against what is perceived as excessive taxation on those who live at the subsistence level. Yet the more consensual Lesotho has a larger tax effort ratio than Rwanda (D'Arcy Reference D'Arcy2012).Footnote 10 Historically, the example of the introduction of direct income tax in the United Kingdom in 1799 provides a clear case of political institutions in determining the impartiality dimension of fiscal capacity, particularly around the provision of tax information and a more accountable tax system. As North and Weingast (Reference North and Weingast1989) argue, after the Glorious Revolution of 1688, there was a shift in political power from the Crown to the Parliament where there was a significant increase in the constraints on the executive – as they note, ‘it was now the King in Parliament, not the King alone’ (p. 816). As Levi (Reference Levi1988: 144) notes:
The evolution of representative institutions was essential to the passage of the income tax. Increased parliamentary control of expenditures and public discussion of tax policy provided some assurance that taxation was in the collective good. Improved communications throughout the countryside meant that the decisions of the Parliament were comparatively public. Thus, the populace could develop a sense of whether a policy was ‘fair’ and whether past contracts were being kept. The existence of the institution of Parliament helped promote the quasi-voluntary compliance that was necessary to make the income tax cost-effective.
This example shows that the greater constraints on the executive in post-Restoration British history played a causal role in the increase in the impartiality dimension of fiscal capacity, which in turn allowed for the passage of the income tax in 1799. Thus, the Besley–Persson argument on the role of cohesive political systems in building the state's fiscal capacity applies more to the impartiality dimension of fiscal capacity rather than to its effectiveness dimension. We can restate our argument on the differing role that political institutions play in augmenting the various dimensions of fiscal capacity, by means of two propositions:
Proposition 1: The degree of constraints on the executive is a significant determinant of the impartiality dimension of fiscal capacity. The effect of the higher constraints on the executive on transparency/accountability dimension of taxation system is positive.
Proposition 2: The degree of constraints on the executive is not a significant determinant of the effectiveness dimension of fiscal capacity. Hence, the effect of the higher constraints on the executive on the effectiveness of a taxation system is not statistically different from zero.
In the next section, we propose an empirical strategy to test the above hypotheses using cross-national, cross-sectional data.
4. Econometric methods and identification
Since the objective of the paper is to look at the structural conditions under which countries develop capable states, regressions based on cross-section averages are a suitable approach as they test relationships whose mechanisms have long-run characteristics. This is an established methodological choice in econometric research on institutions (prominent examples are Acemoglu et al. Reference Acemoglu, Johnson and Robinson2001; Acemoglu et al. Reference Acemoglu, Johnson, Robinson and Thaicharoen2003) and implies explaining the dependent variable using long-term averages of the explanatory variables to capture structural cross-country variation.Footnote 11 Hence, the regression specification takes the form:
 $$\begin{equation}
F{C_{i,T,T - 1}} = {\beta _0} + \beta \cdot {W_{i,t,t - 1}} + {X'_{i,t,t - 1}} \cdot \phi + {\varepsilon _{i,t,t - 1}}
\end{equation}$$
where, FCi,T,T −1 captures the quality of current fiscal institutions as the average of a given dimension of fiscal capacity of interest for country i between the end of the sample period, T, and T-1, captured here by the six PEFA indicators. Besley and Persson (Reference Besley and Persson2011) suggest that fiscal and legal capacities have common determinants and that investing in one dimension of state capacity simultaneously reinforces the other, i.e. there are complementarities. By extension, we apply this hypothesis to the different dimensions of fiscal capacity.
On the right-hand side, Wi,t,t −1 is the determinant of fiscal capacity of interest, averaged between times t and t-1, with t < T-1, and β represents its long-run effect on fiscal capacity. It is measured as the average value of Constraints on the executive from the Polity IV dataset from 1965 (or independence year, if later) up to 2004 (Marshall et al. Reference Marshall, Jaggers and Gurr2011), since we are interested in the long-run component of these constraints (and not in the annual fluctuations). But taking this variable as a 2000–4 average, as an alternative measure, delivers similar results (available on request). This variable measures the extent of constitutional limits on the exercise of arbitrary power by the executive, i.e. whether the executive power is subject to institutionalised checks and balances (on a scale from 1 to 7, where 1 indicates unlimited authority of the chief executive and 7 indicates executive parity or subordination, with intermediate values indicating moderate to substantial power limitations). Similarly, Xi,t,t −1 is a set of controls (described and discussed in the results section). Finally, εi,t,t −1 is the error, capturing all other omitted factors.Footnote 12
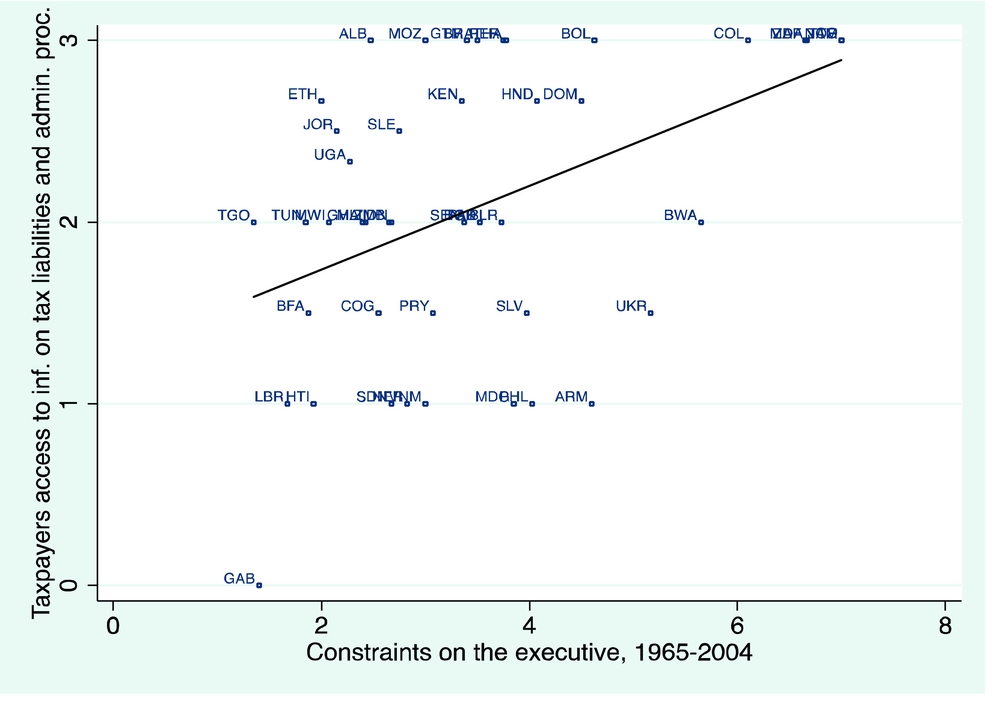
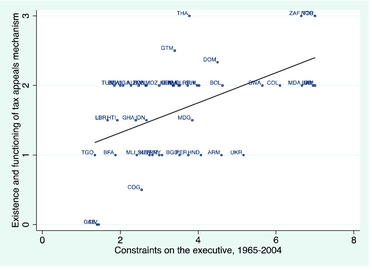
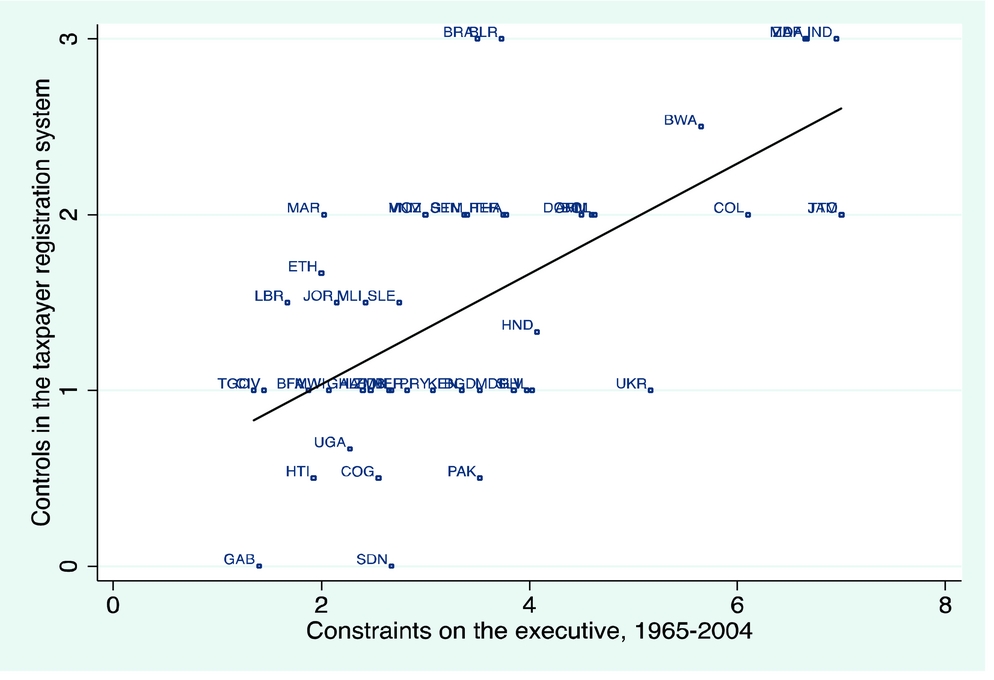
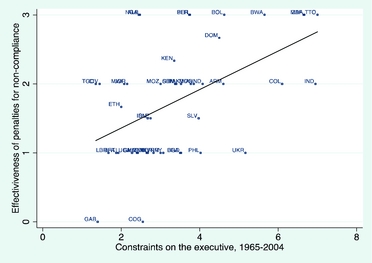
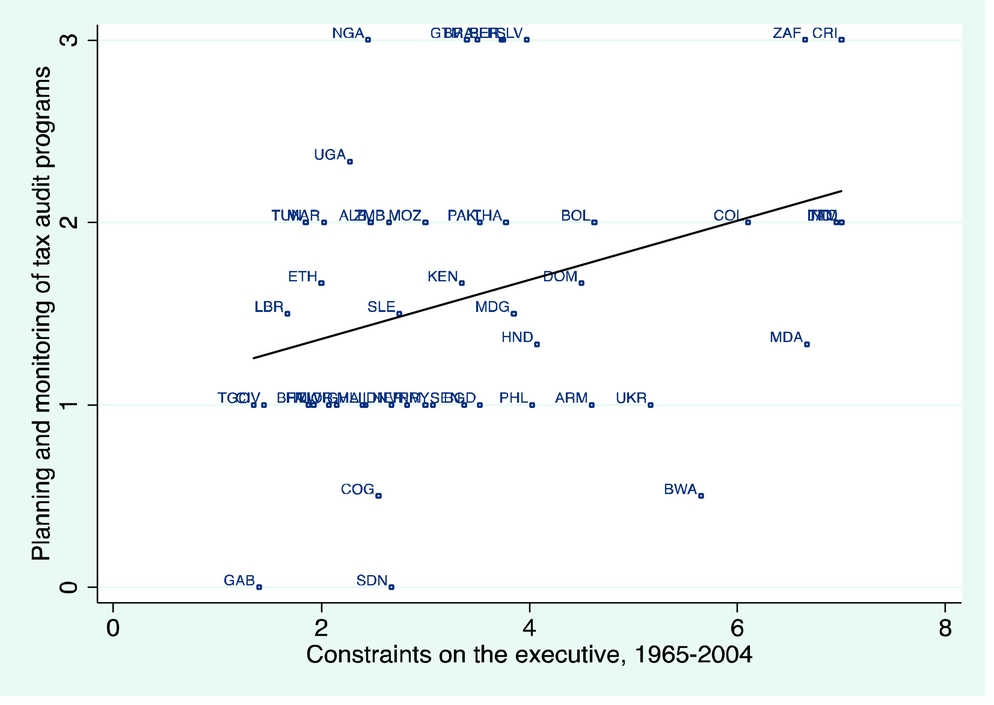
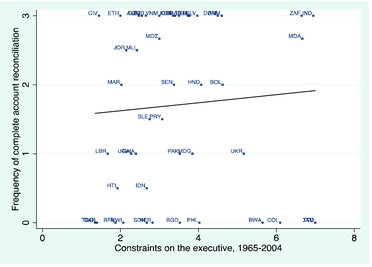
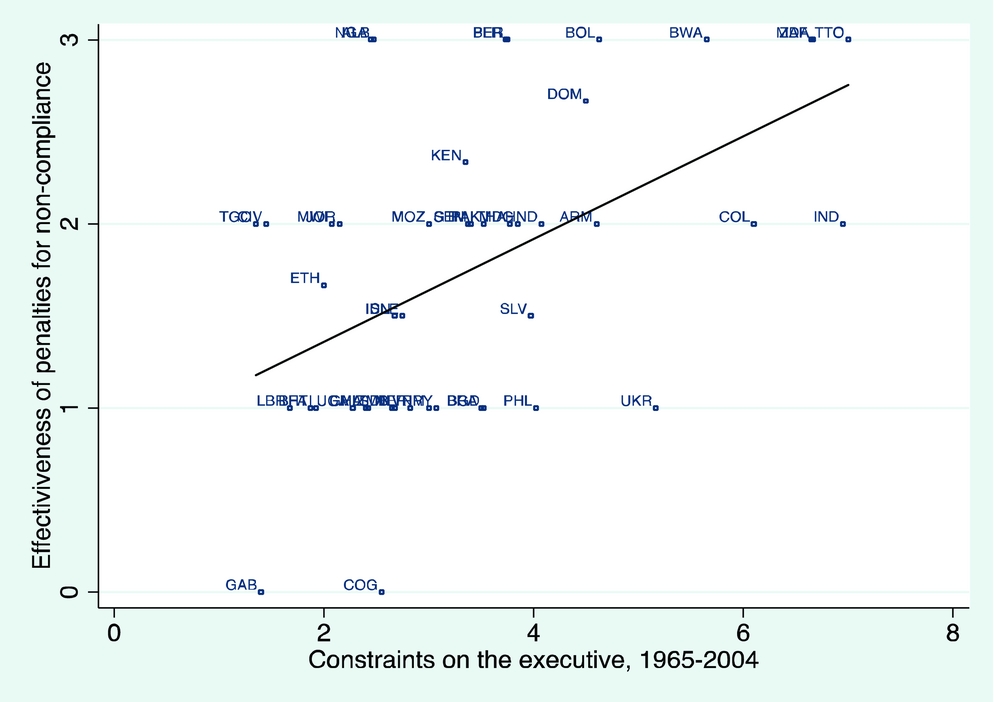
Figure 2 provides some preliminary evidence on the relationship between the degree of Constraints on the executive and the different dimensions of fiscal capacity. There seems to be a positive correlation of constraints on the executive with both impartiality measures and effectiveness measures. However, while useful to illustrate the behaviour of key variables, one should not yet be tempted to give any causal interpretation to such correlations.
Transparency of taxpayer obligations and liabilities and Constraints on the executive

Quality of tax appeals mechanism and Constraints on the executive

Quality of the taxpayer registration system and Constraints on the executive

Effectiveness of penalties for non-compliance and Constraints on the executive
Quality of tax audit and Constraints on the executive

Effectiveness in collection of tax payments and Constraints on the executive

Before estimating (1), we should first discuss whether estimating the impact of political institutions is subject to identification problems. Although there are good reasons to expect a causal relationship between rulers’ accountability and fiscal capacity development, OLS estimates are insufficient to document such a relationship. Building a political system is clearly an endogenous process, driven by a variety of social forces, including state actors. One such possibility is that taxation may lead to increased political representation (e.g. Moore Reference Moore2007; Timmons Reference Timmons2010). When estimating the relationship from the data, the effect of constraints on the executive could then be affected by reverse causality, hence subject to bias in OLS regressions. A concern is also that the effect of political systems may be endogenous in the statistical sense, namely correlated with the regression disturbances because of measurement error. Therefore, one might expect the coefficients on Constraints on the executive to be biased both away from zero and towards zero. The magnitude of the two types of bias, and their combined effect, is an open question, but here we attempt to address the problem using an instrumental variable approach, presenting estimates from different methods.
Our instrument has a prominent place in the literature: historical settler mortality, as captured by the (log of) mortality rate due to the disease environment at the time of colonisation. Acemoglu et al. (Reference Acemoglu, Johnson and Robinson2001) documented that such a variable picks the exogenous variation in the type of institutions built in the former European colonies. Where European colonisers settled en masse, life was organised around inclusive institutions, i.e. subjecting the ruling elite to binding limitations to their power. Where they could not settle, due to adverse sanitary conditions, institutions were extractive, i.e. subject to little or no constraint on the rulers. Compared to its alternatives, this instrument had a more plausible justification (see Acemoglu Reference Acemoglu2005). Perhaps for this reason, it has survived criticism, which has been made on the grounds of data quality and accuracy (e.g. Albouy Reference Albouy2012). Since it was proposed, it has been exploited successfully to identify the effect of the Constraints on the executive variable (e.g. Acemoglu et al. Reference Acemoglu, Johnson and Robinson2001; Acemoglu et al. Reference Acemoglu, Johnson, Robinson and Thaicharoen2003). Of course, the exclusion restriction that the instrument does not affect the second stage left-hand-side is always one of the most vulnerable parts of any IV identification strategy. So, while we rely on Acemoglu et al.’s (Reference Acemoglu, Johnson and Robinson2001) intuition on the plausibility that settlers’ mortality does not directly affect level of fiscal capacity (other than through its effect on Constraints on the executive), we also address exclusion restriction concerns through econometric testing.
5. Results
This section presents the results, in three steps. We first illustrate the basic results. Then we present a series of robustness checks: for omitted variables, and for instrument weakness and validity. Finally, we show evidence on the channels through which the political institutions hypothesis may affect fiscal capacity.
Basic results and robustness checks for omitted variables
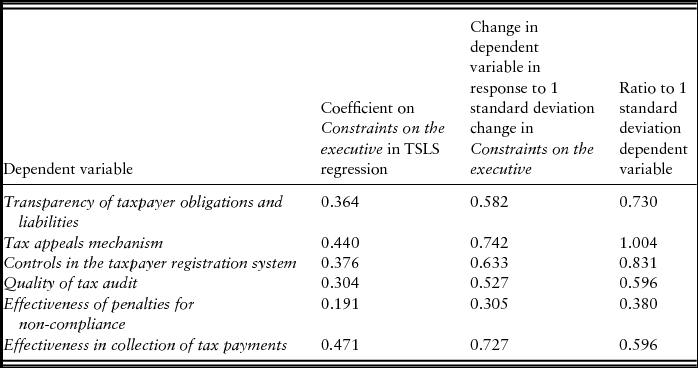
Using the log of settlers’ mortality as an instrument for Constraints on the executive and two-stage least squares (TSLS), Table 2 shows that Constraints on the executive predicts a higher level of fiscal capacity in both its organisational aspects related to the impartiality of taxation power (first two variables) and in three of its effectiveness aspects. The magnitude of the effects is higher in instrumental variables than in OLS estimates, suggesting that the causal effect of Constraints on the executive is actually understated by the OLS relationship. Constraints on the executive are, however, irrelevant when it comes to predicting the level of Effectiveness of penalties for non-compliance.
Basic results for fiscal capacity and constraints on the executive: OLS and instrumental variables (TSLS)

Heteroscedasticity-robust standard errors in parentheses.
* significant at 10%; ** significant at 5%; *** significant at 1%.
How much do Constraints on the executive matter as a determinant of fiscal capacity? A one-standard deviation increase in the index (1.5 points) increases Transparency of taxpayer obligations and liabilities by over 0.7 standard deviations, and the quality of the Tax appeals mechanism by 1 standard deviation (Table 3). The amount by which Constraints on the executive foster the impartiality aspects of fiscal capacity seems economically meaningful (in 18% of developing economies, it is above 1 standard deviation), as well as statistically significant. Apart from the quality of the taxpayer registration system, the magnitudes of the effects are smaller for the other three variables capturing effectiveness aspects (and not always significant).
Magnitude of effect on fiscal capacity of change in constraints on the executive

We expand on the basic results by adding a series of robustness checks for omitted variables. The literature on state capacity has proposed plausible alternatives to the political institutions hypothesis. Some are historical in nature, i.e. the length of statehood and the incidence of external and internal conflicts. Others are geographical, i.e. the reliance of the economy on natural resources, rents and population density.
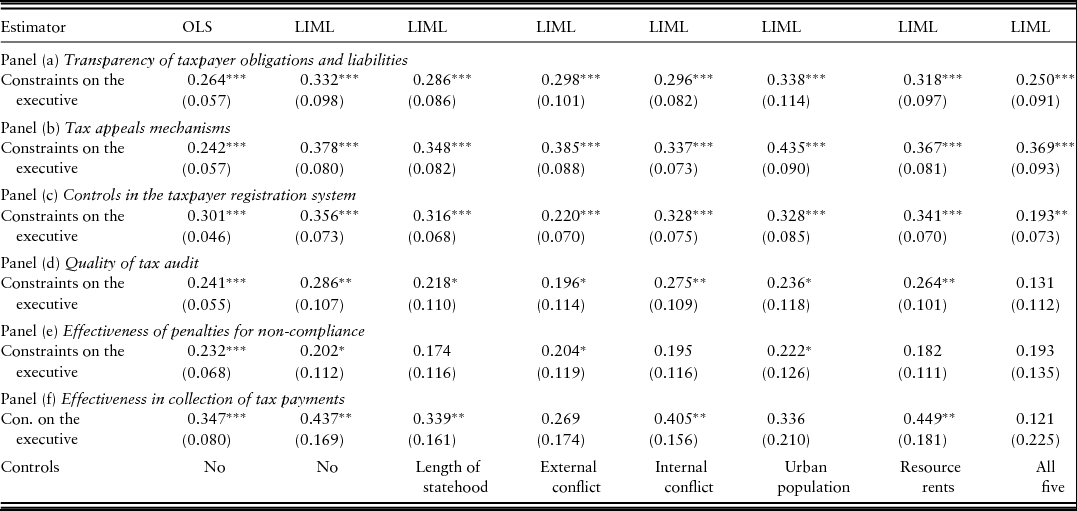
Building on Tilly (Reference Tilly1990), Besley and Persson (Reference Besley and Persson2009, Reference Besley and Persson2011) argue that, in a society where groups compete for power, the incidence of external wars supports the demand for common-interest public goods (i.e. defence) that, in turn, increases the incentive to invest in fiscal (and legal) capacity. Vice versa, the incidence of civil wars promotes redistributive interests, reducing the incentive to invest in state capacity. To capture the historical relevance of external and internal conflicts, we use the proportion of years at war from independence up to 2000 and the proportion of years in civil war over 1950–2000. Both variables are from Besley and Persson (Reference Besley and Persson2011). Introducing such variables also leaves the significance of Constraints on the executive unchanged with respect to variables on the impartiality of taxation powers. In fact, the magnitude of the Constraints on the executive effect even increases in some cases, showing that the political institutions hypothesis survives when compared to the alternative conflict hypotheses. Interestingly, the incidence of external conflict wipes out its significance for one of dependent variables relating to the effectiveness of taxation powers (Effectiveness in collection of tax payments) and reduces the magnitude of another (Controls in the taxpayer registration system), showing that the coefficient of interest may be picking the effect of another common interest mechanism due to the need for a public good like national defence.
Length of statehood is captured by the state antiquity index, proposed by Bockstette et al. (Reference Bockstette, Chanda and Putterman2002) and based on the intuition that longer histories of statehood lead to higher quality administration due to ‘learning by doing’ effects.Footnote 13 In this case, the coefficient on Constraints on the executive drops slightly, when controlling for length of statehood, for our dependent variables relating to the impartiality of taxation powers, but it is still highly significant. It loses significance, however, for the effectiveness measure on quality of tax audit.
Economies where a substantial part of national income accrues from natural resources, to the extent that such resources flows accrue directly to the government, have less incentive to invest in fiscal capacity. For example, Isham et al. (Reference Isham, Woolcock, Pritchett and Busby2005) argue that countries rich in resources extracted from a narrow geographic or economic base are predisposed to heightened economic and social divisions and have weakened institutional capacity. To capture such effect, we use the 1970–2004 average share of GDP accruing from total resource rents (as the sum of oil, natural gas, coal, mineral, and forest rents), from World Bank (2013). Similarly, inspired by Herbst (Reference Herbst2000), it is organisationally more challenging to develop taxation infrastructures in sparsely populated states than in states where the population is concentrated in urban areas. To capture this effect, we use the share of urban population from World Bank (2013). Geography-based robustness checks are particularly important, as the settler mortality rate could be proxying for ‘resource curse’ mechanisms or population density. For example, disease conditions may well be a determinant of where urban areas arise. So we can examine whether the Constraints on the executive results survive when we control independently for geographical variables. They survive indeed in the case-dependent variables relating to the impartiality of taxation power, as such controls do not greatly affect the significance and magnitude of the coefficient of interest. The online appendix reports these results in full.
Accounting for instrument weakness
The next set of robustness checks is to assess whether our instrument is weak. The first stage regressions generally show a highly significant relationship between the log of settlers’ mortality and the measure of constraints on the executive, but the F-statistics for the first stage regressions are occasionally borderline or a little weak in some cases, potentially indicating a problem with weak instruments.Footnote 14
If our instrument is weak, the estimated coefficient of interest could be biased towards OLS even if the instrument is weakly correlated with the error term, and especially in small samples. As a remedy, there is general agreement in the literature to use Limited Information Maximum Likelihood (LIML) estimation (e.g. Cameron and Trivedi Reference Cameron and Trivedi2005: 190–2). Therefore, to account for potential instrument weakness, we re-estimate our regressions using Fuller's version of LIML (Baum et al. Reference Baum, Schaffer and Stillman2007; Fuller Reference Fuller1977), which is more robust than 2SLS in the presence of weak instruments, as shown in the simulations carried out in Hahn et al. (Reference Hahn, Hausman and Kuersteiner2004), and appears to have lower small-sample variability than LIML. We set the user-specified constant (denoted by alpha in Fuller Reference Fuller1977) to a value of 4. While the Fuller 1 estimator yields the most unbiased estimator, the Fuller 4 version minimises the mean squared error of the estimator (Fuller Reference Fuller1977).
Fuller's LIML estimates, since they are broadly comparable to TSLS estimates, seem to confirm the previous set of results (Table 4). In particular, the effect of constraints on the executive seems very robust for the impartiality variables, but it does not seem to be robust for variables capturing the effectiveness aspects of taxation power, with the exception of one variable. It is noteworthy that, in line with TSLS estimates, for such variables the coefficient of interest drops in magnitude and loses significance once we control for external conflict, suggesting that it was picking the effect of another type of common interest mechanism, due not to political cohesiveness, but to the emergence of a common interest consisting in the national defence. Taken together, these results suggest that effect of constraints on the executive seems very robust for the impartiality variables, but it does not seem to be robust for variables capturing the effectiveness aspects of taxation power, with the exception of one variable.
Accounting for instrument weakness: Fuller's Limited Information Maximum Likelihood estimates

Heteroscedasticity-robust standard errors in parentheses.
* significant at 10%; ** significant at 5%; *** significant at 1%.
Further robustness checks
We also do three further types of robustness tests (available in the online appendix or on request). First, we experiment with a number of other controls, including political democracy, per capita GDP, legal origins, aid dependency, the role of social divisions (income inequality and fractionalisation) and regional dummies (to capture unobserved regional effects). Introducing such variables in our regressions does not significantly alter our results. Second, we test whether the instrument meets the exclusion restriction by running a test of over-identification. Using as a second instrument the distance of the country from the equator (following Acemoglu et al. Reference Acemoglu, Johnson and Robinson2001), such tests fail to reject the exclusion restriction at the conventional levels in all cases, and by a large margin in five out of six regressions. Third, we experiment with alternative ways to calculate impartiality and effectiveness, combining the PEFA measures together. The results confirm the key hypothesis of the paper.Footnote 15
Does limiting executive power matter to tax revenues?
Our findings indicate that political institutions limiting executive power tend to improve the transparency and accountability of fiscal systems. However, nothing has been done hitherto on identifying the impact on tax revenues. This exercise would be a useful complement to the previous set of results based on PEFA variables. Moreover, as tax effort variables are available for a broad number of countries, it also enables us to include a larger sample of former European colonies in our regressions.
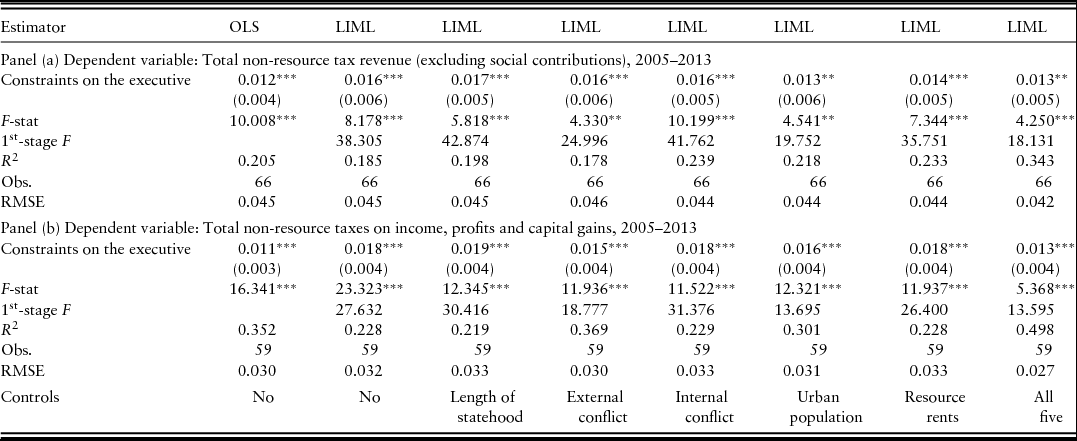
For robustness, we experiment with two tax effort measures from the recently published ICTD (2015) database. One is Total non-resource tax revenue, 2005–13 average (the one used in Figure 1). The second one is Total non-resource taxes on income, profits and capital gains, 2005–13 average. As collecting income tax requires major investments in fiscal infrastructure compared to other types of taxes, this variable is more likely to reflect the ‘true’ extent of fiscal capacity (Besley and Persson Reference Besley and Persson2011: 41–2). Table 5 shows that the effect of constraints on the executive on tax revenues is consistently positive for the two tax effort variables and is robust to the whole set of controls we have included so far. This effect results from the combined effect of the impartiality and effectiveness dimensions of fiscal capacity and presumably reflects their complementarities too.
Overall effect of Constraints on the executive on tax effort

Heteroscedasticity-robust standard errors in parentheses.
* significant at 10%; ** significant at 5%; *** significant at 1%.
How big is the overall effect of Constraints on the executive on tax revenues? Based on the estimates in the right-hand column, a 1 standard deviation increase in the index (1.87 points) would result in an average increase in total revenues or income tax revenues (a share of GDP) of 2.4 percentage points over 2005–13 (corresponding to approximately half the standard deviation of the dependent variable). Knowing that approximately 22% of economies in the sample are 1 standard deviation above the mean, this is significant.
6. Conclusions
It is widely recognised that fiscal capacity is a crucial determinant of economic development as well as state formation in developing countries. However, it is less understood what determines fiscal capacity in a developing country context, with geography, history and political economy seen as complementary explanations of variations in state capacity across the world. In this paper, we examine the role of political economy, focusing on the degree of constraints that executives face as the key determinant of taxation capacity. Drawing from the political economy and political science literature, and differentiating between the coercive and accountability/transparency dimensions of taxation capacity, we hypothesise that the effect of a higher constraint on the executive on taxation capacity would not be symmetrical across the two dimensions. Constraints on the executive are likely to exert a positive effect on the accountability and transparency of taxation systems, but their effect on the coerciveness of taxation systems is likely to be ambiguous.
We then test our hypotheses using a recent data set on the public financial management of developing countries compiled by the World Bank and other donor agencies to construct measures of taxation capacity for 47 developing countries. We find that there is a substantial positive effect between institutions that place constraints on executive power and current fiscal institutions relating to the accountability and transparency of taxation power: the quality of administrative procedures on tax liabilities and tax appeals mechanisms. We show that our findings are robust to different specifications, controls and estimation methods. However, we find a much less robust effect from institutions placing constraints on executive power on current fiscal institutions relating to their effectiveness in raising tax revenues, as captured by the quality of administrative procedures on the collection of tax payments and the quality of taxpayers’ databases. We also present evidence, on a broader sample of former European colonies, indicating that the effect of political institutions on tax effort is substantial, both on income tax and total tax revenues. Our findings indicate that to build fiscally capable states a key route is the consolidation of cohesive political institutions, providing strong checks and balances on the discretionary power of the executive as they facilitate a fiscal bargain between citizens and rulers.