





Introduction
Impulsivity, sensitivity to reward, and sensitivity to punishment are core personality dimensions that profoundly shape human decision-making and mental health (Bijttebier, Beck, Claes, & Vandereycken, Reference Bijttebier, Beck, Claes and Vandereycken2009; Moeller et al., Reference Moeller, Barratt, Dougherty, Schmitz and Swann2001). Impulsivity is characterized by a lack of careful consideration leading to rapid, unplanned reactions (Patton, Stanford, & Barratt, Reference Patton, Stanford and Barratt1995), whereas sensitivity to reward/punishment refers to individual differences in responsiveness to appetitive and aversive stimuli, respectively (Torrubia, Avila, Moltó, & Caseras, Reference Torrubia, Avila, Moltó and Caseras2001). Crucially, high impulsivity and dysregulated sensitivity to environmental cues are transdiagnostic risk factors associated with addiction, antisocial behavior, and mood disorders (Carver & White, Reference Carver and White1994; Maxwell, Gardiner, & Loxton, Reference Maxwell, Gardiner and Loxton2020; Moeller et al., Reference Moeller, Barratt, Dougherty, Schmitz and Swann2001). Theoretically grounded in Reinforcement Sensitivity Theory (RST) (Gray, Reference Gray1970; McNaughton & Corr, Reference McNaughton and Corr2004), impulsivity and SR reflect heightened reward-driven Behavioral Activation (BAS), predisposing individuals to risky behaviors. Conversely, high SP reflects Behavioral Inhibition (BIS) activation, typically driving risk aversion and anxiety (Quilty & Oakman, Reference Quilty and Oakman2004).
In contrast, self-control functions as a critical regulatory resource, enabling individuals to override impulsive urges and immediate gratification to achieve long-term goals (Tangney, Baumeister, & Boone, Reference Tangney, Baumeister and Boone2004). Beyond these clinical vulnerabilities, the interplay of these traits critically influences everyday decision-making and resilience in normative populations, particularly as individuals navigate the complex developmental demands and transitions of early adulthood. In this context, self-control acts as a ‘brake’ to the ‘accelerator’ of sensitivity to reward and impulsivity (Duckworth & Steinberg, Reference Duckworth and Steinberg2015). Individuals with high self-control are better equipped to regulate their emotions and behaviors, effectively dampening the pursuit of immediate rewards in favor of rational decision-making (Duckworth & Steinberg, Reference Duckworth and Steinberg2015; Mischel, Shoda, & Rodriguez, Reference Mischel, Shoda and Rodriguez1989). However, traditional variable-centered research isolates these dimensions, overlooking how their intra-individual co-occurrence shapes psychological adaptation. For instance, high reward sensitivity may be adaptive when paired with high self-control but maladaptive with high impulsivity. Consequently, a person-centered approach, such as latent profile analysis (LPA), is essential. By delineating holistic behavioral profiles, LPA captures the complex interplay between regulatory and reactive traits, offering a nuanced understanding of individual differences in adaptability (Bergman & Magnusson, Reference Bergman and Magnusson1997; Howard & Hoffman, Reference Howard and Hoffman2018).
Importantly, insights emerging from mapping intrinsic brain connectivity networks provide a potentially mechanistic framework for a deeper understanding of various aspects of human behavior, particularly psychological adaptability and self-regulation (Cheng et al., Reference Cheng, Cai, Liu, Yang, Pan, Zhang, Mo, Yu and Zhu2025). Neurologically, this regulation-reactivity interplay relies on cortico-striatal circuits, balancing bottom-up subcortical reward drives (e.g. the striatum) against top-down cortical control (e.g. the medial prefrontal and anterior cingulate cortices) (Casey, Getz, & Galvan, Reference Casey, Getz and Galvan2008; Hofmann, Friese, & Strack, Reference Hofmann, Friese and Strack2009). Critically, functional connectivity between these regions underpins the cognitive control of impulsive drives (Kelley, Baldo, Pratt, & Will, Reference Kelley, Baldo, Pratt and Will2005). However, significant gaps remain in understanding how these neural mechanisms map onto complex behavioral profiles and their prospective longitudinal transitions across early adulthood. First, while variable-centered studies have linked cortico-striatal connectivity to isolated traits like impulsivity (Hu et al., Reference Hu, Salmeron, Gu, Stein and Yang2015; Liston et al., Reference Liston, Watts, Tottenham, Davidson, Niogi, Ulug and Casey2006; Wang, Lv, He, & Xue, Reference Wang, Lv, He and Xue2020), it remains unclear whether distinct neural signatures can differentiate holistic behavioral profiles. Second, and perhaps more importantly, the predictive validity of these circuits remains under-explored (Gabrieli, Ghosh, & Whitfield-Gabrieli, Reference Gabrieli, Ghosh and Whitfield-Gabrieli2015). Most existing research has relied on cross-sectional designs, leaving it unknown whether the baseline functional integrity of cortico-striatal pathways can prospectively predict future gains in adaptive functioning beyond the stability of behavioral traits themselves.
To address these gaps, the present study employs a large-scale longitudinal design integrating behavioral phenotyping with resting-state fMRI. Our study was guided by three primary objectives. First, we adopted a person-centered approach using Latent Profile Analysis (LPA) to uncover naturally occurring trait configurations based on the co-occurrence of impulsivity, sensitivity to reward/punishment, and self-control. Second, utilizing Network-Based Statistics (NBS), we sought to isolate the specific functional connectivity patterns, thereby establishing the neural signatures of behavioral heterogeneity. Third, leveraging our 2-year longitudinal dataset, we examined the prospective predictive validity of these neural markers and further investigated whether the baseline functional integrity of the identified circuits provides incremental value in predicting future behavioral adaptation, above and beyond baseline trait stability. The overall conceptual and analytical framework is illustrated in Figure 1.
Overview of the multimodal longitudinal analysis framework integrating latent profile analysis and network-based statistics. Abbreviations: BIS, ‘Barratt impulsiveness scale’; SCS, ‘self-control scale’; SR, ‘sensitivity to reward’; SP, ‘sensitivity to punishment’; rs-fMRI, ‘resting-state functional MRI’; LPA, ‘latent profile analysis’; NBS, ‘network-based statistic’. T1 and T2 refer to Time 1 and Time 2, respectively.

Figure 1. Long description
The flowchart is organized into four main stages from left to right.
1. Data Collection (T 1 Baseline): A vertical blue container on the left includes Behavioral Surveys (B I S, S C S, S R, S P) represented by a clipboard icon and r s - f M R I Scanning represented by a scanner icon. An arrow points downward to Data Collection (T 2 2-Year Follow-up) which includes Behavioral Surveys.
2. Analysis Pathways: Two horizontal arrows lead from the T 1 container.
- The top arrow, labeled Behavioral Analysis, leads to Latent Profile Analysis (L P A) containing three boxes: Hypothesized Profile 1 (Adaptive), Hypothesized Profile 2 (Moderate), and Hypothesized Profile 3 (Maladaptive).
- The bottom arrow, labeled Neural Analysis, leads to Whole-Brain F C Matrix Construction, listing subjects from Sub 0 0 0 1 to Sub 1 2 2 9.
3. Network Integration: Brackets from the L P A profiles and the subject list converge into a single arrow labeled Network-Based Statistic (N B S). This points to a brain network diagram titled Identify Candidate Neural Circuit, showing red nodes and connections. An arrow labeled Neural Strength leads from this network to the final analysis stage.
4. Longitudinal Prediction Analysis (T 1 to T 2): A large blue box at the bottom right receives inputs from the T 1 neural circuit and the T 2 behavioral surveys. It lists the Primary Goal as testing longitudinal and incremental validity through three steps: Behavioral Validation (T 1 Behave to T 2 Behave), Neural Regression (T 1 Neural to T 2 Behave), and Hierarchical Regression. The Secondary Goal is to examine gender differences in incremental predictive validity.
Methods
Participants
This study utilized data from two samples: a behavior-brain cross-sectional (BBC) sample and a behavior longitudinal (BL) sample. Data collection for the BBC sample occurred between September 2019 and December 2020. University students were recruited to complete a questionnaire survey and undergo an 8-minute resting-state fMRI scan. Participants with incomplete questionnaire responses, history of neurological disorders, or excessive head motion (mean displacement >2 mm or >30% of timepoints scrubbed) were excluded. The final BBC sample consisted of 1,229 participants. Subsequently, a follow-up survey was conducted between October and December 2021 (a two-year interval). A subset of the original participants completed the follow-up, and after quality control, 432 individuals were included in the BL dataset.
Behavior measures
Sensitivity to punishment and sensitivity to reward questionnaire (SPSRQ)
The SPSRQ was used to evaluate individuals’ responsiveness to rewarding and punishing stimuli (Torrubia et al., Reference Torrubia, Avila, Moltó and Caseras2001). This instrument includes two main scales: sensitivity to reward (SR), which reflects the degree of motivation and tendency to pursue rewards, and sensitivity to punishment (SP), which captures anxiety-related and avoidance reactions triggered by punishment signals. The questionnaire consists of 48 items requiring ‘Yes’ or ‘No’ responses, with even-numbered items assessing SR and odd-numbered items evaluating SP. Each subscale contains 24 items, and the score for each ranges from 0 to 24. Higher scores indicate higher sensitivity.
Self-control scale (SCS)
The SCS captures individuals’ capacity for self-regulation and impulse control in various behavioral and psychological contexts (Tangney, Baumeister, & Boone, Reference Tangney, Baumeister and Boone2004). Here, we used its adaptation to the Chinese cultural context (Tan & Guo, Reference Tan and Guo2008). The revised version includes 19 items measuring self-control, each rated on a 5-point Likert scale (1 = completely untrue, 5 = completely true). Total scores range from 19 to 95, with higher scores indicating stronger self-control.
Barratt impulsiveness scale (BIS)
The BIS is a widely used self-report questionnaire designed to measure individual impulsivity (Patton, Stanford, & Barratt, Reference Patton, Stanford and Barratt1995). This scale consists of 30 items rated on a 4-point Likert scale and assesses three related yet distinct subdimensions of impulsivity: Attentional Impulsiveness, Motor Impulsiveness, and Non-planning Impulsiveness. These subscales respectively reflect impulsive traits in rapid cognitive decision-making, tendency toward unpremeditated actions, and lack of future planning. Each subscale contains 10 items, with raw scores ranging from 10 to 50. Scores are converted to standardized scores ranging from 0 to 100 using the formula: ((sum of raw scores −10) ÷ 40) × 100. The overall BIS score is calculated as the average of the three standardized subscale scores, with higher scores indicating greater impulsivity.
Composite adaptability index
To facilitate the regression analyses and quantify the overall adaptive functioning of participants, a composite Adaptability Index was calculated. Based on the theoretical framework that high adaptability is characterized by high regulation and low reactivity, this index was derived by subtracting the mean standardized score (Z-score) of the maladaptive traits (BIS, SR, and SP) from the standardized score of the adaptive trait (SCS), such that a higher index indicates better psychological adaptation (i.e. higher self-control balanced against lower impulsivity and sensitivity). The calculation formula is as follows:

Image acquisition
Participants completed an 8-minute resting-state fMRI scan on a 3 T SIEMENS PRISMA scanner (Erlangen, Germany). During the scan, they were instructed to keep their eyes open and clear their minds. Functional images were acquired using a gradient echo-planar imaging (EPI) sequence (TR = 2000 ms, TE = 30 ms, FOV = 224 × 224 mm, flip angle = 90°, 62 slices, thickness = 2 mm, slice gap = 0.3 mm, voxel size = 2 × 2 × 2 mm3; 240 volumes). Additionally, high-resolution T1-weighted structural images were acquired using an MPRAGE sequence (TR = 2530 ms, TE = 2.98 ms, FOV = 224 × 256 mm2, resolution matrix = 448 × 512, FA = 7°, 192 slices, thickness = 1.0 mm, inversion time = 1100 ms, voxel size = 0.5 × 0.5 × 1 mm3).
Data preprocessing
The preprocessing of fMRI data was performed utilizing the SPM12 and CONN v20.b toolboxes. The first 10 volumes were discarded to allow for signal equilibrium and participant adaptation. The preprocessing pipeline included the following key steps: (1) slice-timing correction to adjust for acquisition time differences between slices; (2) realignment and unwarping to correct for head motion and geometric distortions caused by magnetic field inhomogeneities; (3) coregistration, which aligned each participant’s high-resolution anatomical image with their mean functional image; (4) spatial normalization, segmentation of anatomical images into gray matter, white matter, and cerebrospinal fluid (CSF), and spatial normalization to the Montreal Neurological Institute (MNI) template space using the Dartel algorithm; and (5) spatial smoothing using a Gaussian kernel with a 6 mm full-width at half-maximum (FWHM).
Following preprocessing, stringent denoising procedures were applied to remove potential confounds. Head motion artifacts were minimized using the Friston 24-parameter model (Friston et al., Reference Friston, Williams, Howard, Frackowiak and Turner1996), which regresses out the six rigid-body motion parameters, their temporal derivatives, and their squared terms. To address large transient motion, scrubbing was performed for time points with framewise displacement (FD) exceeding 0.5 mm; these flagged volumes and their adjacent scans were included as nuisance regressors (Power et al., Reference Power, Barnes, Snyder, Schlaggar and Petersen2012). Physiological noise (e.g. cardiac and respiratory effects) was reduced using the anatomical component-based noise correction (aCompCor) method, which extracted the top five principal components from the eroded white matter and CSF masks (Muschelli et al., Reference Muschelli, Nebel, Caffo, Barber, Pekar and Mostofsky2014). Finally, the data underwent linear detrending to remove signal drift and temporal band-pass filtering (0.008–0.09 Hz) to isolate low-frequency fluctuations of interest.
Statistical analysis
Latent profile analysis (LPA)
To identify distinct behavioral phenotypes, Latent Profile Analysis (LPA) was conducted using R 4.5.1. The standardized scores of BIS, SCS, SR, and SP at baseline were used as indicators. Models with 1 to 4 profiles were estimated. The optimal number of profiles was determined based on model fit indices – including Akaike Information Criterion (AIC), Bayesian Information Criterion (BIC), and sample-size adjusted BIC (SABIC) – as well as entropy (classification accuracy) and theoretical interpretability.
Network-based statistic (NBS) analysis
To identify neural circuits associated with adaptability, we employed the Network-Based Statistic (NBS) approach (Zalesky, Fornito, & Bullmore, Reference Zalesky, Fornito and Bullmore2010), a non-parametric method that controls for the family-wise error (FWE) rate at the network level. Given the identification of distinct ‘Adaptive’ and ‘Maladaptive’ profiles via LPA, we contrasted these two extreme groups to isolate specific neural markers. Two-sample t-tests were performed on each edge of the 90 × 90 (AAL90) FC matrix. A primary threshold (t > 3.1) was applied to identify suprathreshold links. Identified links were then examined for connected components (subnetworks). The significance of the size of each component was estimated via permutation testing (5000 permutations). Components with a corrected p-value <0.05 were considered significant.
Prediction and hierarchical regression
The predictive validity of the identified neural circuit was tested using R version 4.5. First, mean connectivity strength within the significant NBS-identified circuit was extracted for all participants. Linear regression was used to assess the direct prediction of T2 Adaptability from T1 neural connectivity. Subsequently, Hierarchical Linear Regression was conducted to determine incremental validity. Step 1 included demographic covariates (age) and baseline (T1) Adaptability to control for behavioral stability. Step 2 added the neural predictor (T1 cortico-striatal connectivity). Crucially, to statistically evaluate gender-specific predictive effects, a formal interaction analysis was conducted by introducing a Gender × Connectivity interaction term into the full sample regression model before proceeding to gender-stratified analyses. To visualize incremental effects, partial correlation analyses were performed using residualized scores. Specifically, T2 Adaptability scores were regressed on age and T1 Adaptability, and the resulting residuals (representing ‘adaptive gains’) were correlated with neural connectivity.
Results
Participant characteristics
The BBC sample consisted of 1,229 participants (455 males and 956 females) with a mean (SD) age of 18.77 (1.23) years. The mean (SD) scores were 12.90 (3.76) for SR, 13.86 (4.87) for SP, 59.59 (10.39) for the Self-Control Scale (SCS), and 38.41 (9.88) for the Barratt Impulsiveness Scale (BIS). The BL sample included 432 participants (102 males and 330 females), with mean (SD) scores of 12.17 (4.00) for SR, 13.99 (5.38) for SP, 56.98 (10.59) for SCS, and 39.31 (10.36) for BIS.
Identification and longitudinal validation of baseline behavioral profiles
Correlations and stability of behavioral constructs
To elucidate the structural relationships and temporal stability of the four behavioral constructs (BIS, SCS, SR, SP), we conducted partial correlation analyses controlling for age and gender. The results are summarized in Figure 2, which depicts the cross-sectional associations at baseline (Figure 2a) and the longitudinal stability across the two-year interval (Figure 2b). In the cross-sectional analysis (Figure 2a), SCS exhibited widespread negative associations with other behavioral constructs, showing a robust negative correlation with BIS (r = −0.66) and moderate negative associations with both SR (r = −0.30) and SP (r = −0.22; all ps < 0.001). Additionally, BIS was negatively correlated with SR (r = −0.17, p < 0.001), while the SR and SP showed a weak positive correlation (r = 0.06, p < 0.05). Longitudinally (Figure 2b), all behavioral traits demonstrated moderate-to-strong autoregressive stability over the 2-year period. SP displayed the highest temporal stability (r = 0.66), followed by SR (r = 0.59), BIS (r = 0.49), and SCS (r = 0.48; all ps < 0.001). Notably, the structural relationship between SCS and BIS remained consistent across time (T1: r = −0.54; T2: r = −0.62; all ps < 0.001), confirming the stability of this behavioral phenotype.
Partial correlation matrices depicting cross-sectional and longitudinal associations among behavioral traits. (a) Cross-sectional relationships among Impulsivity (BIS), Self-Control (SCS), Sensitivity to Reward (SR), and Sensitivity to Punishment (SP) within the baseline sample. Values represent partial correlation coefficients controlling for age and sex. (b) Longitudinal associations illustrating the temporal stability and interrelationships of behavioral measures between Time 1 (BIS1/SCS1/SR1/SP1) and Time 2 (BIS2/SCS2/SR2/SP2). The color gradient indicates the strength and direction of the correlation, with orange denoting positive associations and blue denoting negative associations. Asterisks indicate statistical significance levels: *p < 0.05, **p < 0.01, ***p < 0.001.

Figure 2. Long description
Panel A shows a 3 by 3 lower triangular matrix for cross-sectional data. The y-axis lists S C S, S R, and S P. The x-axis lists B I S, S C S, and S R.
* Row 1: S C S and B I S have a strong negative correlation of minus 0.66 triple asterisk.
* Row 2: S R and B I S is minus 0.17 triple asterisk; S R and S C S is minus 0.3 triple asterisk.
* Row 3: S P and B I S is 0.05; S P and S C S is minus 0.22 triple asterisk; S P and S R is 0.06 asterisk.
Panel B shows a 7 by 7 lower triangular matrix for longitudinal data between Time 1 and Time 2. The y-axis lists S C S 1, S R 1, S P 1, B I S 2, S C S 2, S R 2, and S P 2. The x-axis lists B I S 1, S C S 1, S R 1, S P 1, B I S 2, S C S 2, and S R 2.
* Diagonal stability correlations: B I S 2 and B I S 1 is 0.49 triple asterisk; S C S 2 and S C S 1 is 0.48 triple asterisk; S R 2 and S R 1 is 0.59 triple asterisk; S P 2 and S P 1 is 0.66 triple asterisk.
* Notable cross-lagged correlations: S C S 2 and B I S 1 is 0.24 triple asterisk; S P 2 and S R 1 is minus 0.2 triple asterisk; S C S 2 and B I S 2 is minus 0.62 triple asterisk.
Both panels include a legend on the right titled Partial Correlation with a color gradient from dark blue (minus 1.0) through white (0.0) to dark orange (1.0).
Identification of latent behavioral profiles
Given that variable-centered correlations cannot fully capture how these traits co-occur within individuals, a person-centered Latent Profile Analysis (LPA) was employed to identify distinct subgroups based on their combination patterns. To determine the optimal solution, we estimated a series of models ranging from one to four classes. Detailed information regarding model fit indices and the selection procedure is provided in Supplementary Material S1. Models ranging from one to four profiles were estimated. Although information criteria decreased with additional profiles, the 3-profile solution offered the best balance between model fit and parsimony (AIC = 13113, BIC = 13205, SABIC = 13148, Entropy = 0.69). The 4-profile solution was rejected due to diminishing returns in fit improvement, lower classification accuracy (Entropy = 0.668), and the emergence of a numerically small and unstable subgroup. Consequently, the 3-profile model was retained for further analysis (see Supplementary Material S1 for full details).
Profile characterization and longitudinal validation
The characterization of the identified latent profiles and their longitudinal predictive validity are illustrated in Figure 3. Based on the standardized scores of the four behavioral indicators at baseline (T1), three distinct behavioral profiles were elucidated (Figure 3a). The first profile (Class 1, labeled ‘Moderate Group,’ n = 615, 50.0% of the sample, blue line) displayed average levels across all four dimensions, with Z-scores fluctuating around zero, representing the typical behavioral makeup of the population. In stark contrast, the second profile (Class 2, labeled ‘Adaptive Group,’ n = 168, 13.7%, red line) exhibited a regulatory-dominant pattern, defined by exceptionally high SCS and low BIS, alongside the lowest levels of SR and SP compared to the other two groups, indicating strong self-regulatory capabilities. The third profile (Class 3, labeled ‘Maladaptive Group,’ n = 446, 36.3%, green line) comprised individuals characterized by elevated BIS and high SR and SP, coupled with significantly suppressed self-control.
Characterization and longitudinal validation of latent profiles. Note: (a) Standardized mean scores of the four behavioral indicators (BIS, SCS, SP, SR) for the three identified latent profiles at T1. Error bars represent standard errors. (b) Longitudinal validation showing raw scores of behavioral outcomes at T2 across the three T1-determined profiles. Significance levels for pairwise comparisons were adjusted using the Bonferroni correction. Abbreviations: BIS, ‘Barratt impulsiveness scale’; SCS, ‘self-control scale’; SP, ‘sensitivity to punishment’; SR, ‘sensitivity to reward’; Mod., ‘moderate group’; Adapt., ‘adaptive group’; Mal., ‘maladaptive group’. *p < 0.05, ***p < 0.001, ns = not significant.

Figure 3. Long description
The figure consists of two panels, A and B.
Panel A is a line graph titled Latent Profiles. The y-axis represents Standardized Mean Scores from negative 1 to positive 1. The x-axis lists Profile Indicators: B I S, S C S, S P, and S R. Three groups are plotted:
- Moderate Group (blue line): Remains near the zero baseline across all indicators.
- Adaptive Group (red line): Shows a sharp trough at B I S, a peak above 1 at S C S, a trough at S P, and a slight rise at S R.
- Maladaptive Group (green line): Shows a peak at B I S, a deep trough at S C S, and peaks at S P and S R.
Panel B consists of four box plots showing Raw Scores at T 2 for the three profiles determined at T 1. Each plot compares Mod., Adapt., and Mal. groups.
- B I S 2: Mal. group has the highest scores, followed by Mod., then Adapt. All pairwise comparisons are significant at p < 0.001.
- S C S 2: Adapt. group has the highest scores, followed by Mod., then Mal. All pairwise comparisons are significant at p < 0.001.
- S P 2: Mal. group has the highest scores, followed by Mod., then Adapt. All pairwise comparisons are significant at p < 0.001.
- S R 2: Mal. group has the highest scores, followed by Mod., then Adapt. Comparisons between Mod. and Mal. are significant at p < 0.05, and Adapt. vs Mal. at p < 0.001. The comparison between Mod. and Adapt. is not significant (n s).
To validate the stability and predictive validity of these T1-identified profiles, we examined group differences in behavioral outcomes at the two-year follow-up (Figure 3b). The analysis revealed that the baseline profiles significantly predicted distinct behavioral trajectories at T2. For BIS2, SCS2, and SP2, the groups exhibited a significant gradient effect consistent with their baseline definitions: the Maladaptive Group showed the poorest outcomes (highest BIS2/SP2, lowest SCS2), followed by the Moderate Group, with the Adaptive Group showing the most optimal outcomes (all pairwise comparisons ps < 0.001). Regarding SR2, both the Maladaptive and Moderate groups scored significantly higher than the Adaptive Group (ps < 0.05), although the difference between the Maladaptive and Moderate groups was not statistically significant. Collectively, these findings confirm that the identified baseline latent profiles capture specific trait configurations that robustly prospectively predict future psychological adaptation.
Neural substrates of behavioral adaptability
Identification of the circuit associated with adaptability
To elucidate the neural substrates underlying the distinct behavioral phenotypes identified in the previous section, we conducted a whole-brain functional connectivity analysis. Given that the ‘Adaptive’ and ‘Maladaptive’ profiles represent the opposing poles of the regulatory spectrum, our primary aim was to isolate the specific neural signatures that differentiate successful adaptation from vulnerability. Therefore, we employed the Network-Based Statistic (NBS) approach to identify circuits exhibiting significant connectivity differences between these two distinct groups. The NBS analysis identified a single connected circuit that exhibited significantly stronger functional connectivity in the Adaptive Group compared to the Maladaptive Group (p = 0.0392, FWE-corrected) (Figure 4a).
Identification and prospective predictive validity of the cortico-striatal circuit. (a) Topological organization of the significant subnetwork identified via Network-Based Statistic (NBS) analysis, which comprises edges and nodes exhibiting significantly stronger functional connectivity in the High-Adaptability group compared to the Low-Adaptability group at baseline (p < 0.05, FWE-corrected). (b) Longitudinal prediction of future adaptability. The scatter plot illustrates the linear regression analysis predicting the Adaptability Index at the two-year follow-up (T2) based on the mean functional connectivity strength of the NBS-identified circuit at baseline (T1). Abbreviations: SFGmed, ‘medial superior frontal gyrus’; ACG, ‘anterior cingulate gyrus’; DCG, ‘dorsal cingulate gyrus’; PUT, ‘putamen’; PAL, ‘pallidum’; ITG, ‘inferior temporal gyrus’.

Figure 4. Long description
Panel A displays four transparent 3D brain models showing a subnetwork of nodes and edges. The Sagittal View (Left) shows nodes labeled S F G med dot L, A C G dot L, and D C G dot L. The Sagittal View (Right) shows S F G med dot R, P U T dot R, P A L dot R, D C G dot R, and I T G dot R. The Coronal View (Front) and Axial View (Top) show the bilateral distribution of these nodes. Thick tan lines represent functional connectivity edges, with the thickest connection appearing between P U T dot R and I T G dot R. Panel B is a scatter plot titled Cortico-Striatal Connectivity Strength yields Adaptability (T 2) with statistics b equals 1.296 and p equals 0.045. The x-axis is Mean Connectivity of the Identified Circuit (T 1) ranging from minus 0.2 to 0.2. The y-axis is Adaptability Index (T 2) ranging from minus 2.5 to 5.0. A dense cluster of gray data points is overlaid with a red linear regression line showing a positive correlation, surrounded by a light red shaded confidence interval.
Anatomically, this circuit is organized as a cortico-striatal network, primarily anchored in the medial prefrontal cortex (SFGmed) and cingulate cortex (Anterior and Dorsal Cingulate Gyri, ACG/DCG), with dense projections to striatal regions (Putamen, Pallidum) and the inferior temporal gyrus (ITG). The enhanced connectivity within this cortico-striatal circuit in the Adaptive Group suggests a more integrated and efficient communication pathway between top-down regulatory control centers (PFC/Cingulate) and reward-processing hubs (Striatum), which may serve as the neural foundation for their superior behavioral regulation.
Direct prediction of future adaptability
Having identified the cortico-striatal circuit based on extreme group differences, we next sought to evaluate its predictive validity across the full spectrum of the sample. To this end, we extracted the mean functional connectivity strength of this circuit at T1 for all participants and examined its association with the composite Adaptability Index at T2. As illustrated in Figure 4b, the linear regression analysis revealed a significant positive prediction (b = 1.296, t = 2.01, p = 0.045). This result indicates that stronger baseline integration within the cortico-striatal circuit prospectively predicts better adaptive functioning 2 years later.
Incremental predictive validity and gender dissociation
To rule out demographic confounds and account for baseline behavioral stability, we conducted a hierarchical regression analysis. Specifically, to rigorously test whether the predictive value of the cortico-striatal circuit differs by gender, we introduced a formal Gender × Connectivity interaction term into the full-sample model. After controlling for age, baseline adaptability, and the main effects of gender and connectivity, this interaction revealed a statistically significant incremental effect (∆ R2 = 0.0057, p = 0.0247, b = −2.35). Although quantitatively small, this variance represents a robust prospective association that holds above and beyond the massive autoregressive stability of behavioral traits.
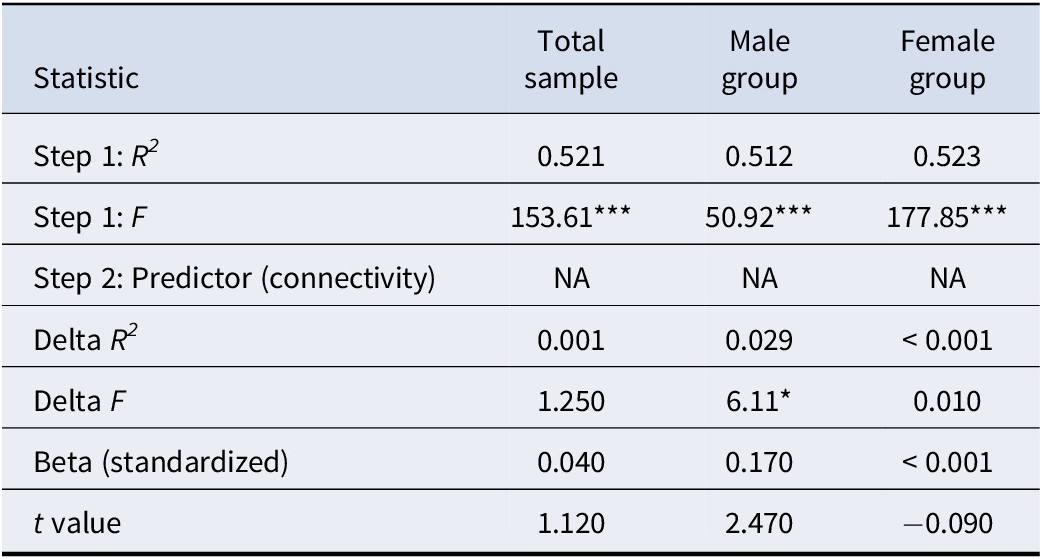
Therefore, to unpack this significant interaction and evaluate the specific predictive value within each gender, we subsequently performed gender-stratified hierarchical linear regressions (Table 1). In Step 1, controlling for age and baseline (Time 1) adaptability accounted for a substantial portion of the variance in Time 2 adaptability for both genders (R2 range: 0.512–0.523, all ps < 0.001), reflecting the high temporal stability of these traits. In Step 2, the inclusion of cortico-striatal connectivity strength revealed a striking gender-specific effect. In the Male Group, the neural predictor added significant incremental variance to the model (∆R2 = 0.029, ∆F(1, 96) = 6.11, p = 0.015). The standardized regression coefficient was significant and positive (Beta = 0.170, t = 2.470, p = 0.015), indicating that males with stronger cortico-striatal connectivity at baseline exhibited greater improvements in adaptive functioning over the two-year interval than would be predicted by their initial behavioral levels alone. In contrast, no such incremental effect was observed in the Female Group (∆R2 < 0.001, p > 0.05), nor in the Total Sample when genders were combined (∆R2 = 0.001, p > 0.05).
Hierarchical regression analysis examining the cortico-striatal circuit on future adaptability

Table 1. Long description
The table consists of four columns: Statistic, Total sample, Male group, and Female group.
Step 1 (Control variables: age and baseline adaptability):
- R super 2: Total 0.521, Male 0.512, Female 0.523.
- F: Total 153.61, Male 50.92, Female 177.85 (all significant at p < 0.001).
Step 2 (Predictor: connectivity):
- Delta R super 2: Total 0.001, Male 0.029, Female < 0.001.
- Delta F: Total 1.250, Male 6.11 (significant at p < 0.05), Female 0.010.
- Beta (standardized): Total 0.040, Male 0.170, Female < 0.001.
- t value: Total 1.120, Male 2.470, Female -0.090.
Note: Connectivity is a significant predictor only in the male group.
Note: Step 1 included age and baseline (T1) adaptability scores as control variables. Step 2 introduced the mean functional connectivity strength of the identified cortico-striatal circuit. Beta represents the standardized regression coefficient for the connectivity predictor in the final model. *p < 0.05, ***p < 0.001.
Gender-specific neural prediction of future adaptability gains
Visualizing the incremental predictive value of the cortico-striatal circuit is challenged by the massive autoregressive stability of behavioral traits (∆R2 > 0.50). To explicitly disentangle the neural contribution from this baseline stability, we plotted partial correlations using residualized scores (Figure 5). The Y-axis represents T2 adaptability residuals after regressing out age and T1 baseline scores. Consequently, positive values denote an ‘incremental gain’ – indicating that an individual’s observed T2 adaptability exceeded predictions based solely on their past behavior.
Sex-specific incremental predictive validity of the cortico-striatal circuit. Partial regression plots illustrate the relationship between the functional connectivity of the identified cortico-striatal circuit at baseline (T1) and the future adaptability index (T2), after controlling for baseline adaptability and age. The x- and y-axes represent the residuals of the respective variables, isolating the unique variance attributable to the neural predictor. Shaded areas represent 95% confidence intervals.

Figure 5. Long description
Two side-by-side scatter plots with regression lines and shaded 95 percent confidence intervals. Both plots share identical axes. The x-axis is labeled Cortico-Striatal Connectivity (Residuals) ranging from minus 0.2 to 0.3. The y-axis is labeled Future Adaptability Index (Residuals) ranging from minus 3 to 4.
* Left Panel (Male): Features blue data points. A black regression line shows a positive linear increase. Statistical text in the top-left corner reads R equals 0.24, p equals 0.014.
* Right Panel (Female): Features red data points. A black regression line is nearly horizontal, indicating no correlation. Statistical text in the top-left corner reads R equals minus 0.0052, p equals 0.926.
The visualization reveals a striking gender dissociation, supported by the formal interaction test. In the Male Group (Figure 5, Left), cortico-striatal connectivity strength showed a significant positive correlation with these adaptability residuals (r partial = 0.24, p = 0.014). This visually confirms the hierarchical regression finding (∆R2 = 0.029): males with stronger cortico-striatal integration at baseline achieved greater adaptive gains over the two-year interval than their peers with similar initial behavioral levels. In contrast, the Female Group (Figure 5, Right) displayed a near-flat regression line (r partial = −0.01, p = 0.926), indicating that variations in this neural circuit were not associated with developmental deviations from the baseline prediction in females.
Discussion
The present study integrated a person-centered behavioral approach with longitudinal network neuroscience to elucidate the bio-behavioral mechanisms of psychological adaptability. By characterizing latent profiles based on the interplay of impulsivity, sensitivity to reward/punishment, and self-control, we validated three distinct profiles – Adaptive, Moderate, and Maladaptive – that reflect the theoretical tension between cognitive regulation and emotional reactivity. Crucially, we mapped the neural signature of high adaptability to a specific cortico-striatal circuit, characterized by enhanced functional integration between top-down control hubs (such as medial prefrontal and anterior cingulate cortices) and subcortical reward-processing regions (including the putamen and pallidum). Beyond identifying this cross-sectional marker, our longitudinal analyses revealed a striking gender dissociation: the baseline functional integrity of this circuit provided incremental validity in predicting future behavioral adaptation specifically in males, a sex-specific longitudinal association that was statistically confirmed via formal interaction testing.
Our LPA results provide robust empirical support for the ‘Dual Systems’ or ‘Imbalance’ models of self-regulation (Heatherton & Wagner, Reference Heatherton and Wagner2011; Hofmann, Friese, & Strack, Reference Hofmann, Friese and Strack2009), while extending these theories through a person-centered lens. The Maladaptive Group exemplifies a ‘regulatory mismatch,’ where intense bottom-up drives overwhelm weakened top-down control, creating a ‘double jeopardy’ risk for externalizing behaviors and maladaptation (Wills, Pokhrel, Morehouse, & Fenster, Reference Wills, Pokhrel, Morehouse and Fenster2011). In stark contrast, the Adaptive Group’s ‘Regulatory-Dominant’ profile aligns with the ‘buffering hypothesis,’ suggesting robust self-control shields against impulsive action (Duckworth & Steinberg, Reference Duckworth and Steinberg2015). Methodologically, the identification of these distinct profiles confirms that these personality traits do not operate in isolation; rather, they function as an integrated behavioral system. Longitudinally, these integrated baseline configurations effectively forecast subsequent adaptation, serving as foundational capital for early adult transitions (Moffitt et al., Reference Moffitt, Arseneault, Belsky, Dickson, Hancox, Harrington, Houts, Poulton, Roberts, Ross, Sears, Thomson and Caspi2011).
A key finding of this study is the identification of a specific cortico-striatal circuit – anchored in the medial superior frontal gyrus (SFGmed), anterior cingulate cortex (ACG), and striatum (Putamen/Pallidum) – as the neural signature of the Adaptive profile. Stronger functional connectivity within this circuit in the Adaptive group likely reflects efficient top-down regulation. The medial PFC and ACG are central to conflict monitoring and inhibitory control (Botvinick, Cohen, & Carter, Reference Botvinick, Cohen and Carter2004; Ridderinkhof, Ullsperger, Crone, & Nieuwenhuis, Reference Ridderinkhof, Ullsperger, Crone and Nieuwenhuis2004), while the striatum is the hub for reward processing and motor initiation (Haber & Knutson, Reference Haber and Knutson2010). Enhanced coupling between these regions suggests that adaptive individuals possess an intrinsic functional architecture where the prefrontal cortex is more robustly integrated with striatal activity, a network pattern consistently associated with lower impulsive reactions to immediate rewards or punishments (Hare, Camerer, & Rangel, Reference Hare, Camerer and Rangel2009). Conversely, the weaker connectivity observed in the Maladaptive group implies a functional ‘uncoupling,’ where subcortical regions are less functionally integrated with cortical control networks, a pattern that corresponds to the behavioral profile of high impulsivity and low self-control (Heatherton & Wagner, Reference Heatherton and Wagner2011).
Beyond characterizing cross-sectional signatures, a pivotal contribution of this study is establishing the prospective predictive validity of the identified cortico-striatal circuit. In the total sample, stronger functional connectivity within the identified cortico-striatal circuit at baseline significantly predicted higher adaptability levels 2 years later. This finding supports the ‘brain-as-predictor’ framework, which posits that neural measures can capture latent biological capacities – such as the potential for regulation – that are not yet manifest in observable behavior (Berkman & Falk, Reference Berkman and Falk2013). From a network perspective, the cortico-striatal pathway is a primary correlate of value-based learning and cognitive control updating (O’doherty, Reference O’doherty2004). A well-integrated circuit at baseline may act as a ‘neurobiological scaffold,’ allowing individuals to more efficiently update their regulatory strategies in response to new environmental feedback over the 2-year interval. Thus, while behavioral questionnaires capture past performance, the functional integrity of this circuit likely indexes the capacity for future behavioral adjustment, serving as a stable neural predictor of long-term resilience in early adulthood (Gabrieli, Ghosh, & Whitfield-Gabrieli, Reference Gabrieli, Ghosh and Whitfield-Gabrieli2015).
However, formal interaction and hierarchical regression analyses revealed a striking gender dissociation: the cortico-striatal circuit provided incremental predictive validity specifically in males. Although this incremental variance is quantitatively small (∆R2 = 0.029), detecting any meaningful neural signal that prospectively predicts subtle behavioral shifts above and beyond massive autoregressive trait stability (>50% of the variance) underscores the predictor’s unique sensitivity. This dissociation likely stems from sexually dimorphic neurodevelopmental timelines. Because male cortico-striatal maturation follows a significantly more protracted trajectory (Lenroot & Giedd, Reference Lenroot and Giedd2010; Raznahan et al., Reference Raznahan, Lee, Stidd, Long, Greenstein, Clasen, Addington, Gogtay, Rapoport and Giedd2010), this circuit likely remains sensitive to environmental demands during early adulthood, acting as a ‘neurobiological scaffold’ for subsequent adaptation. Conversely, female cortico-striatal networks typically mature earlier and may have already plateaued by this age (Lim, Han, Uhlhaas, & Kaiser, Reference Lim, Han, Uhlhaas and Kaiser2015). Alternatively, female adaptation may rely more heavily on distinct substrates, such as social–cognitive networks, rather than intrinsic cortico-striatal regulation (McRae et al., Reference McRae, Ochsner, Mauss, Gabrieli and Gross2008; Whittle, Yücel, Yap, & Allen, Reference Whittle, Yücel, Yap and Allen2011). Given this male-specific neurodevelopmental window, identifying this biomarker could clinically inform early screening for regulatory failure and guide targeted interventions – such as neuromodulation or cognitive training – to actively scaffold psychological resilience.
Several limitations should be noted. First, while the sample size was large, the participants were exclusively university students, limiting generalizability to clinical populations or different age groups. Future validation in broader community or clinical cohorts is thus warranted. Second, while we controlled for baseline behavior, resting-state fMRI provides only a static measure of intrinsic connectivity. Integrating task-based fMRI or neuromodulation (e.g. TMS) would better elucidate dynamic circuit recruitment and causal mechanisms. For instance, future longitudinal studies could incorporate task-based fMRI paradigms (e.g. Go/No-Go or Stop-Signal Tasks) to explicitly verify the dynamic causal role of this cortico-striatal circuit in active reward and punishment regulation. Third, our behavioral profiles were derived exclusively from self-report measures. Although we utilized validated scales and robust latent modeling, these instruments are inherently subject to introspective limits and social desirability bias. Incorporating objective behavioral tasks would help mitigate these biases and enhance ecological validity.
Conclusion
In summary, this study identifies a ‘Regulatory-Dominant’ profile characterizing psychological adaptability, anchored in a specific cortico-striatal circuit. Crucially, the functional integrity of this circuit serves as a prospective neural predictor, providing incremental validity in predicting future behavioral adaptation beyond baseline behavioral stability – an effect that was statistically confirmed to be moderated by gender via formal interaction testing. These findings highlight cortico-striatal integration as a critical neural scaffold predictive of the maintenance and potential adaptation of self-regulation capacities, offering a bio-behavioral target for fostering resilience during the critical transition of early adulthood.
Supplementary material
The supplementary material for this article can be found at http://doi.org/10.1017/S0033291726105352.
Acknowledgements
We extend our sincere gratitude to the research team and graduate students at Southwest University for their dedicated efforts in the acquisition of the large-scale resting-state MRI and behavioral data. We are also deeply thankful to the undergraduate participants for their time, cooperation, and sustained commitment to this research. Their contribution was essential to the successful completion of this study.
Author contribution
Conceptualization: J.H., H.Z., X.L., T.F., Q.H.; Data curation: Q.H.; Formal analysis: J.H.; Funding acquisition: Q.H.; Methodology: J.H., H.Z., J.Q., L.C., H.C., Q.H.; Writing-original draft: J.H.; Writing-review & editing: J.H., O.T., Q.H.
Funding statement
This work was supported by research grants from the National Natural Science Foundation of China (31972906), Fundamental Research Funds for the Central Universities (SWU2209235), and the Open Research Fund of the Key Lab of Brain-Machine Intelligence for Information Behavor- Ministry of Education (41004400/035).
Competing interests
The authors declare none.
Ethical standard
The authors assert that all procedures contributing to this work comply with the ethical standards of the relevant national and institutional committees on human experimentation and with the Helsinki Declaration of 1975, as revised in 2008.




 Open access

