1. Introduction
Zircon is a very robust mineral whose U–Pb age, Lu–Hf isotope signature and trace element distribution pattern can survive repeated cycles of erosion, sedimentary transport, diagenesis, metamorphic recrystallization and even crustal anatexis (e.g. Williams, Reference Williams2001; Barr et al. Reference Barr, Davis, Kamo and White2003; Hawkesworth & Kemp, Reference Hawkesworth and Kemp2006; Røhr, Andersen & Dypvik, Reference Røhr, Andersen and Dypvik2008; Kurhila, Andersen & Rämö, Reference Kurhila, Andersen and Rämö2010; Røhr et al. Reference Røhr, Andersen, Dypvik and Embry2010; Andersen et al. Reference Andersen, Sayeed, Gabrielsen and Olaussen2011). It is therefore commonly assumed that detrital zircon grains in a clastic sediment will retain a memory of the age and composition of the (generally) granitic intrusions in which the zircon originally formed, and the use of radiogenic isotope data and trace element distribution patterns from detrital zircon has become a popular tool in provenance analysis (e.g. Fedo, Sircombe & Rainbird, Reference Fedo, Sircombe, Rainbird, Hanchar and Hoskin2003). There is, however, also evidence that diagenetic processes in a clastic sediment may cause loss of radiogenic lead from zircon (Willner et al. Reference Willner, Sindern, Metzger, Ermolaeva, Kramm, Puchkov and Kronz2003), but it is unlikely that this will also affect the more robust Lu–Hf isotope system (e.g. Amelin, Lee & Halliday, Reference Amelin, Lee and Halliday2000). Isotope data from detrital zircons have been used successfully in studies of first-order global processes such as the extraction, growth and preservation of continental crust (e.g. Belousova et al. Reference Belousova, Kostitsyn, Griffin, Begg, O'Reilly and Pearson2010; Condie et al. Reference Condie, Bickford, Aster, Belousova and Scholl2011; Voice, Kowalewski & Eriksson, Reference Voice, Kowalewski and Eriksson2011; Lancaster et al. Reference Lancaster, Storey, Hawkesworth and Dhuime2011), as well as in regional studies where the purpose is to identify the source of material in a given sedimentary sequence (e.g. Lahtinen, Huhma & Kousa, Reference Lahtinen, Huhma and Kousa2002; Veevers et al. Reference Veevers, Belousova, Saeed, Sircombe, Cooper and Read2006).
The age and composition of detrital zircon grains transported out of a first-generation continental source terrane reflect the age and initial Hf isotope character of the igneous rocks (mainly granite) exposed to erosion. In sedimentary provenance studies, sufficiently large numbers (Vermeesch, Reference Vermeesch2004; Andersen, Reference Andersen2005) of analyses of individual crystals are pooled to produce a sample-specific distribution pattern of ages and initial Hf isotopic compositions. This distribution pattern is assumed to reflect the ‘event signature’ of the (in most cases geologically complex) environment in which the zircons formed (aka the protosource of the zircons). To be useful in provenance analysis, different protosource terranes must show specific patterns of age, rock type and Hf isotopic compositions, which are inherited by the detrital zircons. This justifies a qualitative approach to provenance analysis, which has the identification of different sources as its main purpose (e.g. Fedo, Sircombe & Rainbird, Reference Fedo, Sircombe, Rainbird, Hanchar and Hoskin2003). If the relative abundance of different age and isotopic fractions in a set of analytical data can be assumed to reflect the corresponding distribution of fractions in the sediment, the relative importance of contributions of different protosources to the sedimentary basin can in principle be estimated. This is the quantitative approach of Fedo, Sircombe & Rainbird (Reference Fedo, Sircombe, Rainbird, Hanchar and Hoskin2003). Furthermore, since a zircon must necessarily have formed before it can be transported and deposited in a sedimentary basin, the age of the youngest significant zircon age fraction in a detrital zircon population is commonly used as a maximum limit for the age of deposition (e.g. Knudsen et al. Reference Knudsen, Andersen, Whitehouse and Vestin1997; Bingen et al. Reference Bingen, Birkeland, Nordgulen and Sigmond2001, Reference Bingen, Griffin, Torsvik and Saeed2005; Williams, Reference Williams2001; Fedo, Sircombe & Rainbird, Reference Fedo, Sircombe, Rainbird, Hanchar and Hoskin2003).
Andersen (Reference Andersen2005) demonstrated that a quantitative approach to detrital zircon data is generally unjustified. In this paper, new U–Pb and Lu–Hf isotope data from sandstones of the Eriksfjord Formation from the Mesoproterozoic Gardar Rift in SW Greenland are presented. These data illustrate that the qualitative approach to the interpretation of detrital zircon data may also be problematic, and that a combination of long-range transport and reworking of sediment, post-depositional alteration and parallel evolution of continents set severe limits on the applicability of the method to depositional chronology and sedimentary provenance analysis.
2. Geological setting
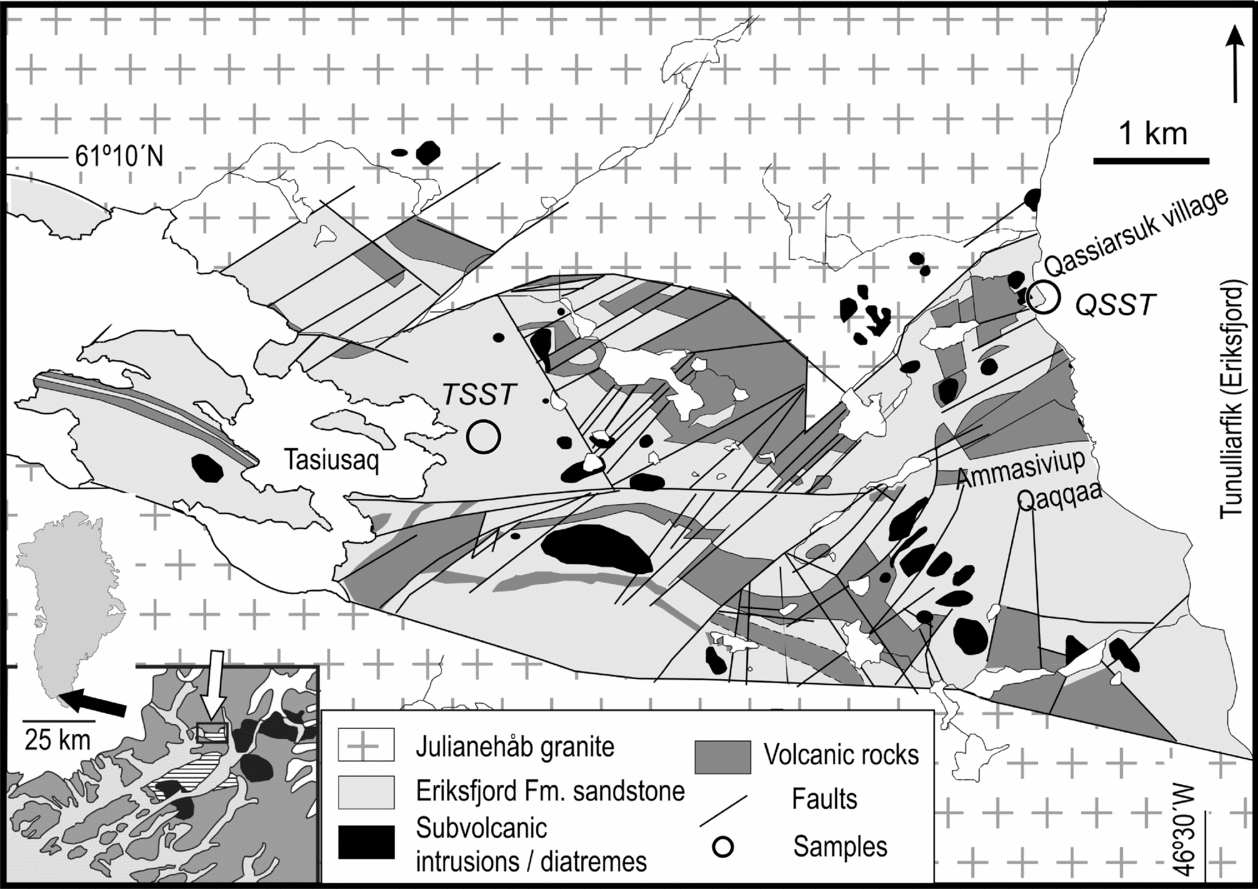
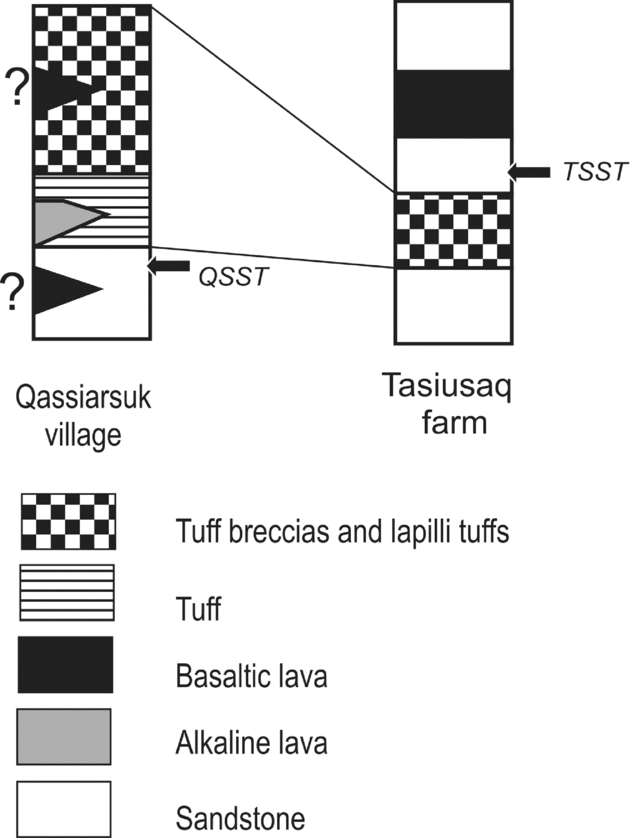
The Gardar Rift is a Mesoproterozoic continental rift cutting Palaeoproterozoic rocks of the Ketilidian orogen in southernmost Greenland (Emeleus & Upton, Reference Emeleus, Upton, Escher and Watt1976; Kalsbeek, Larsen & Bondam, Reference Kalsbeek, Larsen and Bondam1990). The Eriksfjord Formation comprises c. 1800 m of continental sandstone and c. 1600 m of volcanic rocks (Poulsen, Reference Poulsen1964; Emeleus & Upton, Reference Emeleus, Upton, Escher and Watt1976; Upton et al. Reference Upton, Emeleus, Heaman, Goodenough and Finch2003) deposited on a basement made up by the 1.80–1.85 Ga Julianehåb I-type granite (Garde et al. Reference Garde, Hamilton, Chadwick, Grocott and McCaffrey2002). The volcanic rocks of the Eriksfjord Formation are mainly basalts (Halama et al. Reference Halama, Marks, Bügmann, Siebel, Wenzel and Markl2003), with minor alkaline pyroclastic rocks and lavas (Stewart, Reference Stewart1970; Emeleus & Upton, Reference Emeleus, Upton, Escher and Watt1976; Andersen, Reference Andersen2008 and references therein). The sandstones sampled for the present study occur within the Qassiarsuk–Tasiusaq graben, which is a subsidiary E–W-trending structure within the NE–SW-trending Gardar Rift, crossing the Narsaq peninsula (Fig. 1). The volcanic and sedimentary strata in this graben compose the lower parts of the Eriksfjord Formation, i.e. the Majût sandstone member and the lower parts of the overlying Mussartût volcanic member with sedimentary interlayers (Poulsen, Reference Poulsen1964). Unlike in the basaltic sequence of the Mussartût type profile, some 10 km SW of Qassiarsuk (Emeleus & Upton, Reference Emeleus, Upton, Escher and Watt1976), the first volcanic rocks in the Qassiarsuk–Tasiusaq graben are alkaline lavas and carbonatite, and melilitic pyroclastic rocks; basalts are interlayered with these at a slightly higher stratigraphic level (Fig. 2). The sandstones are penetrated by diatremes of alkaline silicate and carbonatitic composition, some of which were feeders to identifiable volcanic strata (Andersen, Reference Andersen2008), as well as by numerous mafic dykes belonging to the main Gardar dyke swarm (Upton et al. Reference Upton, Emeleus, Heaman, Goodenough and Finch2003 and references therein).
Simplified geological map of the Qassiarsuk–Tasiusaq graben, Gardar Rift, southwestern Greenland (Andersen, Reference Andersen2008). Post-carbonatite dykes and most minor faults have been left out. (Inset) The Qaqortoq–Narsarsuak region, southwestern Greenland. Key: Dark grey – Palaeoproterozoic granitic basement (Julianehåb granite). Black – Major nepheline syenite intrusions (Ilímaussaq and Igaliko complexes). Horizontal ruling – sandstones and volcanic rocks of the Eriksfjord Formation.

Simplified stratigraphic columns of the Eriksfjord Formation at Qassiarsuk and Tasiusaq, from Andersen (Reference Andersen2008). The question marks in the Qassiarsuk village column refer to the position of an isolated outcrop of pahoehoe basalt of uncertain stratigraphic position.

The sandstones of the Eriksfjord Formation vary in composition from arkose to quartz arenite, and in colour from red to white. Abundant channel cross-bedding and other primary depositional features suggest deposition on floodplains and in shallow lakes within a developing graben system; the sand is thought to have originated from sources within the Julianehåb granite (Poulsen, Reference Poulsen1964).
The age of deposition of the basal Eriksfjord Formation sediments is bracketed by the c. 1.8 Ga crystallization age of the underlying Julianehåb granite (Garde et al. Reference Garde, Hamilton, Chadwick, Grocott and McCaffrey2002) and the age of the oldest igneous rocks of the Gardar Rift. Rift-related magmatism can be divided in ‘Early Gardar’ and ‘Late Gardar’ periods. Most of the large alkaline plutons in the rift formed during the Late Gardar period, lasting from c. 1185 Ma to c. 1144 Ma, whereas the Early Gardar magmatism produced the extrusive rocks of the Eriksfjord Formation, their associated diatremes and subvolcanic rocks, mafic dykes and gabbroic to syenitic intrusions (Upton et al. Reference Upton, Emeleus, Heaman, Goodenough and Finch2003 and references therein). Based on Rb–Sr, Sm–Nd and Pb–Pb whole-rock isochrons, Andersen (Reference Andersen1997) and Passlick et al. (1993) reported ages of c. 1200 Ma for volcanic rocks of the Qassiarsuk complex (belonging to the Mussartût member) and the stratigraphically higher Ulukasik volcanic member, respectively. These relatively young ages are difficult to reconcile with field relationships suggesting that both sandstones and lavas of the Eriksfjord Formation have been intruded by Early Gardar plutons of the Motzfeldt complex (Emeleus & Harry, Reference Emeleus and Harry1970), dated to 1273 ± 6 Ma (U–Pb on zircon, McCreath et al. Reference McCreath, Finch, Simonsen, Donaldson and Armour-Brown2012). The c. 1200 Ma ages for volcanic rocks of the Eriksfjord Formation probably reflect post-magmatic hydrothermal processes rather than primary crystallization (see discussion by Upton et al. Reference Upton, Emeleus, Heaman, Goodenough and Finch2003 and Andersen, Reference Andersen2008).
Sample QSST was taken from a shore exposure near the quay at Qassiarsuk village (Figs 1, 2). The sandstone is a cross-bedded, white, quartz cemented quartz arenite underlying the first alkaline pyroclastic rocks. The existence of angular clasts of sandstone incorporated at the base of the pyroclastic rocks shows that the sandstone was consolidated by the time of the first volcanism. A diatreme consisting of alkaline silicate rocks penetrates the sandstones c. 100 m from the sampling locality. Sample TSST was taken from a quartz arenite overlying the alkaline volcanic rocks east of Tasiusaq farm (Figs 1, 2). The sandstone is similar to the lower strata sampled at Qassiarsuk, but its deposition must postdate the first phase of volcanism in this part of the Gardar Rift.
3. Zircon petrography
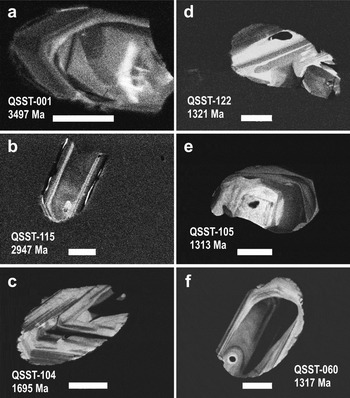
Zircon occurs as an abundant heavy mineral in the sandstone samples. Crystals are well rounded to sub-rounded (Fig. 3), and very commonly show short-wavelength oscillatory zoning, typical of magmatic zircon (e.g. Corfu et al. Reference Corfu, Hanchar, Hoskin, Kinny, Hanchar and Hoskin2003). U–Pb ages of these zircons range from (rare) Meso- to Palaeoarchaean ages to c. 1300 Ma (below). Some of the Archaean zircons occur as distinct xenocrystic cores in Proterozoic grains (Fig. 3a), but in general, Archaean and Palaeoproterozoic zircons have the character of normal, igneous crystals (Fig. 3b, c). In the youngest of the age groups, domains of variable cathodoluminescence intensity interfere with, and partly obscure, the oscillatory zoning, which, however, remains visible (Fig. 3d–f).
SEM–CL images of detrital zircons from the Eriksfjord sandstone. Analysis numbers refer to online Supplementary Table S1 (at http://journals.cambridge.org/geo), and the ages given are 207Pb–206Pb ages. Length of scale bars is 50 μm. (a) Palaeoarchaean core with patchy variations in CL brightness in a CL dark (undated) grain. (b) Intact magmatic zoning in a Mesoarchaean, sub-rounded grain. (c) Intact oscillatory magmatic zoning in Palaeoproterozoic zircon. (d) Young zircon with zones of enhanced CL brightness overprinting oscillatory zoning. (e) Young zircon with increased CL brightness in the lower left part. Traces of oscillatory magmatic zoning are visible within the CL bright area. (f) Young zircon with increased CL brightness along the edges. The limit of the CL bright zone is discordant to the trace of oscillatory magmatic zoning, which can be discerned in both dark and bright areas.

4. Analytical methods
Heavy mineral fractions were isolated from crushed sandstone by Wilfley table washing and heavy liquid separation using sodium polytungstate solution; zircon was retrieved from these impure separates by hand picking. This approach was chosen to avoid experimentally induced bias caused by magnetic separation (Sircombe & Stern, Reference Sircombe and Stern2002; Andersen et al. Reference Andersen, Sayeed, Gabrielsen and Olaussen2011). Randomly chosen grains were embedded in epoxy resin, polished, examined under the binocular microscope and imaged by cathodoluminescence (CL) and backscattered electrons, using a JEOL JSM 6460LV scanning electron microscope (SEM) at the Department of Geosciences, University of Oslo.
U–Pb and Lu–Hf analysis was done by laser ablation inductively coupled plasma source mass spectrometry (LA-ICP-MS), using a Nu Plasma HR multicollector mass spectrometer equipped with a NewWave LUV 213 Nd-YAG laser microprobe. Analytical protocols followed those of Rosa et al. (Reference Rosa, Finch, Andersen and Inverno2009) and Andersen et al. (Reference Andersen, Andersson, Graham, Åberg and Simonsen2009) for U–Pb, and Heinonen, Andersen & Rämö (Reference Heinonen, Andersen and Rämö2010) for Lu–Hf. Standard laser operating conditions were beam diameter 40 μm in aperture imaging mode, pulse frequency 10 Hz and beam energy density c. 0.06 J cm−2 for U–Pb and beam diameter 55 μm (aperture imaging mode), pulse frequency 5 Hz and beam energy density c. 2 J cm−2 for Lu–Hf, in both cases using static ablation. Nu Instruments online software was used for reduction of Lu–Hf data, whereas U–Pb raw data were reduced using an in-house interactive spreadsheet program built on Microsoft Excel 2003. In both methods, isotopically homogeneous parts of the time-resolved signal were interactively selected for integration.
During the period these samples were analysed, repeated analyses of the Mud Tank zircon yielded 176Hf/177Hf = 0.282509 ± 44, n = 831, and Temora-2 0.282679 ± 61, n = 460; the latter (± 2 epsilon units) is accepted as a conservative estimate of the precision of the method. The decay constant of 176Lu of Söderlund et al. (Reference Söderlund, Patchett, Vervoort and Isachsen2004), CHUR (chondritic uniform reservoir) parameters of Bouvier, Vervoort & Patchett (Reference Bouvier, Vervoort and Patchett2008) and depleted mantle parameters of Griffin et al. (Reference Griffin, Pearson, Belousova, Jackson, Van Achterbergh, O'Reilly and Shee2000), modified to the CHUR and λ values, were used. Geochronological calculations and plotting was done using Isoplot 3.57 (Ludwig, Reference Ludwig2003).
Trace elements in zircon were analysed by LA-ICP-MS, using an Agilent 7500 quadrupole ICP-MS with a NewWave LUV213 laser microprobe at the Department of Geology, University of Helsinki, Finland. The NIST SRM610 silicate glass was used as an external standard, and 28Si as an internal standard. The laser beam diameter was 80–100 μm, and the laser energy setting was adjusted to get sufficiently high counts on standards and unknowns. A fast-scanning protocol was applied, measuring masses from 28 to 238. Raw data were reduced to concentrations offline, using an interactive routine written in Excel 2003/VBA. The GJ-1 reference zircon (Liu et al. Reference Liu, Ju, Zong, Gao, Gao, Xu and Chen2010) was analysed as an unknown as a monitor of analytical quality. A summary of analyses of GJ-1 made over a two-year period (average, 2 standard deviations, 5th and 95th percentiles) is given together with data for unknowns in the online Supplementary Material (Supplementary Table S3 at http://journals.cambridge.org/geo). For U, Y, Ce and heavy rare earth elements (HREEs) (Gd to Lu) 2RSD uncertainty is less than 30%. The higher uncertainty for the more abundant Hf is probably due to heterogeneity (zoning) in the Hf/Zr ratio of the crystal. The values reported for the low-concentration elements La and Pr should be regarded as semiquantitative. In general, the values of individual trace elements reproduce those published by Liu et al. (Reference Liu, Ju, Zong, Gao, Gao, Xu and Chen2010), with the exception of Pb, La, Pr and Ti, where the new analyses give significantly (?) higher concentrations.
Analytical data are given in the online Supplementary Material at http://journals.cambridge.org/geo.
5. Results
5.a. U–Pb dating
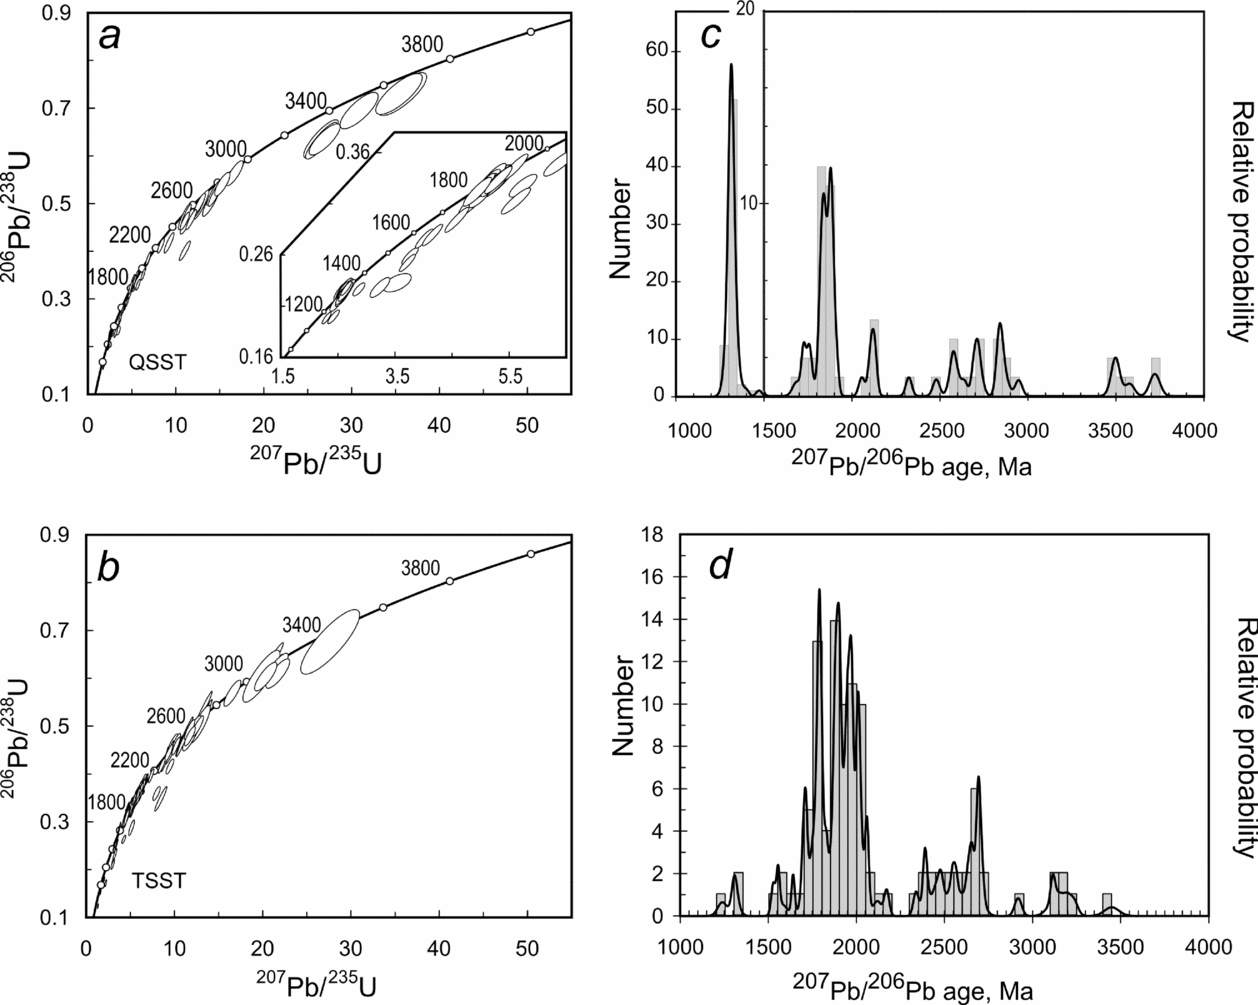
Detrital zircon crystals in both of the sandstone samples show large ranges of U–Pb ages, from near the presumed age of deposition to Meso- to Palaeoarchaean (Fig. 4, online Supplementary Table S1 at http://journals.cambridge.org/geo). Although some of the analyses, especially in the older range of the age spectrum are distinctly discordant, no discordance filter (e.g. Røhr, Andersen & Dypvik, Reference Røhr, Andersen and Dypvik2008) has been applied to the data. This is considered permissible since no quantitative statistical methods are used.
U–Pb data from detrital zircons in Eriksfjord sandstone. Data from online Supplementary Table S1 at http://journals.cambridge.org/geo. (a) U–Pb concordia diagram for detrital zircons in sample QSST from Qassiarsuk. Error ellipses are 2SE reported on the individual points. Inset – The lower age range of zircons in this sample, illustrating the concordant cluster of Early Gardar-age zircons (see also Fig. 5). (b) U–Pb concordia diagram for detrital zircons in sample TSST from Tasiusaq. Error ellipses are 2SE reported on the individual points. (c) Accumulated probability plot of 207Pb–206Pb ages from sample QSST from Qassiarsuk. Note change of scale at 1500 Ma. (d) Accumulated probability plot of 207Pb–206Pb ages from sample TSST from Tasiusaq.

A major fraction of grains in QSST have 207Pb–206Pb ages in the range from 1290 to 1330 Ma (Fig 4c); in TSST this age fraction is much smaller (Fig. 4d). Except for this fraction, the age spectra for the two samples show similar highs and lows, with a major group of Palaeoproterozoic zircons (1750–2000 Ma), and smaller groups in the late Archaean. Sample TSST has a small group of near-concordant zircons between 3000 Ma and 3500 Ma; these ages are absent in QSST, but instead a small group of discordant zircons with 207Pb–206Pb ages in the range 3400 to 3600 Ma was observed. Zircons with 207Pb–206Pb ages between 1750 Ma and 1330 Ma are scarce, and all are distinctly discordant.
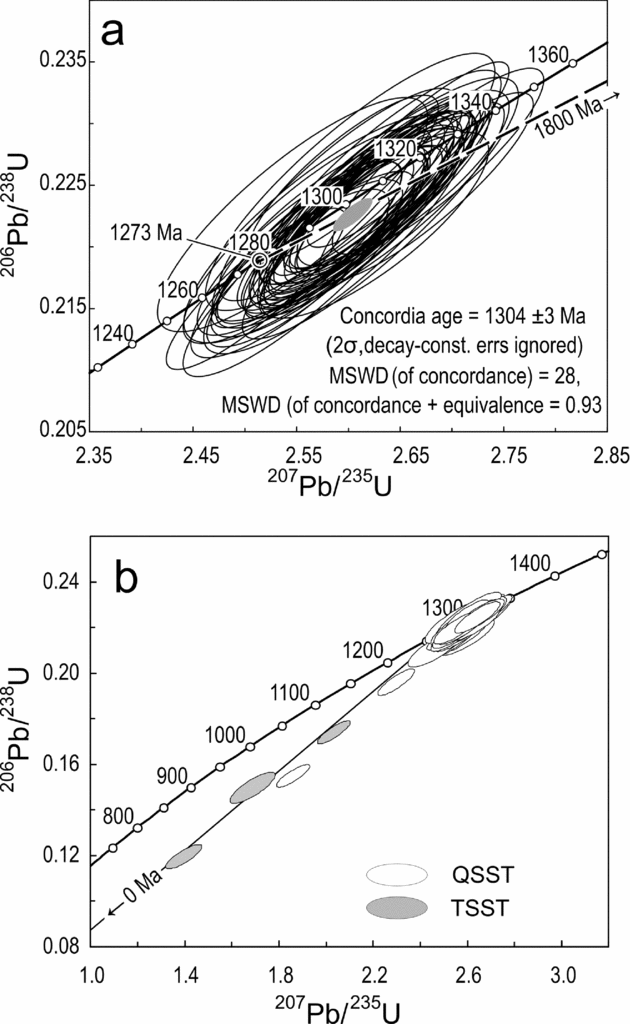
Fifty-one out of the 63 grains defining the young zircon fraction in QSST form a near-concordant cluster with a concordia age of 1304 ± 3 Ma, albeit with an elevated mean square weighted deviation (MSWD) (Fig. 5a) caused by a slight and uniform tendency to normal discordance. The clustering is very tight, with a MSWD for combined concordance and equivalence of 0.93. The 12 remaining grains fall on a lead-loss line from this cluster towards a young lower intercept; the three young zircons from sample TSST fall on this discordia line (Fig. 5b).
U–Pb systematics of young zircons in the Eriksfjord sandstone. (a) Concordia diagram for young concordant zircons from sample QSST from Qassiarsuk (N = 51). The grey ellipse represents the weighted average of the analyses, as reported by Isoplot (Ludwig, Reference Ludwig2003). The broken line is a reference cord from 1273 Ma, assumed to represent Early Gardar intrusive magmatism (McCreath et al. Reference McCreath, Finch, Simonsen, Donaldson and Armour-Brown2012) to an upper intercept at 1800 Ma. (b) Lead-loss line from the cluster in (a) to a lower intercept at zero defined by discordant zircons in QSST and TSST (shaded). This suggests that some zircons in the young age group have suffered recent lead loss.

5.b. Lu–Hf isotopes
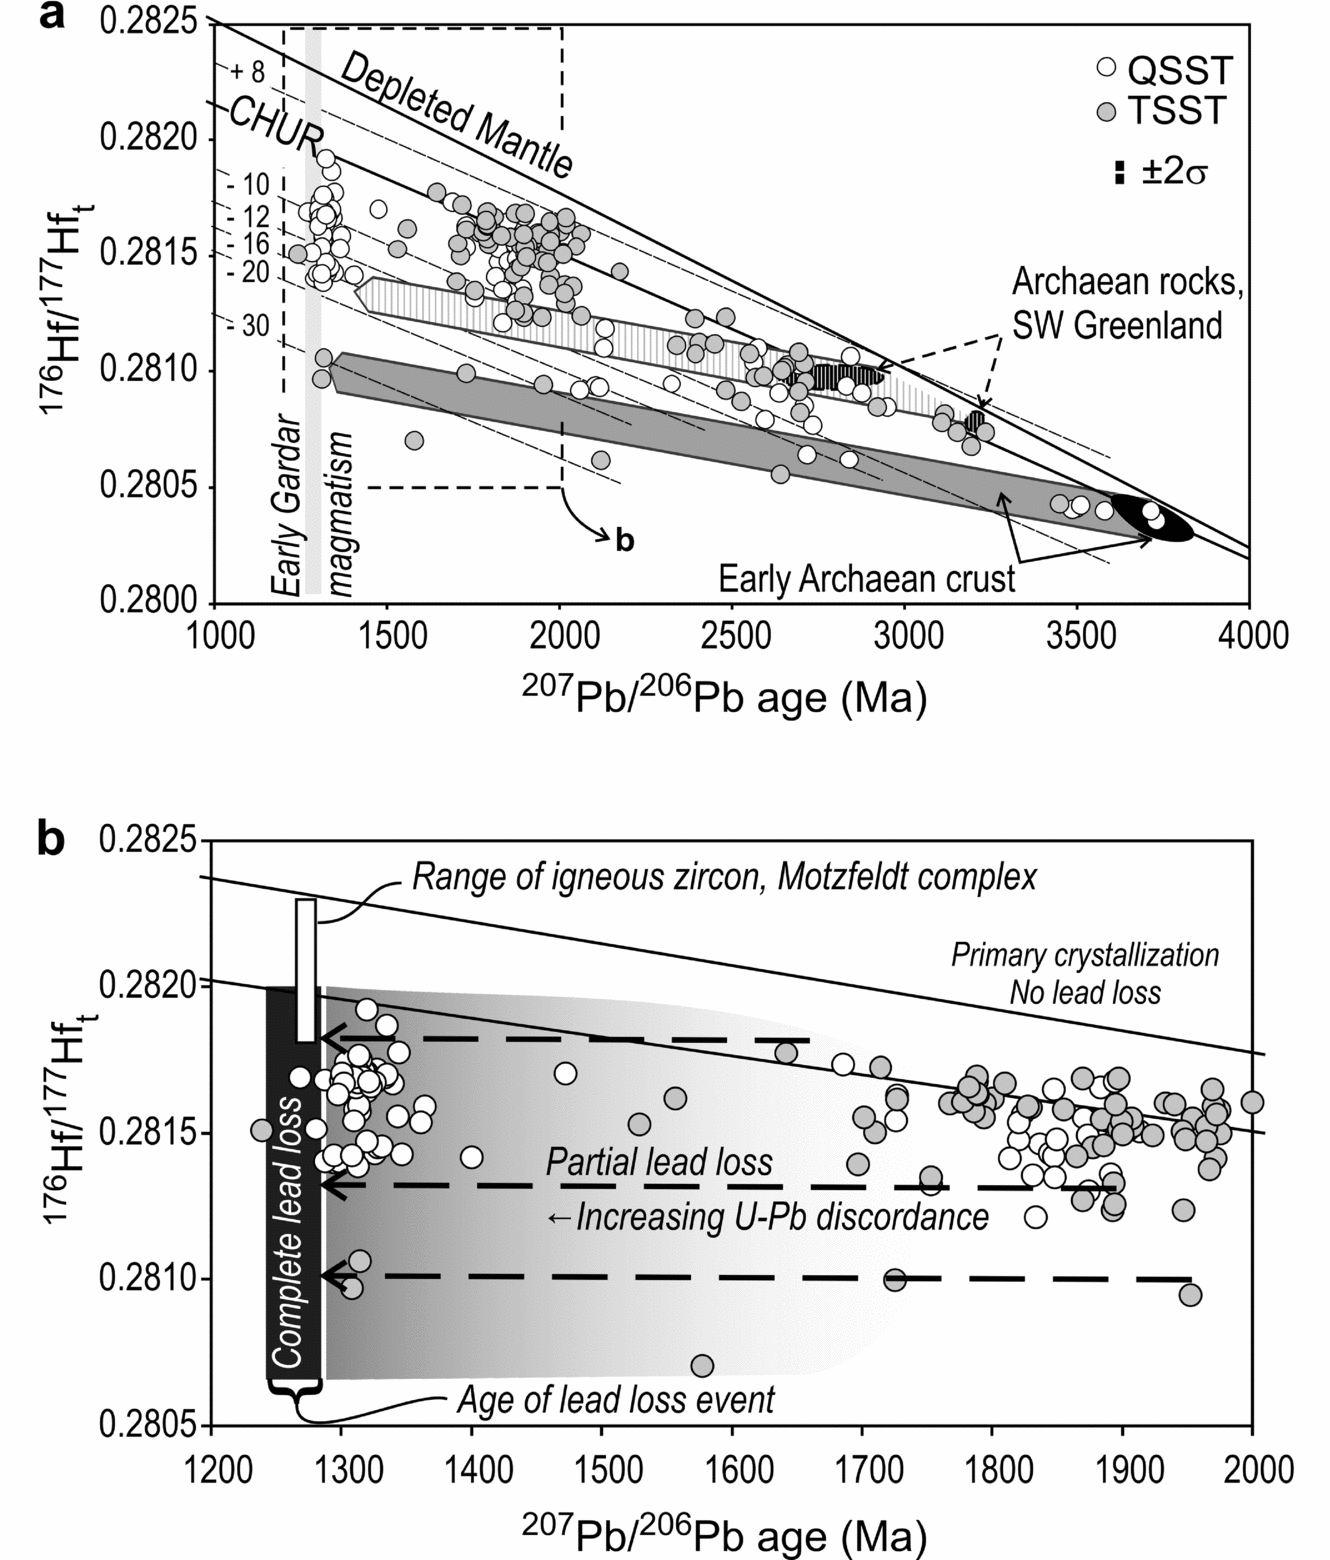
Lu–Hf isotope data (online Supplementary Table S2 at http://journals.cambridge.org/geo) have been recalculated to initial 176Hf/177Hf and plotted at their corresponding 207Pb–206Pb ages in Figure 6a. Initial 176Hf/177Hf show a wide range (0.29036 to 0.28192 or εHf = −38 to +6), which is not correlated with age, so that all of the main age groups except the Mesoarchaean and Palaeoarchaean show 30 epsilon units or more internal variation. Distinctly positive epsilon values (176Hf/177Hf > CHUR(t) in Fig. 6a) are found mainly in the older part of the Palaeoproterozoic age fraction (t = 1800–2000 Ma) but even in this age interval, zircons with positive εHf are less abundant than those with negative εHf.
Initial 176Hf/177Hf detrital zircons in the Eriksfjord sandstone plotted at the 207Pb–206Pb age of the individual zircon. (a) An overview of all the data (online Supplementary Table S3 at http://journals.cambridge.org/geo). The range of early Archaean rocks in Greenland (black) is based on data from Blichert-Toft et al. (Reference Blichert-Toft, Albarède, Rosing, Frei and Bridgwater1999) and Amelin, Lee & Halliday (Reference Amelin, Lee and Halliday2000); ranges for later Archaean rocks in SW Greenland are from Szilas et al. (Reference Szilas, Hoffman, Scherstén, Rosing, Windley, Kokfelt, Keulen, van Hinsberg, Næraa, Frei and Münker2012a ,Reference Szilas, Næraa, Scherstén, Stendal, Frei, van Hinsberg, Kokfelt and Rosing b ). The fields of Hf isotope evolution of early and late Archaean crust through time have been constructed assuming average crustal 176Lu/177Hf = 0.015 (grey and ruled arrows, respectively). The box outlined by a broken line is the limit of the diagram magnified in (b). (b) Detail of (a) showing the effect of lead loss in Early Gardar time on Palaeoproterozoic and older zircons. Zircons that have suffered no lead loss are concordant at their primary crystallization ages (Palaeoproterozoic to Archaean). Zircons that have lost all their lead are also U–Pb concordant, but at the age of the secondary event. Crystals that have suffered partial lead loss are U–Pb discordant and thus give meaningless 207Pb–206Pb ages, but in the Hf isotope evolution diagram they plot along subhorizontal trends starting at the primary crystallization age and terminating at the age of the lead-loss event (broken arrows). Increasing shade suggests increasing loss of lead in Early Gardar time. The range of 176Hf/177Hf in zircon in syenite from the Motzfeld complex has been adapted from the unpublished Ph.D. thesis of J. A. McCreath (Univ. St Andrews, 2009).

The least radiogenic Proterozoic zircons (176Hf/177Hfi ≤ 0.2810) fall along the trend expected from continental crust (176Lu/177Hf = 0.015) isolated from the mantle in Palaeoarchaean time.
The c. 1300 Ma (‘Gardar age’) zircons show a range of initial Hf compositions, with εHf from −38 to 0. A similar range in initial 176Hf/177Hf is seen in the U–Pb discordant zircons with 207Pb–206Pb ages between 1750 and 1400 Ma (Fig. 6b).
5.c. Trace elements
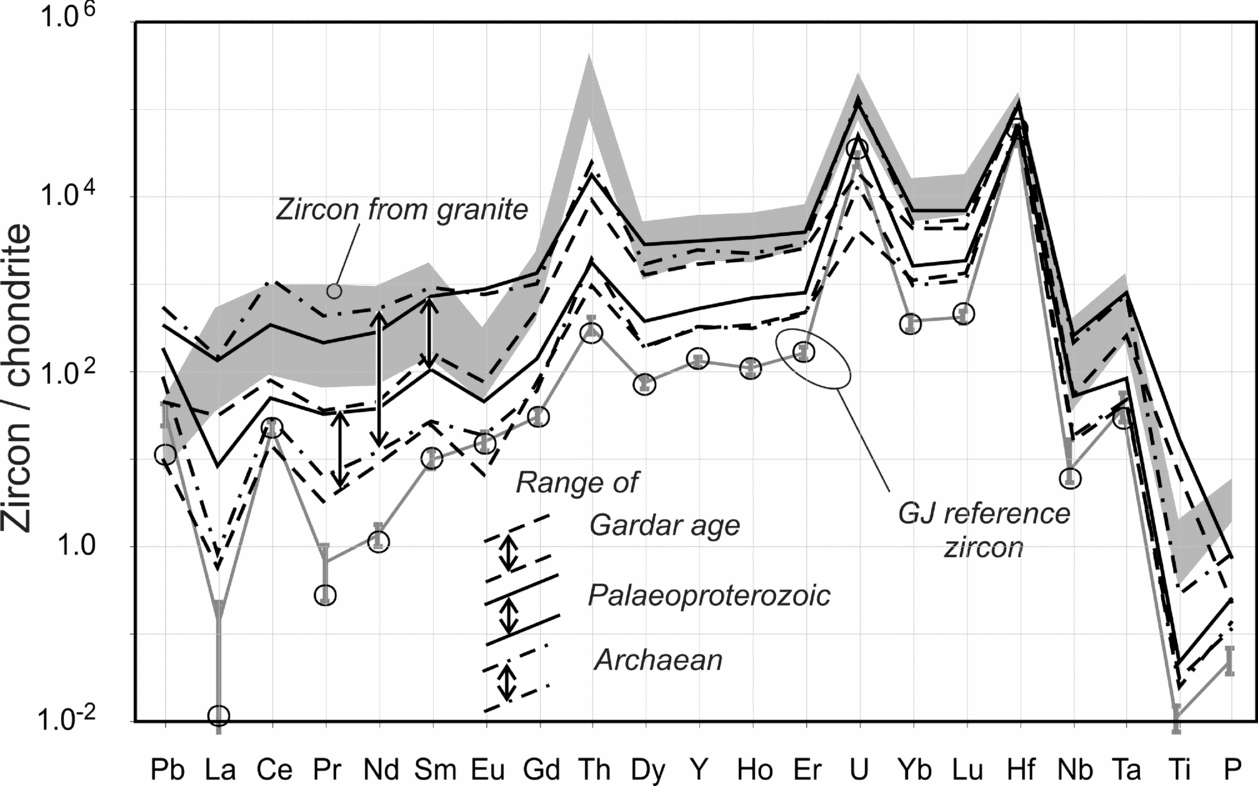
Trace elements were analysed in selected zircons from sample QSST, mainly to detect any systematic difference between the c. 1300 Ma age fraction and the older zircons (Fig. 7, data from online Supplementary Table S3 at http://journals.cambridge.org/geo). The chondrite-normalized trace element distribution patterns are typical for zircons, with positive anomalies for Hf, U, Th and Ce, and negative anomalies for Ti, Nb and Eu. Each of the main age groups (Gardar-age, Palaeoproterozoic, Archaean) shows significant concentration ranges, which overlap completely for elements from Gd to P in Figure 7. The upper part of the light rare earth element (LREE) concentration ranges of Archaean and Palaeoproterozoic zircons resemble the relatively flat and LREE-enriched patterns typically seen in granitoids (Belousova et al. Reference Belousova, Griffin, O'Reilly and Fisher2002), but many grains from these age groups fall significantly below this field. The Gardar-age zircons are lower in LREEs and Pb than the Palaeoproterozoic zircons, and overlap only with the lower range of LREEs seen in the Archaean zircons.
Ranges of trace element concentrations in detrital zircons from the Eriksfjord sandstone (sample QSST). The analyses (online Supplementary Table S3 at http://journals.cambridge.org/geo) have been normalized to chondritic values of McDonough & Sun (Reference McDonough and Sun1995); the plotting sequence follows Belousova, Griffin & O'Reilly (Reference Belousova, Griffin and O'Reilly2006). The average of repeated analyses of the GJ-1 reference zircon are shown with 5 to 95 interpercentile ranges (vertical bars). Circles represent the average of eight mean analyses reported by Liu et al. (Reference Liu, Ju, Zong, Gao, Gao, Xu and Chen2010).

6. Discussion
6.a. Young zircons: young source or post-depositional lead loss?
A conventional interpretation of the young age fraction in QSST is that these zircons have been derived from one or more source rocks formed at a well-defined age of 1304 ± 3 Ma, i.e. in the initial phase of the Early Gardar period (Upton et al. Reference Upton, Emeleus, Heaman, Goodenough and Finch2003). The only information on the Hf isotope characteristics of Early Gardar igneous rocks available to date are LA-ICP-MS Hf isotope analyses of zircon from an altered syenite in the Motzfeldt complex (J. A. McCreath, unpub. Ph.D. thesis, Univ. St Andrews, 2009), which indicate 176Hf/177Hf between 0.28193 and 0.28226 (εHf = −1 to +11) at 1273 Ma (A. A. Finch, pers. comm.). These values are in general more radiogenic than those of the Gardar-age zircons in the sandstone, with only marginal overlap between the two groups (Fig. 6b); this intrusion is therefore not a likely source for the Gardar-age zircons in the sandstone.
The wide range of εHf values in the Gardar-age zircon fraction (εHf = 0 to −38) would imply that the source rock was derived from a very heterogeneous crustal source. An S-type granite could probably fit the description, except that the LREE levels of the Gardar-age zircons are lower than what is commonly expected for granites (e.g. Belousova et al. Reference Belousova, Griffin, O'Reilly and Fisher2002). The large size of this age fraction suggests an uncommonly well-defined maximum age limit for the deposition of the sediment. This ‘standard’ interpretation of these detrital zircon data implies the existence of extrusive or intrusive rocks of Early Gardar age that, in contrast to most other Gardar igneous rocks, which are clearly mantle derived (e.g. Blaxland et al. Reference Blaxland, van Breemen, Emeleus and Anderson1978; Paslick et al. Reference Paslick, Halliday, Davies, Mezger and Upton1993; Andersen, Reference Andersen1997; Halama et al. Reference Halama, Marks, Bügmann, Siebel, Wenzel and Markl2003; Coulson et al. Reference Coulson, Goodenough, Pearce and Leng2003), must have been formed by melting of a very heterogeneous crustal source. The existence of such a source rock would have had far-reaching consequences for the evolution of the Gardar Rift. Unfortunately, no rocks meeting these criteria have been reported from southern Greenland (e.g. Kalsbeek, Larsen & Bondam, Reference Kalsbeek, Larsen and Bondam1990; Henriksen et al. Reference Henriksen, Higgins, Kalsbeek and Pulvertaft2000; Upton et al. Reference Upton, Emeleus, Heaman, Goodenough and Finch2003).
Potential distant source rocks could be found in the Grenville province of North America, where 1300–1400 Ma igneous rocks of continental arc and anorogenic origin do occur (Hanmer et al. Reference Hanmer, Corrigan, Pehrsson and Nadeau2000; McLelland, Selleck & Bickford, Reference McLelland, Selleck and Bickford2010 and references therein). Sm–Nd isotope data suggest a generally juvenile character for these rocks (e.g. DePaolo, Reference DePaolo1985), and North American detrital zircons in the 1.2 to 1.5 Ga age range in general show positive εHf (Belousova et al. Reference Belousova, Kostitsyn, Griffin, Begg, O'Reilly and Pearson2010; Condie et al. Reference Condie, Bickford, Aster, Belousova and Scholl2011) in contrast to the negative values in the Eriksfjord Formation. Since the young zircons are scarce in the younger sandstone unit, the c. 1300 Ma hypothetical source was more likely local than distant, and must either have been removed by erosion, or blanketed over by the earliest Eriksfjord sandstones and the volcanic rocks of the Qassiarsuk complex.
The 1304 ± 3 Ma age calculated for the Gardar-age zircons falls within the range of possible depositional ages for the Eriksfjord Formation, and an alternative explanation for the age is that it reflects loss of radiogenic lead from older detrital zircons after deposition of the host sediment. Low-temperature diagenetic processes have been shown to cause significant lead loss in detrital zircons (Willner et al. Reference Willner, Sindern, Metzger, Ermolaeva, Kramm, Puchkov and Kronz2003), but in the Gardar Rift, a thermal event caused by the first Early Gardar magmatism is a more likely cause. The sandstone in Qassiarsuk village is immediately overlain by the lavas and tuffs of the Qassiarsuk complex and is penetrated by several diatremes, one of which is exposed close to the position of sample QSST (Andersen, Reference Andersen1997, Reference Andersen2008). Sample TSST was taken from a sandstone unit deposited after the culmination of the early magmatism in the Qassiarsuk–Tasiusaq graben, and has escaped similar local heating after deposition. Southern Greenland was geologically quiet from the end of the Ketilidian activity at c. 1740 Ma (Garde et al. Reference Garde, Hamilton, Chadwick, Grocott and McCaffrey2002) to the start of the Gardar rifting event (e.g. Kalsbeek, Larsen & Bondam, Reference Kalsbeek, Larsen and Bondam1990). Discordant zircons with 207Pb–206Pb ages between c. 1740 Ma and c. 1330 Ma most likely record partial lead loss in the same thermal event (Fig. 6b).
The effects of ancient and recent lead loss on the U–Pb and Lu–Hf isotope systems of zircon are well understood (e.g. Amelin, Lee & Halliday, Reference Amelin, Lee and Halliday2000): both of the processes will cause normal discordance of the U–Pb ages, but recent lead loss acting alone will influence neither the 207Pb–206Pb age nor the 176Hf/177Hf calculated at the 207Pb–206Pb age. In contrast, ancient lead loss will generate a subhorizontal trend in a 176Hf/177Hf versus 207Pb–206Pb age diagram, whose slope is controlled by the 176Lu/177Hf ratio of the zircon, and which terminates at the age of the lead-loss event. An old zircon that has lost all its radiogenic lead in such an event will be U–Pb concordant at the younger age, but the corresponding 176Hf/177Hf ratio will remain close to the original value of the zircon, owing to the flat slope of the lead-loss line in the Hf isotope evolution diagram. The 207Pb–206Pb age of a zircon that has suffered partial lead loss in an ancient event is meaningless and serves mainly to constrain the lead-loss trend in the 176Hf/177Hf versus time diagram (Fig. 6b). If a group of detrital zircons with variable age and initial Hf isotopic composition were affected by complete lead loss after deposition of the host sediment, the result would be a vertical array in the 176Hf/177Hf(t) versus time diagram, at the age of the lead-loss event, similar to what is observed in the Eriksfjord Formation (Fig. 6b).
The large range of 176Hf/177Hf observed in the Gardar-age zircons in the Eriksfjord sandstone can be adequately explained by extensive loss of radiogenic lead in Early Gardar time from Palaeoproterozoic to late Archaean detrital zircons whose εHf prior to lead loss ranged from low positive to highly negative values, as shown in Figure 6b. It is not possible to assign a primary crystallization age to these zircons or to relate them to a specific protosource rock. This age fraction thus has no implications for sedimentary provenance and does not define a maximum depositional age for the sediment. Post-depositional alteration has not affected the Lu/Hf ratio or the Hf isotope composition of the zircons. The trace element patterns suggest that LREEs may have been lost together with radiogenic lead; other elements were not affected by the process. No visible overgrowths of new zircon were formed, and the pre-existing oscillatory zoning pattern is largely preserved, although locally overprinted by an interfering, non-oscillatory cathodoluminescence signal (Fig. 3d–f).
6.b. Archaean and Palaeoproterozoic protosources: near or distant?
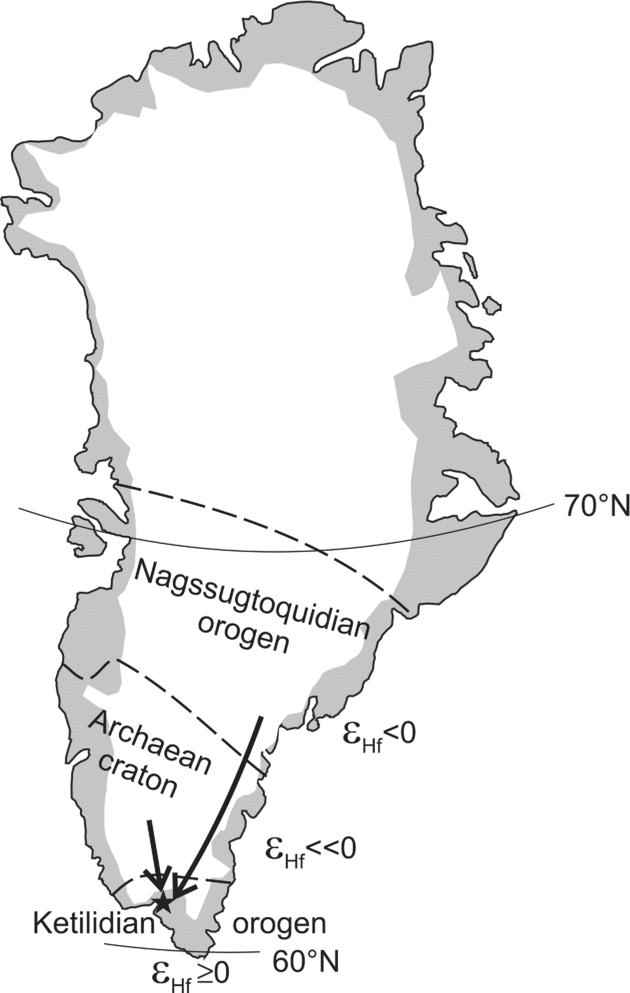
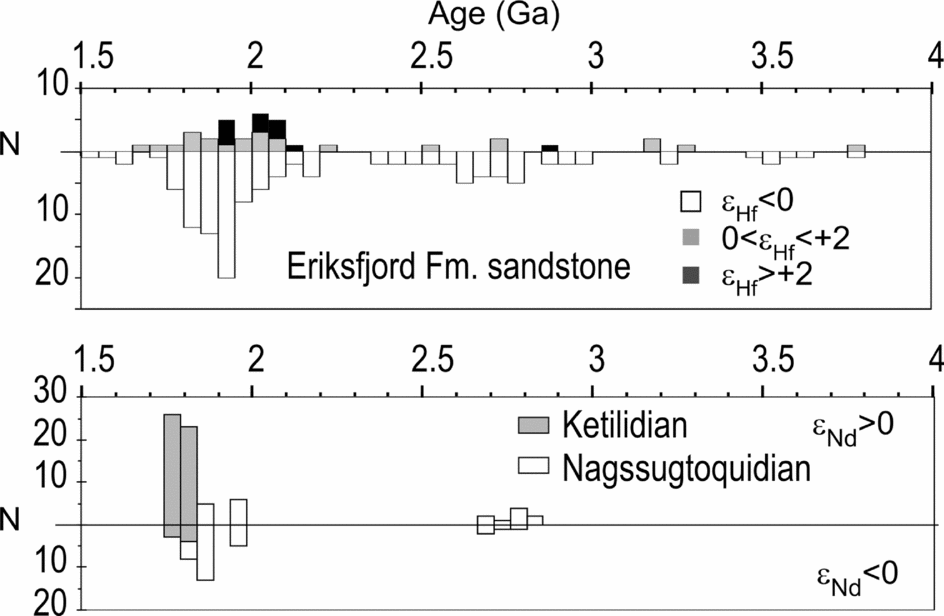
The Gardar Rift is contained within the late Palaeoproterozoic Ketilidian orogen of southern Greenland, but relatively close to its boundary with the Archaean craton (Fig. 8). The Archaean craton of southern Greenland records events from c. 3.8 Ga to the Neoarchaean (Henriksen et al. Reference Henriksen, Higgins, Kalsbeek and Pulvertaft2000; Hölttä et al. Reference Hölttä, Bagansky, Garde, Mertanen, Peltonen, Slabunov, Sorjonen-Ward and Whitehouse2008). Palaeoarchaean rocks give near-chondritic initial Hf isotope compositions at 3.6–3.8 Ga (Blichert-Toft et al. Reference Blichert-Toft, Albarède, Rosing, Frei and Bridgwater1999; Amelin, Lee & Halliday, Reference Amelin, Lee and Halliday2000); younger Archaean rocks in SW Greenland are near-chondritic at 2.7–3.0 Ga, with a hint of c. 3.2 Ga inheritance at εHf ≈ +2 (Szilas et al. Reference Szilas, Hoffman, Scherstén, Rosing, Windley, Kokfelt, Keulen, van Hinsberg, Næraa, Frei and Münker2012a ,Reference Szilas, Næraa, Scherstén, Stendal, Frei, van Hinsberg, Kokfelt and Rosing b ). These two groups of Archaean rocks evolved to εHf ≈ −30 to −35 and −15 to −20, respectively, at Early Gardar age, given a normal crustal 176Lu/177Hf ratio of 0.015 (Fig. 6a). No other Hf isotope data for rocks of late Archaean and Palaeoproterozoic age have so far been published, but Sr, Nd and Pb isotope data from rocks in the 2.7 Ga Skioldungen complex in SE Greenland (Blichert-Toft et al. Reference Blichert-Toft, Rosing, Lesher and Chauvel1995) and the Ketilidian orogen indicate a dominant contribution from juvenile material in late Archaean and Palaeoproterozoic time, including in the 1.80–1.85 Ga Julianehåb I-type granite batholith making up the basement in and around the Gardar Rift (van Bremen, Aftalion & Allaart, Reference van Breemen, Aftalion and Allaart1974; Patchett & Bridwater, Reference Patchett and Bridgwater1984; Kalsbeek & Taylor, Reference Kalsbeek and Taylor1985; Garde et al. Reference Garde, Hamilton, Chadwick, Grocott and McCaffrey2002). Because of the well-established positive correlation between Nd and Hf isotopes in crustal rocks (Vervoort & Patchett, Reference Vervoort and Patchett1996; Vervoort & Blichert-Toft, Reference Vervoort and Blichert-Toft1999), rocks with positive or near-zero εNd are highly unlikely to produce zircons with strongly negative initial εHf (Fig. 9). In contrast, rocks of the marginally older (1.92–1.83 Ga, van Gool et al. Reference van Gool, Connelly, Marker and Mengel2002) Nagssugtoquidian orogen north of the Archaean craton show a pronounced tendency to negative εNd values (Fig. 9). Such rocks would be expected to produce zircons with a Palaeoproterozoic age and a distinctly negative εHf signature.
Simplified sketch of Greenland, showing the position of the Archaean craton and the Nagssugtoquidian and Ketilidian orogens

Initial Hf isotope signatures in Palaeoproterozoic and Archaean zircons from the Eriksfjord sandstone (this work) compared to Nd isotope data on potential protosource terranes. Sources of data: Ketilidian – Patchett & Bridgwater (Reference Patchett and Bridgwater1984) and Brown et al. (Reference Brown, Dempster, Hutton and Becker2003). Nagssugtoquidian – Kalsbeek, Pidgeon & Taylor (Reference Kalsbeek, Pidgeon and Taylor1987) and Whitehouse, Kalsbeek & Nutman (Reference Whitehouse, Kalsbeek and Nutman1998).

The rare > 3500 Ma zircons in the Eriksfjord sandstone overlap in Hf isotopes with published Hf isotope data from Palaeoarchaean rocks in Greenland (Fig. 6). Near-chondritic zircons of 2.7–3.2 Ga age most likely originated in juvenile Archaean intrusions at some distance in East or West Greenland, whereas Neoarchaean and early Palaeoproterozoic zircons (2.2 to 2.6 Ga) with negative εHf may have crystallized in this period from magmas derived from mixtures of Palaeoarchaean crust and juvenile material, with or without a contribution from late Archaean juvenile crust. Detrital zircons of c. 1800–1900 Ma age with low positive εHf may have originated from protosources resembling the Julianehåb granite and other igneous rocks of the Ketilidian orogen. However, most of the Palaeoproterozoic zircons in the Eriksfjord sandstones have negative εHf (Fig. 9), implying protosources with an extended crustal history at the time of zircon crystallization. From neodymium isotope data, such rocks are more likely to be found in the Nagssugtoquidian orogen. This suggests that far-transported Archaean and Palaeoproterozoic detritus derived from primary sources outside of the Ketilidian orogen has contributed significantly to the Eriksfjord sandstone.
It is unlikely that far-transported detritus has moved from primary sources in the Nagssugtoquidian orogen or the Archaean craton to the site of deposition in the Gardar Rift in a one-step process during Gardar time. More likely, Archaean and Palaeoproterozoic material was stored in intermediate reservoirs made up by older sedimentary rocks that have been recycled and re-deposited within the rift. Erosional remnants of pre-Gardar cover sequences that may have acted as intermediate repositories occur in the border zone between the Archaean and Ketilidian provinces of southern Greenland (Allaart, Reference Allaart, Escher and Watt1976).
Long transport distances and repeated events of recycling of detritus may be the rule rather than the exception. For example, Røhr, Andersen & Dypvik (Reference Røhr, Andersen and Dypvik2008) and Røhr et al. (Reference Røhr, Andersen, Dypvik and Embry2010) found that Cretaceous sandstones in northern Greenland and Arctic Canada contain significant contributions from recycled Proterozoic and Caledonian sediments. Furthermore, detrital zircons in Permian sandstone in the Oslo Rift, Norway, include fractions from sources in the central and eastern parts of the Fennoscandian Shield, which were brought to the final site of deposition through repeated cycles of sedimentation and re-deposition (Andersen et al. Reference Andersen, Sayeed, Gabrielsen and Olaussen2011).
6.c. Greenland or Fennoscandia: the problem of indistinct Proterozoic and Archaean protosource signatures
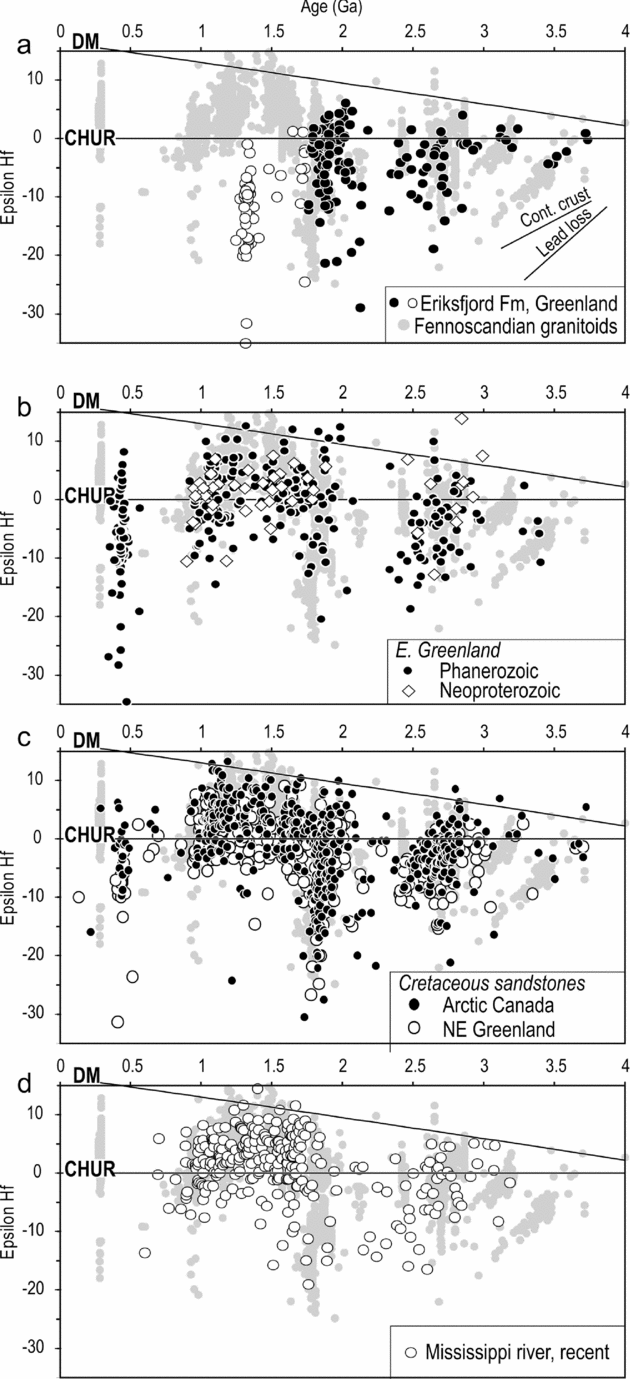
To use detrital zircon data to identify protosources for clastic sediments, potential source terranes must be different enough in age and Hf isotope signature so that they can be distinguished from each other. To illustrate that this may not always be the case, the combined set of data from the Eriksfjord sandstone is superposed on an accumulated set of data on igneous zircons from Fennoscandian granitoids in Figure 10a. The pre-Gardar-age fractions of detrital zircons in the Eriksfjord sandstone show impressive overlap with the granitic zircons from Fennoscandia. Taken out of geological context, the similarity between the two patterns would indicate that the Fennoscandian granitoids were a likely protosource for the Eriksfjord zircons.
εHf signatures of detrital zircons in the Eriksfjord sandstone compared to data on igneous zircons from Fennoscandian granitoids. Fennoscandian data from Patchett et al. (Reference Patchett, Kouvo, Hedge and Tatsumoto1981), Anderson, Griffin & Pearson (Reference Andersen, Griffin and Pearson2002), Andersen et al. (Reference Andersen, Griffin, Jackson, Knudsen and Pearson2004, Reference Andersen, Andersson, Graham, Åberg and Simonsen2009), Anderson, Graham & Sylvester (Reference Andersen, Graham and Sylvester2007, Reference Andersen, Graham and Sylvester2009), Heinonen, Andersen & Rämö (Reference Heinonen, Andersen and Rämö2010), Kurhila, Andersen & Rämö (Reference Kurhila, Andersen and Rämö2010), Heilimo et al. (Reference Heilimo, Halla, Andersen and Huhma2012), Lauri et al. (Reference Lauri, Andersen, Hölttä, Huhma and Graham2011), Pedersen et al. (Reference Pedersen, Andersen, Konnerup-Madsen and Griffin2009) and author's database. (a) Data from Eriksfjord sandstone (this work). (b) Detrital zircons from sedimentary rocks in eastern Greenland (Slama et al. Reference Slama, Walderhaug, Fonneland, Kosler and Pedersen2011). (c) Detrital zircons from Cretaceous sandstones in Arctic Canada and NE Greenland (Røhr, Andersen & Dypvik, Reference Røhr, Andersen and Dypvik2008; Røhr et al. Reference Røhr, Andersen, Dypvik and Embry2010). (d) Detrital zircon in present-day sedimentary load of the Mississippi river (Condie et al. Reference Condie, Bickford, Aster, Belousova and Scholl2011).

The similarity between sediment from Greenland and granitoids in Fennoscandia may have three different causes: (1) it could be pure coincidence; (2) it could reflect parallel evolution in different continents, possibly related to supercontinent evolution in the geological past; or (3) the two continental blocks may have exchanged detritus when forming part of one or more old supercontinents. The observation that detrital zircons from sediments from Greenland and Arctic Canada, spanning a range of depositional ages from the Neoproterozoic to the Cenozoic, and modern sediment load in the Mississippi river show considerable overlap with the Fennoscandian granitoids argues against a purely coincidental explanation (Fig. 10b). On the other hand Fennoscandia and Laurentia, including Greenland, have formed part of Phanerozoic Pangaea, Mesoproterozoic Rodinia and a Palaeoproterozoic supercontinent (e.g. Zhao et al. Reference Zhao, Sun, Wilde and Li2004; Condie, Reference Condie2005; Lahtinen, Garde & Melezhik, Reference Lahtinen, Garde and Melezhik2008). In some reconstructions, the Palaeoproterozoic granitoid complexes of Fennoscandia continued into those of the Nagssugtoquidian and Ketilidian provinces of Greenland (Karlstrom et al. Reference Karlstrom, Åhäll, Harlan, Williams, McLelland and Geissman2001; Lahtinen, Garde & Melezhik, Reference Lahtinen, Garde and Melezhik2008). Parallel tectonomagmatic evolution in the two continents in Palaeoproterozoic time is therefore not at all unrealistic. The result would be overlapping U–Pb and Lu–Hf signatures that make the identification of source terranes from detrital zircon data difficult or even impossible.
Exchange of detritus between adjacent blocks in a supercontinent, in intracontinental basins that have since been broken up, or along a common continental shelf also cannot be ruled out. This would produce a more or less homogenized pool of sediment that can be eroded and re-sedimented in a later period. These processes add up to produce indistinct source terrane signatures, so that the assumption underlying the qualitative approach to detrital zircon analysis is violated. The data summarized in Figure 10 suggest that even combined age- and Hf isotope spectra cannot be used to answer a first-order question such as if a given sediment is derived from sources to the east or west of the North Atlantic.
6.d. The future of detrital zircon studies in stratigraphy and provenance analysis
The use of the youngest detrital zircon grain or fraction of grains in a sediment to define a maximum age of deposition has previously been criticized because there is no necessary connection between processes that generate zircons and those that release and eventually deposit them in a sedimentary basin (e.g. Andersen, Reference Andersen2005). Furthermore, instrumental U–Pb analysis is seldom precise enough to distinguish between undisturbed concordant zircons and zircons that have seen incipient lead loss (e.g. Knudsen et al. Reference Knudsen, Andersen, Whitehouse and Vestin1997). The present findings point to another possible source of bias in such data: even a significant and well-defined age fraction of detrital zircons may have been modified by loss of radiogenic lead after deposition of the sediment by the action of diagenetic fluids (Willner et al. Reference Willner, Sindern, Metzger, Ermolaeva, Kramm, Puchkov and Kronz2003) or by a thermal event (this work). There are published examples in which the timing of sediment deposition is very tightly bracketed by the age of a significant detrital zircon fraction, and a well-defined, independently datable post-depositional tectonothermal event (e.g. Ordovician sediments of the Helgeland Nappe complex in Northern Norway; Barnes et al. Reference Barnes, Frost, Yoshinobu, McArthur, Barnes, Allen, Nordgulen and Prestvik2007). Whereas post-depositional metamorphism or cross-cutting intrusions can generally be dated with confidence, the present results suggest that any model where the maximum age of deposition is based on detrital zircon data should be treated with extreme care, and only brought forwards where there are independent time constraints on sedimentation (e.g. biostratigraphic markers or datable diagenetic minerals).
Analyses of detrital zircons may still contribute to the understanding of sedimentary provenance, but to be used with confidence, the data must be combined with a broad range of other information about the rocks from which the zircons are separated, as well as a full understanding of the prior evolution of potential source terranes. Using detrital zircons as a first or unsupported approach is in general unjustified, and may in some cases lead to misleading or insignificant results. Probably, the method will be most useful in settings where one or more distinct and well-characterized point-sources may have contributed.
7. Conclusions
Although the use of combined U–Pb and Lu–Hf data on detrital zircons has contributed to our understanding both of crustal evolution on a global scale and evolution of sedimentary basins on a regional scale, the use of the method in stratigraphy and provenance analysis is fraught with problems that have not received sufficient attention. Some of these problems are highlighted by the data from the sandstones of the Mesoproterozoic Eriksfjord Formation in the Gardar Rift of southern Greenland.
(i) Young zircon age fractions may reflect post-depositional processes rather than processes in the source terrane, and are therefore useless as indicators of the maximum age of sedimentation.
(ii) Zircons may not have a clear and unique path from source to depositional sink: they may have been recycled through several intermediate reservoirs, which may have helped smooth out protosource signatures.
(iii) Different crustal source terranes may not necessarily have sufficiently different event signatures for zircons derived from them to be allocated to a source. For some continents, such as those bordering the North Atlantic, this is largely a result of processes of crustal evolution in former supercontinent settings.
Detrital zircon data may be most useful as a supplement to other information on the host sediments. Taken alone, they will have less predictive power than has generally been assumed.
Acknowledgements
Analytical work has been funded by the University of Oslo through the Småforsk programme of the Department of Geosciences. Thanks are due to my colleagues Johan Petter Nystuen and Henning Dypvik and my former Ph.D. students Torkil Røhr and Jarkko Lamminen for many thought-provoking discussions on the inner life of detrital zircons, to Siri Simonsen, Berit Løken Berg, Juhani Virkanen and Tuija Vaahtojärvi for analytical assistance and to Marion Seiersten for assistance in the field. The paper has benefited from constructive reviews by Adrian Finch and an anonymous reviewer. This is contribution no. 31 from the Isotope Geology Laboratory at the Department of Geosciences, University of Oslo.