1. INTRODUCTION
Self-reported data, such as from the Automatic Identification System (AIS), allow the association of widely separated position reports because the vessel is uniquely identified in each of them. In contrast, more traditional sensor data sets, as might arise from radar, typically only permit two contacts in close proximity to be attributed to the same vessel. Thus, the problem of considering the possible trajectories of a vessel between widely separated points in space-time is one that is naturally associated with self-reporting. The problem has been given increased prominence by the widespread use of AIS and other self-reporting systems in maritime situational awareness (Hammond, McIntyre, Chapman and Lapinski, Reference Hammond, McIntyre, Chapman and Lapinski2006).
With AIS data, as available in a nation's common operating picture, it is typical for gaps between successive position reports from a given ship to vary from seconds, to days, or even longer, due to variability in AIS coverage over the ship's trajectory (Somers and Chaulk, Reference Somers and Chaulk2004). The present paper is concerned with the consequences of the wider time intervals.
Given two position reports from the same vessel, it is possible and often desirable to make probabilistic judgements about the trajectory of the vessel in the time interval bounded by those two reports. Significant events may take place in the interval, and inference about the role that vessels might have played in them could well become urgent. Thus, this paper suggests a probability measure over the space of possible trajectories connecting two self-reports from the same ship. It also illustrates a practical method by which probabilistic inference can be made over such a space. The approach is Bayesian in inspiration and flavour. It employs a prior distribution over path space that is parameterized by the maximum and preferred speed of the ship; by the minimum, peak and mean duration of port stays; by an index of the ship's tendency to visit ports rather than sailing on; by a flag that permits or forbids immediate revisits to the same port; and by the minimum time interval over which paths are considered random.
We illustrate the computation of posterior distributions in the light of various types of data that might be brought to bear on the problem. As with many modern Bayesian applications, inference proceeds using stochastic simulation methods, of which the importance sampling approach employed here (Gelman, Carlin, Stern and Rubin, Reference Gelman, Carlin, Stern and Rubin1995) is a typical example. Unlike most such applications, the random variables in question here are not numbers or even vectors but trajectories over path space.
As previously reported (Hammond and Peters, Reference Hammond and Peters2009), our approach to such questions is to generate randomly a large set of paths connecting the two reports from our prior distribution over the path space. Given relevant data (including negative data), the randomly generated paths are then weighted by their likelihoods. Probabilistic responses to nearly any imaginable query follow straightforwardly. The current paper differs from our previous work in the enhanced realism of generated paths, which now consider the possibility of port visits. This paper also differs from existing work on interpolation in the field of animal telemetry (Sumner, Wotherspoon and Hindell, Reference Sumner, Wotherspoon and Hindell2009) by the capacity of generated tracks to avoid barriers. Section 2 gives an overview of our path generation method. (Details are provided in the appendix.)
It must be emphasized that the problem of considering the possible paths that may have been taken by a vessel from one point (A) to another point (B) is more general than the problem of considering the possible paths that could have been chosen by a vessel at point A for the purpose of arriving at point B. In the general problem, a vessel may have had other tasks to do at other locations, such that the path may go to places that are farther away from A or from B than A and B are from each other. In short, the problem of probabilistic interpolation is quite different from the problem of route selection.
In section 3, we demonstrate the use of the probabilistic interpolation method to help identify the most likely perpetrator in a fictitious scenario in which illegal dumping of waste matter has taken place. Benefits and limitations of the method are discussed in section 4.
2. PATH GENERATION METHOD: OVERVIEW
This section contains a rough description of the path generation algorithm. See the appendix for the details of the method.
Let A and B be the positions of the two reports between which we wish to interpolate the vessel's path, and let t A and t B denote the respective time stamps of those two reports. We want our path generation method to be capable of generating any physically feasible path that we might imagine. A simple way to accomplish this is by a recursive “divide and conquer” algorithm, in which a random intermediate point X is proposed for a random time t X in the interval between t A and t B. If a trip from A to B via X is unfeasible, given all the relevant constraints (such as the existence of land masses), then the random selection of X is repeated. When a feasible point X is found, the “divide and conquer” algorithm is called recursively, once from A at time t A to X at time t X and once from X at time t X to B at time t B. If the time interval is shorter than some pre-specified minimum, the vessel is instead assumed to take the shortest path, at a constant speed – thus terminating the recursion.
We use the recursive algorithm described above whenever we know (or assume, or choose to dictate) that no ports were visited in the time interval in question. A more general version of the “divide and conquer” algorithm is used when one or more ports are available. We start by randomly setting a “sojourn time” s – that is, an amount of time to be spent (possibly) at a port along the way. Sometimes, as decided randomly based on a probability that derives from a pre-specified parameter and from the sojourn time, we ignore the ports and turn to the no-port “divide and conquer” method described in the previous paragraph. Otherwise, a port is chosen randomly among all those that are feasible, with the relative probability for each port being based on the amount of flexibility in the time of arrival at that port. In other words, ships are deemed more likely to visit ports that have the lowest opportunity cost. The arrival time t X is then chosen randomly. The generalized “divide and conquer” algorithm is then called twice recursively – once from A at time t A to the chosen port at time t X and once from that port at time t X + s to B at time t B.
Finally, consider the case where the vessel is (moored) in port at the start or the end of the time interval. A “sojourn time” is generated in the same way as for a port to be visited along the way, but then only a randomly chosen portion of that sojourn time is considered to belong to the time interval of interest (between t A and t B). The generalized “divide and conquer” algorithm, as described in the previous paragraph, is called for the truncated time interval. For example, if the vessel starts in port, and a sojourn time s is determined for that port stay, then a random time amount u – typically, but not always, taken as uniform from zero to s – is taken out of the time interval of interest. So in this example the generalized “divide and conquer” algorithm would be called from A at time t A + u to B at time t B.
3. DUMPING SCENARIO
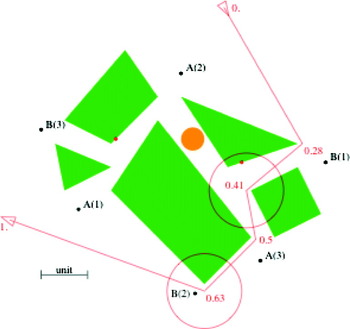
Figure 1 shows the geography of a toy problem given in arbitrary units. The five green polygons represent five islands. Two ports are represented by small red dots (visible on the south side of two of the islands). Two successive passes of a satellite in low earth orbit collect AIS data. The first pass (at time t=0) finds three vessels at the locations marked with black dots labelled “A(1)”, “A(2)”, and “A(3)”; and the second pass (at time t=1, but which we might imagine to be about 12 hours later) finds the same three vessels at the locations respectively marked with black dots labelled “B(1)”, “B(2)”, and “B(3)”.
Representation of geographical data for the dumping scenario. Key: land masses - green polygons; ports - red dots; waste spill - orange; AIS position reports for three suspect vehicles - black dots labelled A(n) and B(n) - n from 1 to 3; military vessel trajectory - red; surveillance range - red circles; time coordinates (0–1) - red numbers.

The filled orange circle represents a waste spill. Later investigation concludes that the spill took place around the time t=0·34. The spill is of such a size that it is deemed reasonable to assume that the vessel generating it should have been carrying and using AIS. We want to know which of the vessels was most probably within that circle at that time.
In order to illustrate how such probabilities may be affected by negative data, we add a friendly military vessel to the scenario, and we suppose that it failed to see any other vessels in its vicinity during the relevant time interval. The trajectory of the military vessel is shown in red in Figure 1, with some points labelled by their time coordinates (also in red). Its range of surveillance is shown by two red circles centred on two of those positions. It is assumed that the military vessel would certainly have detected any vessels that came within the range given by the radius of those circles.
The following parameter values were used (see subsection A.3 of the Appendix): v max=15, v pref=12, s min=0·1, s peak=0·2, s mean=0·3, repeat_allowed=FALSE, L=1, τ min=0·05, N frustration=20. (For vessels 1, 2, and 3 respectively, the shortest path from the starting point to the ending point has a length of 6·45, 5·55, and 6·30. The distance scale is indicated in the lower left of Figure 1.) Given these parameters, in this scenario, 42% to 48% of the randomly-generated paths for each vessel made at least one visit to one of the two ports. (This fraction is an increasing function of the parameter L.)
Ten thousand random paths were generated for each vessel. Based upon this sample, the prior probability for each vessel being within the orange circle at time t=0·34 is given in the first row of Table 1. The second row shows the probability adjusted by the assumption that at least one of the vessels was there – since we know of no other vessels that could have perpetrated the spill. Vessel 1 appears to be the most probable perpetrator. (Note that these adjusted probabilities add to slightly more than unity, since there is some chance that more than one vessel was in the orange circle at the designated time.)
Probability of each vessel being in the spill zone at time t=0·34.

The negative data from the military vessel bring about a further adjustment to these results. The third row of Table 1 is like the second, except that we exclude all paths that go through the surveillance region of our military vessel. Now it appears that Vessel 2 is the most likely perpetrator of the spill.
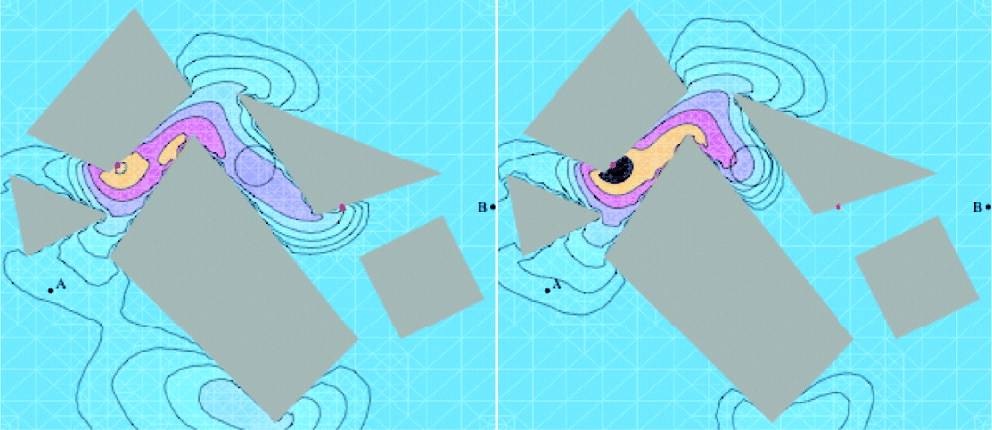
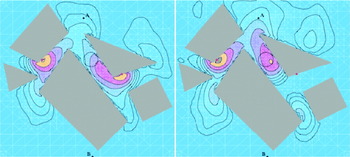
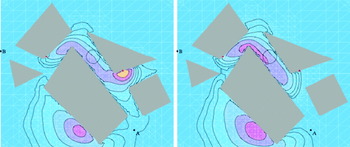
The choice of a specific time coordinate reduces the sample of paths to a sample of points, from which a probability density can be estimated. Figures 2 through 4 show the approximate probability density for each vessel's position at time t=0·34. The left part of each figure illustrates the prior probability density, based on the full sample of 10,000 paths for each vessel, while the right part of each figure illustrates the adjusted probability density in response to the negative data – that is, based only on the paths that did not go through the surveillance region of our military vessel. (For vessels 1, 2, and 3, there were respectively 7337, 3009, and 7341 such paths.)
Probability density for position of Vessel 1 at time of dumping (prior distribution left, adjusted for negative data at right).
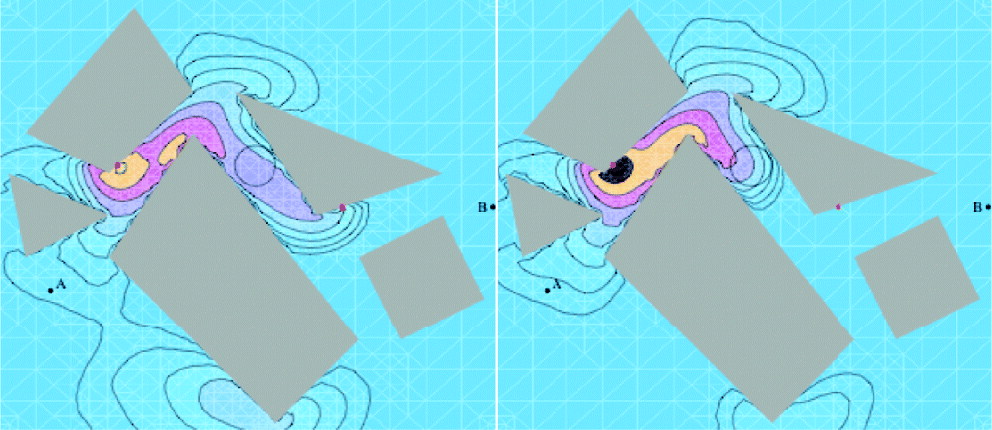
Probability density for position of Vessel 2 at time of dumping (prior distribution left, adjusted for negative data at right).

Probability density for position of Vessel 3 at time of dumping (prior distribution left, adjusted for negative data at right).

The estimations of probability density were computed via a Parzen estimator (Devijver and Kittler, Reference Devijver and Kittler1982):
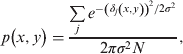
where δ j(x,y) is the distance between the point (x, y) and the position of the j-th point in the sample, N is the size of the sample, and σ is a smearing parameter. If σ is too small, the contour plots will be too grainy, but if it is too large, features may be lost. In general, the larger the sample of paths, the smaller this parameter can be. We used σ=0·2.
In each plot, the displayed probability density contours are based on an exponential scale, with the probability density at any given contour being e 0·6 (about 1·82) times the probability density at the next lower contour. The lowest contour shown is for a probability density of e −4·5 (about 0·011).
4. DISCUSSION
This paper suggests a general procedure for enabling probabilistic inference over path space. It illustrates how the approach enables a wide variety of probabilistic queries, limited only by one's imagination. The paper also attempts, by means of a fictitious example, to suggest the relevance of such queries to practical maritime situational awareness. It must be emphasized that these are capabilities presently afforded by no other method. Still, if this method is ever to play a significant role in understanding maritime traffic, it will only be because users maintain a clear awareness of the method's assumptions and limitations.
One important limitation of the method proposed arises from its assumption that the primary constraint on vessel movement is the ship's maximum speed. While this is probably the case for most longer trips, acceleration constraints can become much more significant over shorter time intervals. Also, by treating the movement of two vessels as mutually independent, the method does not capture vessel avoidance behaviour. Thus, in areas where vessel movements are actually constricted by traffic or manoeuvrability, the method will tend to attribute more range of motion to the vessel than would actually be possible. This effect is mitigated to some extent by the natural tendency of congested areas to be well covered by AIS, greatly reducing the errors introduced by any form of interpolation. Still, in interpreting output like Figures 2–4, it is important to consider where traffic congestion and manoeuvrability constraints might be most important.
Another potential limitation of the method lies in its computational requirements, which are considerable. The method calls on its users to generate hundreds, if not thousands, of random paths between successive pairs of position reports, and the generation of each of these random paths requires repeated calls to Dijkstra's algorithm (Dijkstra, Reference Dijkstra1959), or substitutes such as A* (Nilsson, Reference Nilsson1980). Given the sheer volume of AIS (and other self-reported) data being collected by agencies responsible for maritime situational awareness around the world, this is clearly an ambitious undertaking. The method does, however, provide one practical advantage that mitigates the daunting computational load: it is ideally suited for parallel processing. This suitability arises because the treatment of any pair of successive position reports is taken to be independent of all other reports from the same vessel. Thus the workload can be efficiently divided between many processors.
It should also be understood that the range of interval lengths for which the method is appropriate has both upper and lower bounds. The shorter the time interval, the more likely it is that the vessel simply took the shortest route from A to B. On the other hand, as the time interval between successive reports grows longer, the area that might have been covered by the vessel expands rapidly, and so does the number of paths that need to be generated in response to a query. While no theoretical constraints prevent the method from being applied to such situations, the number of generated paths would eventually grow prohibitive. However, there is no easy general rule for specifying the maximum interval length, because it varies with the available computational resources and with the details of the scenario in question. The number of paths that should be generated is also a function of the spatial resolution of the questions of interest. For example, had the waste slick in this example been much tinier, the proportion of trajectories crossing it would have diminished accordingly, and more random paths would have been needed to address the questions with similar precision.
Further applications of the interpolation method are expected to include coverage estimation and shipping route determination, both of which are useful for anomaly detection (Lane, Nevell, Hayward and Beaney, Reference Lane, Nevell, Hayward and Beaney2010). Raw AIS data have been used (Ristic, La Scala, Morelande and Gordon, Reference Ristic, La Scala, Morelande and Gordon2008; Laxhammar, Falkman and Sviestins, Reference Laxhammar, Falkman and Sviestins2009) to estimate shipping routes, but we feel that interpolation methods provide a natural way to refine these estimates. Meanwhile, interpolation methods are expected to be applicable to the estimation of AIS coverage, by helping to distinguish between areas of little or no coverage and areas of little or no vessel traffic (Lane, Nevell, Hayward and Beaney, Reference Lane, Nevell, Hayward and Beaney2010).
Already, the interpolation method can provide useful answers to pressing questions of situational awareness in succinct ways that no competing algorithm can yet match.
APPENDIX
A. PATH GENERATION METHOD: DETAILS
This appendix describes the path generation method in detail. Subsections A.1 through A.3 introduce the variables to which the later subsections refer. Subsection A.4 presents the probability distribution function used for the random generation of sojourn times. Subsection A.5 explains the truncation of the time interval that is performed before calling the main routine in the case where the vessel starts or ends the time interval of interest in a port. Subsection A.6 presents the main routine – the generalized divide-and-conquer algorithm. This algorithm often calls for the no-port divide-and-conquer algorithm, which is presented in subsection A.7.
A.1. Geographical data
The geographical data needed to support the path interpolation algorithm include land masses (where the vessel cannot pass) and ports (where the vessel may stop to visit).
Let G denote a set of polygons, where each polygon represents a land mass and is stored as a cyclic list of vertices. The set G will include all land masses of relevance to the problem. (In principle, it could include all the land masses in the world. But for the sake of computational speed, it is better to exclude all land masses that could not possibly affect the outcome, and in some cases to truncate the shape of large land masses of which only a portion could affect the outcome.)
Let P be a set of ports (given as points) that could conceivably be visited by the vessel. (Again, we exclude those that are too far away to affect the outcome.) Let m be the number of ports in the set P, and let the port positions in P be denoted P1, P2, … , Pm.
A.2. Input
Let A and B be the positions of the two reports between which we wish to interpolate the vessel's path, and let t A and t B denote the respective time stamps of those two reports. As further input, let port_A and port_B denote Boolean variables expressing whether the vessel is moored in a port at the two respective report times.
In general, we also want input variables declaring which port was visited most recently before t A, if known; and which port was visited soonest after t B, if known. Let q A be the index (according to the list P) of the last port visited before t A, and similarly let q B be the index of the next port visited after t B. In both cases, if the port in question is unknown (or not in the list P), the variable q A or q B takes the value zero. (These are both zero by default. Nonzero values are intended to be used sometimes when the algorithm is called recursively.)
A few useful numbers can be derived immediately from the inputs: Let d be the “Dijkstra distance” between A and B – that is, the distance along the shortest possible path from A to B, as determined by the Dijkstra algorithm [5] or something equivalent, avoiding the interiors of all the polygons of G. For all j from 1 to m, let a j be the Dijkstra distance between A and Pj, and let b j be the Dijkstra distance between B and Pj.
A.3 Parameters
Let v max denote the vessel's maximum speed, and let v pref denote its preferred speed. These parameters can (in principle) be inferred from the vessel type. Let  . (Note: In all cases we assume that v max > v min.) Let s min denote the minimum sojourn time (for a port visit), let s mean denote the mean sojourn time, and let s peak denote the peak sojourn time (in the sense of the maximum pdf value).
Let repeat_allowed be a Boolean parameter dictating whether a vessel can visit the same port twice in a row (without visiting another port in the interim). This would be TRUE for a small pleasure craft, for example, but FALSE for a merchant ship.
Let L (for “landlust”) be a parameter that is tied to the probability of making port visits (see subsection A.6). In principle, this factor should be derived from a study of vessel behaviour involving a large sample of real data.
Let τ min denote the minimum time-interval length, below which we will generally not subdivide a time interval.
Two different methods are used to find a feasible intermediate point, in the basic divide-and-conquer algorithm. (See subsection A.7, step 2(b).) The primary method is preferred because it has the virtue of being able, in principle, to generate any physically feasible path that one might imagine. However, there are circumstances in which it has difficulty finding a valid intermediate point. That is, a large number of random intermediate points sometimes need to be tried before a feasible one is found. In contrast, the secondary method is guaranteed to generate a valid intermediate point with a single attempt, but it lacks the primary method's ability to generate a great variety of paths. Let N frustration be the upper limit on the number of allowable consecutive failed attempts to find a feasible intermediate point, by the primary method, before resorting to the secondary method.
A.4. Sojourn times
A sojourn time s for a port stay will sometimes have to be chosen randomly. We want a fairly simple, smooth distribution having a positive lower bound but no upper bound. We use a “log-normal” distribution, shifted by s min, whose pdf has a peak at s peak and whose mean value is s mean. The pdf is zero for s ⩽ s min and is otherwise given by:

where:

A.5. Time interval truncation
If port_A OR port_B, we truncate the time interval before going on to the generalized divide-and-conquer algorithm. That is, we pick a departure time t dep and an arrival time t arr, we declare that the vessel does not move from t A to t dep or from t arr to t B, and we call the generalized divide-and-conquer algorithm (subsection A.6) with t A replaced by t dep and with t B replaced by t arr. (Exception: If A=B (the same position) AND port_A AND port_B AND NOT repeat_allowed, we simply assume that the vessel does not move.)
Let  and
 . (Note that we assume z>0.) Let f 1 be the function given by:
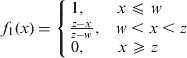
If port_A XOR port_B, randomly pick s (the total time spent in the port) according to the pdf given in subsection A.4. Then let f 2 be the function given by:
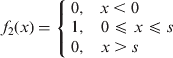
Now randomly pick u from a pdf given by normalizing the product f 1(u)f 2(u). (Note that if w ⩾ s, meaning that we have plenty of time to get from A to B, then this procedure means that u is picked from a uniform distribution between 0 and s. When less time is available for the transit, we cut short the port visit in order to avoid having to hurry.) If port_A then t dep=t A + u and t arr=t B, while if port_B then t dep=t A and t arr=t B−u.
If port_A AND port_B, randomly pick s A and s B (independently) each according to the pdf given in subsection A.4. (These numbers represent the total time spent in the two respective ports.) Let s 1=min(s A, s B) and s 2=max(s A, s B). Then let f 3 be the function given by:
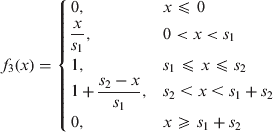
Now randomly pick u from a pdf given by normalizing the product f 1(u)f 3(u). Having found u, let u A and u B denote the portions of u taken from position A and position B respectively. We pick u A randomly from a uniform distribution between max(0, u−s B) and min(u, s A). Then let u B=u−u A. (Note that if w ≥ s 1 + s 2, meaning that we have plenty of time to get from A to B, then this procedure for determining u, u A, and u B is equivalent to simply picking u A from a uniform distribution between 0 and s A, picking u B (independently) from a uniform distribution between 0 and s B, and setting u=u A + u B. Again, when less time is available for the transit, we cut short the port visits in order to avoid the need to hurry.) The departure time is given by t dep=t A + u A, and the arrival time is given by t arr=t B−u B.
If port_A, then when the generalized divide-and-conquer algorithm is called from here, q A will take the value of the index (in P) of the nearest port to position A. Similarly, if port_B, q B will take the value of the index (in P) of the nearest port to position B.
A.6. Generalized divide-and-conquer algorithm
In this subsection, we describe the generalized divide-and-conquer algorithm as it applies to the case where NOT (port_A OR port_B). Otherwise, this algorithm is called according to the instructions of subsection A.5 – with t A of the present subsection taking instead the value of t dep, etc.
Step 1: Randomly pick s from the pdf given in subsection A.4. If s ≥ t B−t A, then there are no port visits along this trip – use the no-port divide-and-conquer algorithm instead (see subsection A.7). Otherwise, proceed to step 2.
Step 2: For all j in {1, 2, … , m}, let 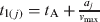 ,
 ,
 ,
 , and
 . (Thus t 1(j) is the earliest possible time for the start of a visit to the j th port, while t 4(j) is the latest possible time for the start of such a visit.)
Step 3: Randomly pick one of the options from the following list of m+1 possibilities: {port 1, port 2, … , port m, no port}. Relative probabilities are given to these options according to the following weights. The weight for the “no port” option is  . The weight λ j for the j th-port option is zero if (j=q AORj=q B) AND NOT repeat_allowed; otherwise:

(In the limit as the preferred and maximum speeds are nearly the same, each of these weightings becomes simply equal to twice the difference between the latest and earliest possible time of arrival at the port in question. We take a higher amount of flexibility to indicate a lower opportunity cost and therefore a preferred place to visit. The weight for the “no port” option must also have dimensions of time in order to be commensurate with the weights for the ports.)
Step 4: If the “no port” option was chosen in step 3, use the no-port divide-and-conquer algorithm from here (see subsection A.7). Else, let k be the index of the chosen port, and proceed to step 5.
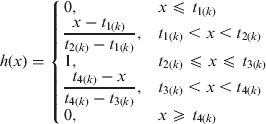
Step 5: If t 3(k)≥t 2(k), let h be the function given by:
Otherwise, let h be the function given by:
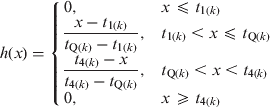
Now pick a random time t V (i.e., the time of the start of the visit to the k th port) from a pdf given by normalizing h(t V). (In the limit as the preferred and maximum speeds are nearly the same, only the first version of the function h can apply, and this distribution becomes uniform. We deviate from a uniform distribution in order to make it less likely to pick a time that forces the ship to go faster than its preferred speed before or after the port visit.)
Step 6: The generalized divide-and-conquer algorithm is called, recursively, twice – once from A (at time t A) to Pk (at time t V), with q A unchanged and q B taking the value k, and once from Pk (at time t V + s) to point B (at time t B), with q B unchanged and q A taking the value k.
A.7. No-port divide-and-conquer algorithm
In this subsection, we describe the version of the divide-and-conquer algorithm that is used when no port visits are involved.
Step 1: Let g 1 and g 2 be the functions given by:

Now randomly pick a speed v eff from a pdf given by normalizing the product g 1(v eff)g 2(v eff).
In our previous work (Hammond and Peters, Reference Hammond and Peters2009), we found that the basic divide-and-conquer procedure, given here as step 2 (below), tends to create paths that are strongly biased toward achieving the maximum speed. (This effect happens because the multiple recursive calls provide many opportunities to create an outlying point, which then forces a segment of the path to have nearly maximum speed.) In order to achieve a broader variety of speeds, and to respect the parameter v pref, we pick a speed v eff as described above, and we treat this latter speed as the maximum speed from here on.
Step 2: The main part of the no-port divide-and-conquer routine goes as follows:
(a) If t B−t A≤τ min, the vessel is assumed to follow the shortest possible path (as determined by the Dijkstra algorithm or something equivalent, avoiding the interiors of all the polygons in G), at a constant speed v min. Otherwise, proceed to step (b).
(b) Pick a time t int randomly from a uniform distribution between t A and t B. We use one of two methods to pick a random point X:
• If the number of failed attempts made so far (see steps (c) and (d)) is equal to N frustration, let X be a point along the shortest path from A to B, such that the distance from A to X along that path is taken from a uniform distribution whose minimum value is
 or zero (whichever is greater) and whose maximum value is or d (whichever is less). In this case the point X will automatically pass the tests of steps (c) and (d), so we can proceed directly to step (e).
• Otherwise, pick the point X randomly from a (2D) uniform distribution in the intersection of two circles, one centred on A and having a radius of
, and the other centred on B and having a radius of .(c) If X is at sea (i.e., not in the interior of any polygon in G), proceed to step (d). Otherwise, note a failed attempt to generate a random intermediate point, and go back to step (b).
(d) Let d A be the Dijkstra distance from A to X, and let d B be the Dijkstra distance from X to B (avoiding the interiors of all the polygons in G). If
, proceed to step (e). Otherwise, note a failed attempt to generate a random intermediate point, and go back to step (b).(e) The main part (step 2) of the no-port divide-and-conquer algorithm is called, recursively, twice – once from A at time t A to X at time t int, and once from X at time t int to B at time t B. (Keep the same value of v eff.)
 or zero (whichever is greater) and whose maximum value is
 or d (whichever is less). In this case the point X will automatically pass the tests of steps (c) and (d), so we can proceed directly to step (e).
 , and the other centred on B and having a radius of
 .
 , proceed to step (e). Otherwise, note a failed attempt to generate a random intermediate point, and go back to step (b).