


INTRODUCTION
Do informal institutions promote good governance in localities where formal democratic and bureaucratic institutions are weak? Or do they prevent local governments from functioning properly? Scholars find that in Latin America, Eastern Europe, and Central Asia informal institutions often breed clientelism, corruption, and mafia activities (e.g., Böröcz Reference Böröcz2000; Collins Reference Collins2003; O’Donnell Reference O’Donnell1996) and cause citizens to be excluded from the state’s public services (Narayan Reference Narayan1999). However, Sklar (Reference Sklar and Vaughan2003) suggests that traditional institutions in Uganda and Nigeria improve government performance and maintain regime stability. Tsai (Reference Tsai2007) shows that in the context of rural China, solidary groups, such as temple associations and village-wide lineage groups, hold government officials accountable and motivate them to provide more public goods.
Although a universal answer to the question may not exist, a clearer understanding of the role of informal institutions in specific social contexts deepens our knowledge of what determines good local governance. However, researchers on informal institutions often face challenges in defining and measuring informal institutions and in identifying their causal effects on governance outcomes (Helmke and Levitsky Reference Helmke and Levitsky2004). We attempt to address those challenges. We follow Helmke and Levitsky (Reference Helmke and Levitsky2004) and define informal institutions as rules and norms that are created and enforced by social groups rather than the state. In this article, we specifically focus on the set of informal institutions that could affect local public goods provision.
Public goods provision in environments of weak formal institutions faces two fundamental problems: (1) to convince community members, who are often in poor living conditions and have tight budget constraints, to contribute to public goods expenditure, and (2) to motivate local leaders to initiate necessary public projects, while preventing their moral hazard behavior, such as embezzlement and corruption, during the process of providing public goods. The first problem is essentially a collective action problem, while the second one is about local government accountability. If informal institutions are to promote local public goods provision, it is likely they either help solve the collective action problem among community members, or hold local officials accountable, or both.
Using a panel dataset of 220 Chinese villages from 1986 to 2005, we study the effect of informal institutions embedded in large and organized family clans on public goods provision and investigate the collective action and accountability mechanisms. Family clans are organized based on shared patrilineal ancestors and are regarded as the most important social groups in Chinese villages (e.g., Duara Reference Duara1988; Fei Reference Fei1946; Freedman Reference Freedman1958; Watson Reference Watson1982). Informal institutions of large clans are rules created and enforced by clans and often respected by villagers both inside and outside clans. Large clans may have disproportionate advantage over small clans because they have deeper historical roots in the village and are often better organized. As a result, they may promote local public goods provision by either helping the officials coordinate collective action or by holding them accountable.
The exact outcome variable in our analysis is the amount of public investment the village committee spent each year in the period of 1986–2005 after village elections were introduced. We focus on the postelection period because it is the period during which we have complete data on elected village chairpersons (VCs). The key independent variables are binary indicators of whether a village leader, such as an elected VC or an appointed village party secretary (VPS), came from the village’s largest or second-largest clan. Our theoretical premise is that leaders from these two clans have access to richer and stronger informal institutions than leaders from small clans. Specifically, there are two possible channels that a village leader might be affected by his own clan when he attempts to initiate a public investment project: (1) he could get help from his clan and use the clan’s social power to mobilize resources from villagers, and (2) he might be morally bounded by the rules of his clan such that he would make good use of existing resources. In either case, large clans dominate small clans in terms of public goods provision because of their advantageous positions in the village. To further illustrate that it is the rules and norms of a large clan, rather than the number of its members, that matters, we use the information on whether a large clan kept records of family trees and whether it maintained a lineage hall since the beginning of the observed data period to create indicators of clan cohesiveness and investigate how the effect of informal institutions changes due to changes in the level of cohesiveness.
Because variations of informal institutions in existing quantitative studies are usually cross-sectional, it is often difficult to identify the effect of informal institutions on governance outcomes. One can imagine a situation in which associational activities flourish in places with better infrastructure or rapidly increasing living standards. The positive correlation between associational activities and public goods provision does not necessarily imply that the former, which are sometimes used as proxies for informal institutions, cause the latter. Controlling for time-invariant heterogeneity would alleviate this concern of omitted variables to a great extent. In this article, we exploit the advantage of the panel data structure and only look at the within-village changes of public goods expenditure due to within-village changes of informal institutions associated with village leaders. To the extent that informal institutions affect local governance, we would then expect to observe systematically different policy outcomes produced by village leaders of different clans within the same village.
Our research design, therefore, is to compare the level of public goods expenditure during the terms of village leaders who came from the village’s two largest clans and the terms of the others within each village (focussing on the largest clan gives qualitatively the same results). We primarily focus on VCs instead of VPSs because we have more complete data on the former than the latter. To address the concern that electoral outcomes might be endogenous to public goods expenditure—for example, villagers expect leaders from large clans to provide more public goods and, therefore, elect them into office—we conduct a regression discontinuity analysis based on elected VCs as a robustness check for our main results.
Setting the study in the context of rural China has several advantages. First, because of the large scale of the country, there is enough variation in the lineage composition of a village. Forms, origins, and functions of the institutions associated with lineage groups are relatively well understood by scholars (e.g., Duara Reference Duara1988; Fei Reference Fei1946; Freedman Reference Freedman1958; Tsai Reference Tsai2007; Wang Reference Wang1996; Watson Reference Watson1975), which makes it considerably easier to understand how such informal institutions work than in other less researched contexts. Second, Chinese villages are relatively homogeneous in other aspects and subject to similar social and political shocks at the provincial or national level. This aspect makes them better comparison groups of each other than nations in cross-country studies. Third, Chinese villages were largely autonomous in terms of determining and financing public goods in the period of our study. Fourth, the introduction of village elections in the mid-1980s offers a rare chance to examine the influence of both formal and informal institutions.
Our empirical analysis shows that during the terms of VCs of the two largest clans (hereafter, VCs of large clans), the amount of village public investment increased by more than 35 percent on average as compared with the amount during the terms of other VCs. A VPS of the two largest clans (VPS of large clans) also increased the average level of public investment considerably. We interpret these results as evidence that the informal institutions of lineage groups, rather than village leaders of a certain kind, led to more public goods expenditure and, presumably, better local governance. We show that the association between VCs of large clans and public goods expenditure is stronger in places where large clans appeared to be more cohesive (i.e., clans that had maintained lineage halls since or before the onset of elections). Combined together, these results indicate that it is informal institutions of the clans from which village leaders originated that drive our main finding.
In addition, we explore two mechanisms through which informal institutions of large clans may facilitate public goods provision: (1) the collective action mechanism and (2) the accountability mechanism. The collective action problem has been a central topic in political science since Olson (Reference Olson1965). Recently, researchers have been focusing on how informal institutions, rather than formal ones, help people overcome the collective action problem. For instance, after observing several long-standing, self-governing common property regimes, Ostrom (Reference Ostrom1990) argues that informal institutions work through (or are) a set of “self-enforcing rules that each community member commits himself or herself to follow” (p. 99). Banerjee and Iyer (Reference Banerjee and Iyer2005) suggest that persistent informal institutions may result in different levels of public expenditure because of the nature of collective action embedded in those institutions. In Africa, Habyarimana et al. (Reference Habyarimana, Humphreys, Posner and Weinstein2007, Reference Habyarimana, Humphreys, Posner and Weinstein2009) show that ethnic heterogeneity impedes collective action and the provision of public goods; however, the collective action problem can be alleviated by institutional improvements in monitoring, sanctioning, and enforcement.
In rural China, because village committees often lack measures to enforce levies on villagers, successful collection of levies requires villagers’ semivoluntary compliance. Sheer poverty in the countryside makes that difficult for a VC and his associates.Footnote 1 If a large proportion of villagers refuse to pay for a public investment project, village leaders’ efforts to provide public goods would be in vain without the help of the upper-level governments. We show that when VCs of large clans were in office, villagers paid more levies to the village committee, and the presence of village public investment projects is highly correlated with extra levies paid by villagers at almost all income percentiles. Our results indicate that with the help of the informal institutions of large clans, elected VCs were more able to enforce levies on villagers and to mobilize resources needed for providing public goods.Footnote 2
Sklar (Reference Sklar and Vaughan2004) and Tsai (Reference Tsai2007), among others, emphasize the mechanism of informal accountability. To test this hypothesis, we study the amount of administrative costs during each VC’s term. Administrative costs are mostly spent by the VC and his associates for their own consumption. Embezzlement and other forms of corruption may also be covered in this category of village spending. A decline of those costs, therefore, can be seen as a result of improved accountability imposed on the VC. However, we do not find evidence that the amount of administrative cost spent by VCs of large clans was smaller than that by VCs of smaller clans. Although we cannot entirely rule out the accountability mechanism, this piece of evidence suggests that the positive association between VCs of large clans and a higher level of public goods expenditure is unlikely to be a result of large clans’ superior ability to monitor the VCs.
We investigate two alternative explanations. First, VCs of large clans may be more competent than others. For instance, Munshi and Rosenzweig (Reference Munshi and Rosenzweig2013) show that elected representatives from large castes in rural India exhibit better observed characteristics, such as higher education, and provide more local public goods for their constituents. Second, gradual improvement of formal institutions, such as electoral rules and procedures, may also contribute to the association between VCs of large clans and public goods provision. As elections become more competitive, electoral outcomes are more likely to reflect the preferences of the constituents. Thus, it is possible that the probability of VCs of large clans being elected and increased public goods provision are moving in the same direction. We show that neither of these two possibilities is likely to be driving our results.
Apart from the informal institution literature and the literature on collective action and public goods provision, this article also adds to a large literature on village elections and grassroots politics in China (e.g., Manion Reference Manion1996, Reference Manion2006; O’Brien Reference O’Brien1994; O’Brien and Li Reference O’Brien and Li1999, Reference O’Brien and Li2000; Oi Reference Oi1999; Oi and Rozelle Reference Oi and Rozelle2000; Pastor and Tan Reference Pastor and Tan2000; Shi Reference Shi1999). More recently, Luo et al. (Reference Luo, Zhang, Huang and Rozelle2007, Reference Luo, Zhang, Huang and Rozelle2010) find that the introduction of elections increases total public goods expenditure and provision. Shen and Yao (Reference Shen and Yao2008) find that elections reduce village income inequality through the public goods channel. Martinez-Bravo et al. (Reference Martinez-Bravo, Miquel, Qian and Yao2011) show that the introduction of village elections has shifted accountability of village leaders from the upper-level government towards villagers and worsened the implementation of unpopular policies, such as tax collection and the One Child Policy. This article, instead of investigating the effect of elections per se, uses variations generated by elections to examine the causal effect of informal institutions on governance outcomes. To the best of our knowledge, this article is also the first to apply a regression discontinuity design to village elections in China.
INSTITUTIONAL BACKGROUND
Lineage Groups in Chinese Villages
Lineage groups are one of the most important social organizations in rural China. They are usually organized along the paternal line.Footnote 3 Fei (Reference Fei1946) suggests that in imperial times lineage groups served as a link between the imperial ruler and the grassroots and were used by the gentry to preserve the social and political power of their families. Fei finds that through lineage networks the gentry administrated charities and provided local public goods to command the moral height in the villages. Freedman (Reference Freedman1958) hypothesizes that lineage groups are substitutive social organizations in places where formal bureaucratic institutions are weak. He finds that lineage organizations were more developed in southeastern China than in the north because villages in the southeast were farther away from central political control.
After nearly one hundred years of radical social changes, there has been a startling withdrawal of the gentry from the rural political field.Footnote 4 However, researchers believe that there is still space for lineage groups to survive and flourish. Reformers and even revolutionaries had to take advantage of existing resources, including traditional institutions, to achieve their objectives (Perry Reference Perry2002). Lineage groups have proven resilient and, in many places, have survived extreme social and political changes (Wang Reference Wang1996).Footnote 5 Tsai (Reference Tsai2007) reports in her 2001 survey that 14 percent of the villages had one or more lineage halls.
Previous research on the Chinese village focuses on ideal types of social organizations, such as village-wide lineage groups. Subvillage lineage groups are thought to be not as effective in exercising social powers (e.g., Freedman Reference Freedman1958; Tsai Reference Tsai2007). However, the introduction of village elections may activate some of the functions of subvillage lineage groups. These groups are often organized around surnames or, when the village has only one surname, fang (house), that is, households who share the same grandparents or great-grandparents. In the absence of political parties or other modern political organizations, lineage groups can become vehicles for political mobilization. A clan can be as large as 100 households containing more than 400 villagers, although it may only constitute 30 percent of the total village population. Such a group, if well organized, can have a real impact on village governance. In this article, variation in informal institutions comes from these groups.
As a social organization, family clans in rural China have several features. First, as mentioned above, households within a clan consciously identify themselves as members of a closely bonded group. They often reside within geographical proximity and frequently interact with one another. A well-organized clan holds annual rituals and ceremonies, such as paying respect to ancestral tablets and offering sacrifices to ancestral spirits (usually at its lineage hall), to reinforce group identity (e.g., Freedman Reference Freedman and Freedman1967; Tsai Reference Tsai2007). Second, clan members often cooperate with each other to obtain material benefits. Before the communist revolution in 1949, clans in southern China often owned land, which gave a basis for clan members to cooperate economically. In the collectivization period, collective production teams were often organized by clans in the south. Although this happened mostly because of the geographic proximity of clan members’ residencies, economic ties within the clan were preserved (Watson Reference Watson1982). In the reform period, economic cooperation among clan members has shifted to other areas of shared interests. For example, rural entrepreneurs tend to hire relatives in their own firms (Oi Reference Oi1999, 69). Third, clan members share a sense of obligation to the group. Traditional ethics place a sacred value on loyalties generated by kinship and dense social ties. Moral standing is conferred to members who make contributions or bring material benefits to the group (Madsen Reference Madsen1984). Finally, leaders of the group, usually respected senior male members, come forward to enforce social norms and mitigate conflicts both within and outside the group.Footnote 6
Large clans may have disproportionate advantage in this regard. This is first and foremost related to the fact that they often have strong historical roots in villages. Many villages were founded by the largest clans in the first place. Watson (Reference Watson1982) reports that “it is common to find villages that contain one or two corporate lineages together with four or five loosely-defined surname groups” (p. 608). Small clans often consist of families that migrated into the village at a later stage. Because of that, large clans are usually better organized than small clans. In the past, they were often managed by a group of senior members led by zuzhang, or lineage chief, a position usually inherited by the most powerful family in the clan (often the family of the eldest son of the clans founder). Today, this more formal power structure has vanished. However, senior members still play a significant role. They are responsible for clan rituals and other collective activities (Cohen Reference Cohen1990).
Large clans thus are more likely than small clans to maintain lineage halls, hold clan ceremonies, and keep lineage genealogies. This increases their social cohesiveness and members’ sense of belonging. In addition, seniors of large clans are more likely to participate in village affairs. Many villages have a seniors' association that is recognized by the government as a vehicle to serve the needs of the senior. However, village leaders often consult the members of the association on important village affairs. Seniors from large clans naturally become the leaders of the association. As a result, their influence can reach beyond their own clans. Their social power originates from both their clans’ clout and their reputation of looking after village public interest.
Against this background, village leaders from large clans can have significant advantages over ones from small clans because it is likely that they can only mobilize informal organization resources from their own clans. Informal institutions embedded in large clans can facilitate collective action among villagers through both persuasion and social sanctioning. When contribution from villagers is needed for a public project, a village leader from a large clan can approach his clans seniors to ask for help. Resorting to their prestigious social status, senior members of the clan are able to persuade villagers both inside and outside the clan to support the village leader’s project and to enforce clan rules and norms when it comes to financial contribution.Footnote 7 When a nontrivial proportion of the villagers support the project, social pressure forces the rest of the villagers to contribute their fair shares; otherwise, they may face severe social sanctions.Footnote 8
A piece of anecdotal evidence from Zhejiang Province in eastern China illustrates how the collective action mechanism might work:
My father used to be the zuzhang (lineage chief) of our clan. The village chief (chairman of the village committee) was also a member of the clan. Whenever the village committee had some great undertakings to accomplish, like collecting money for building a road, he came to my father and other seniors of the clan. If the seniors thought the chief’s plan could work, they would convene a meeting of household heads, together with the village chief, to convince the villagers to support the project, either by giving money or donating working hours. Since in our village, the majority of households are from the Fu family, the meeting is almost like a villagers’ assembly. People took it quite seriously. They trusted my father because they thought he’s impartial and experienced. The seniors didn’t enjoy formal titles, and they didn’t take charge of daily matters, but they were (moral) authorities of the village. Footnote 9
The above discussion suggests that the population rank order of a clan is a good proxy for the strength of informal institutions that a village leader can rely upon. Even if the sizes of clans are not drastically different, large clans (the largest clan in particular) are more likely to be well organized and enjoy greater social power. In the empirical analysis, our key explanatory variables are dummy variables indicating whether a VC or VPS came from the largest or second largest clan, which we believe summarize most of the information relevant to our study.Footnote 10
Village Self-government, Elections, and Public Investment
Village self-government was reorganized by the CCP in the late 1970s after the abolition of the rural commune system. Village committees are designated as a “self-government organization” according to the Chinese Constitution. A village has two self-governing bodies: a village committee, which usually consists of three to seven members, and a village party branch, which includes several CCP members in the village. Village leaders are predominantly male. The VC, who has been democratically elected after village elections were introduced in the mid-1980s, leads the village committee. The position is also sometimes called the village chief or village head. The VPS leads the village party branch. Very often the village committee and village party branch overlap. Existing English and Chinese literature suggests that village officials are “sandwiched” between villagers and the township government, the lowest level of government (O’Brien and Li Reference O’Brien and Li1999; Oi and Rozelle Reference Oi and Rozelle2000; Zhang Reference Zhang2007). They are supposed to be accountable to villagers, but they are also expected to fulfill tasks assigned by the township government.
Village elections first took place in Yishan County in Guangxi province as the People’s Commune was dismantled in the early 1980s (Tan Reference Tan2006, 59–63). Inspired by villagers’ self-initiated acts, the CCP promoted village elections as an effort to address the information problem of holding local officials accountable and to improve local governance. To minimize risks, such as the state losing control of villages and compromising unpopular government policies, the government’s democratization reform was gradual and highly controlled (O’Brien and Li Reference O’Brien and Li1999; Unger Reference Unger2002). In 1987, a temporary version of the Organizational Law of the Village Committee (OLVC) was put into effect and village elections began to be formally introduced in most provinces. The formal version of the law was announced in 1998. Since then virtually all the villages have begun elections.
VCs are elected for three-year terms without term limits. Usually a handful of candidates are nominated in each election and a primary is held to reduce the number of candidates to two. The final round is run between these two front runners. Overt campaigning is not common in village elections (O’Brien and Han Reference O’Brien and Han2009; Pastor and Tan Reference Pastor and Tan2000). When elections were first introduced to villages, the township government maintained control of the nomination process. Only after 1998 when the OLVC was formally adopted were nominations open to all villagers.Footnote 11 The timing of the introduction of elections was largely determined by the provincial government’s preferences.
One of the main jobs of the village committee is to provide village public goods (Oi and Rozelle Reference Oi and Rozelle2000). It is responsible for determining public goods investment, as well as raising most of the funds required for the investment. Because the village committee does not have the legal authority to tax people, the only way it can finance public investment is through collecting fees and levies (hereafter, levies, for simplicity). Although levies were allowed by the central government before 2006, their amounts were usually small. Village leaders had to turn to villagers to ask for more levies if the village was to undertake a large public project. Unlike in more institutionalized contexts in which paying local taxes is enforced by law, village leaders had to exert a large amount of effort to convince villagers to pay levies. The collective action problem arises when villagers’ semivoluntary compliance is required for local public goods provision. This problem partly explains why scholars find that public goods were severely underprovided in rural China (e.g., Luo et al. Reference Luo, Zhang, Huang and Rozelle2007, Reference Luo, Zhang, Huang and Rozelle2010; Zhang et al. Reference Zhang, Fan, Zhang and Huang2004).
DATA AND RESEARCH DESIGN
Data
This article mainly uses a panel dataset of 220 villages from 1986 to 2005 from the Village Democracy Survey (VDS), a unique retrospective survey conducted by Gerard Padró i Miquel, Nancy Qian, and Yang Yao. The villages were selected from the sample of the National Fixed-Point Survey (NFS), a longitudinal survey maintained by China’s Ministry of Agriculture.Footnote 12 We depict the locations of the sample villages (the counties that they belong to) in Online Appendix Figure A1. In 2006, the VDS recorded the history of electoral reforms, traditional organizations, and public goods expenditure. In 2011, the VDS team returned to the same villages to collect data on village clan structure and more information on traditional organizations and elected village leaders.
Data of electoral outcomes and public goods expenditure are obtained from village records, hence, concerns from report errors were minimal. Because the VDS only collected information of elected VCs, we only use observations in the postelection period to study the effect of informal institutions. However, focusing on the postelection period gives us the advantage of isolating the effect of informal institutions from that of electoral reforms.Footnote 13
Information of lineage groups, including the identities of clans (surnames), their relative sizes as measured by shares in the village population, facilities they maintained, and activities and ceremonies they held, draw up on the collective responses of current and former living village leaders and elders, who were invited together to respond to the surveyors. The VDS recorded information on the four largest clans. Although there could be measurement errors in the exact number of villagers in each clan, villagers typically had consensus on the rank order of clan size in their villages. Therefore, we believe that the rank order was precisely recorded.Footnote 14 Moreover, because the Chinese government strictly prohibits permanent migration from rural areas, radical changes of the village social structure are less of a concern.Footnote 15 Since the VDS also recorded information of the elected VCs, we can identify the clan each VC belongs to by matching his surname with that of the clan’s.Footnote 16 The VDS asked if a large clan kept records of its family trees (genealogies) or maintained a lineage hall. We use this information to form our measure for clan cohesiveness.
The VDS data are supplemented by annual data collected by the NFS. The control variables we use in this article, such as village population, village household income, and village assets, come from the NFS. Data of levies that households paid to the village committee also come from the NFS.
The data we use have several merits. First, the information contains the most comprehensive data on village-level reform and governance outcomes in China. They cover a large and nationally representative sample and span a long period of time. Second, the panel structure, as well as the relatively large sample size, allows us to control for not only village and year fixed effects, but also time trends at the provincial level and even the village level. Village and year fixed effects account for unobserved time-invariant factors within each village and shocks that affect all villages in a given year, respectively. Time trends at the provincial or village level capture growing social and economic divergences across regions. Controlling for these factors eliminates a large number of potential confounders for the identification of the effect of informal institutions. For example, because village fixed effects allow us to make the comparison within villages, confounding factors associated with geography are effectively controlled for. Third, the quantitative data we have are mostly based on administrative records and, therefore, are comparable across villages and not likely to suffer from recall biases. Moreover, because the electoral outcomes and public investment data were collected directly from village records, they are not likely to be manipulated by village officials.
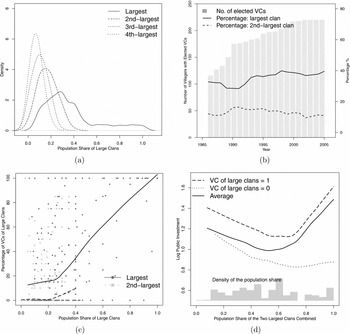
Figure 1a plots the distributions of the population shares of the four largest clans in sample villages. The average population shares of the largest and second-largest clans were 36 percent and 15 percent, respectively. In 2005, the average village in our sample had around 1,500 permanent residents. The average size of the largest clan in a village was thus around 400 villagers, or 100 households. Also, 81.8 percent of the villages did not have a lineage group that constituted the majority of the village population, and 74.5 percent of the villages had more than 10 surnames on the paternal side.
Large Clans, Elections, and Public Investment

Figure 1b shows the onset of village elections since 1986. More than half of the villages adopted elections in 1986 and most villages had at least one election by the mid-1990s. The solid and dashed lines in this figure show the proportions of elected VCs coming from the village’s largest and second-largest clans, respectively. On average, 35 percent and 13 percent of the VCs came from these two largest clans. Both numbers remained relatively stable over time. Even though lineage groups might have a big impact on local governance, they did not necessarily dominate village elections. Figure 1c plots the share of VCs of the two largest clans against their respective clan size. It is clear that large clans were not over-represented.Footnote 17 There are also large cross-sectional heterogeneities; some villages elected VCs of large clans all the time while others never did. This occurs probably because in some places large clans are well organized, while in other places, the upper-level government has a big influence on putting its favored candidates on ballots or getting them elected.
Public investment falls into six categories: schooling, roads and sanitation (water supply and sewer systems), electric power, irrigation, forestation, and others. Figure 1d plots the average log public investment against the combined population share of the two largest clans. The plot exhibits a nonmonotonic relationship between public goods expenditure and the size of the two largest lineage groups. There was more public goods expenditure in the most and least homogenous villages.Footnote 18 Such a relationship may be misleading, though, because the figure does not control for other variables. For example, many of the least homogeneous villages are located in coastal regions, so more investment in these villages could be because of higher levels of economic development. However, if we compare the amount of public investment during the terms of VCs from large clans and the amount during the terms of VCs from smaller clans, we find a clear gap between the two: when VCs of large clans were in office, there was more investment. Figure 1d illustrates that the gap was relatively stable across villages of different clan structures. Since we are looking at the raw data, though, this gap consists of variations both across and within villages.
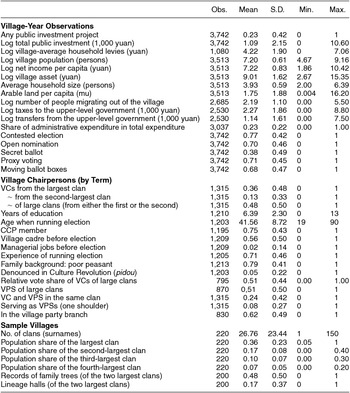
As mentioned earlier, among the elected VCs, 35 percent and 13 percent were from the largest and second-largest clans, respectively. The average VC was around 42 years old when he was elected and had received 6.4 years of formal education. Three quarters of them were CCP members and 56 percent were already village cadres when they ran for office. Among the 200 sample villages that have detailed information of large clans, 48 percent had a large clan keeping records of family trees; 17 percent had a large clan maintaining a lineage hall. Table 1 presents descriptive statistics of the variables used in the regression analysis, including the number of observations, mean, standard deviation, minimum, and maximum of each variable.
Descriptive Statistics

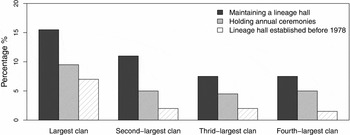
Our main explanatory variable is constructed on the population rank order of clans because we believe that large clans have richer and stronger informal institutions. Here we present some supporting descriptive evidence. Figure 2 illustrates the level of organization for the four largest clans in the sample villages. On average, the largest and second-largest clans were more likely to have maintained lineage halls and to hold clan ceremonies on a yearly basis. For example, among all largest and second-largest clans in the sample villages, 15.5 percent and 11.1 percent had lineage halls, respectively. In comparison, the numbers for the third- and fourth-largest clans are around 7.5 percent. Moreover, the probability of having a lineage hall that was established before the reform era is much higher for the largest clan than for other clans. In our empirical analysis, we focus on the largest and second largest clans to allow sufficient modelling flexibility.Footnote 19
Large Clans and Lineage Organizations

Main Identification Strategy
Our key independent variables are binary indicators of whether an elected VC came from the largest or second-largest clan in the village. Our baseline specification is the following fixed effects model:
 \begin{equation}
y_{it} = \beta _1 D_{it,1} + \beta _2 D_{it,2} + \eta _i + \delta _t + \epsilon _{it},
\end{equation}
where yit is the outcome variable (e.g., the log amount of public investment) for village i in year t; D it, 1 and D it, 2 are dummy variables indicating whether a VC was from village i’s largest or second-largest clan in year t, respectively; η i and δ t are village and year fixed effects; and ε it represents idiosyncratic shocks. The village and year fixed effects absorb time-invariant heterogeneities across villages and aggregate shocks that affect all villages in a given year, respectively. The identifying assumption is that, D it, 1 and D it, 2 are uncorrelated with the error terms {ε i1, ε i2, . . ., ε iT }. In other words, we assume that the choice of VCs is quasi-random with respect to the amount of public goods expenditure after both the independent and dependent variables are demeaned within each village and across villages in a given year. The parameters we are concerned about are β1 and β2; we expect that they are significantly positive.
We also add four sets of additional controls to the baseline specification. First, we control for provincial linear time trends to capture regional economic divergence. Second, we replace these trends with village-specific linear time trends to take into account trending factors at the village level. Third, we control for time-varying covariates from NFS to show that our finding is not driven by these variables. The covariates will be introduced later when we present the relevant robustness results. Fourth, we control for taxes/fees the village committee paid to the upper-level government and total transfers it received from it to capture the influence of the upper-level government. We also control for the number of villagers migrating out each year. However, these specifications may not rule out the impacts of other unobserved time-varying variables that are correlated with the choice of VCs and public goods expenditure at the same time. We will address this concern later using a regression discontinuity design.
When conducting robustness checks and exploring mechanisms, we also use the following simplified specification:
 \begin{equation}
y_{it} = \beta D_{it} + \eta _i + \delta _t + \epsilon _{it},
\end{equation}
where Dit is a dummy variable indicating whether a VC was from village i’s largest clan or second-largest clan in year t. As we will see from the baseline results, both β1 and β2 are indeed large and positive, and they are statistically indistinguishable from each other in most cases. Using the above simplification, therefore, does not lose much information.
MAIN RESULTS
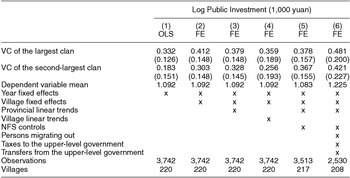
This section presents the baseline empirical results and some robustness checks. The main outcome of interest is public goods expenditure. We focus on the association between VCs of large clans and the amount of public investment during their terms in office. The dependent variable is the log amount of village investment (1,000 yuan).Footnote 20 Table 2 shows the baseline results, which are produced by the estimation of Equation (1) (except for column 1). In column 1, we show the raw result from an ordinary least squares (OLS) regression without controlling for village fixed effects; the estimated coefficients of both VC dummies are positive. In column 2, when both year and village fixed effects are controlled for, the coefficients of the two VC dummies are 0.412 and 0.303, respectively. Both are statistically significant at the 5 percent level. This means that a VC from the two largest clans is associated with 35 to 51 percent more expenditure in public investment. In column 3, we control for provincial linear time trends; the estimates remain stable. In column 4, provincial linear time trends are replaced by village-specific linear time trends. The estimates of interests are 0.359 and 0.256, similar to the baseline results. The standard errors go up quite a bit, and the dummy for the second-largest clan turns only marginally significant. In column 5, we go back to provincial linear time trends, but add five time-varying control variables from the NFS, namely, log village population, average village household size, arable land per capita, log income per capita, and log assets owned by the village committee. These controls capture the size, demographics, agricultural endowment, and economic resources of the village. The results are very similar to those in column 2.
VCs of Large Clans and Village Public Investment

Note: This table shows that the presence of a VC of large clans is associated with a larger amount of village public investment. Standard errors clustered at the village level are in parentheses. The dependent variable is the log amount of village investment (1,000 yuan) during that year. The independent variables are two dummy variables indicating whether a VC came from the village’s largest or second-largest clan, respectively. The sample is based on village-year observations from 1986 to 2005 after village elections were introduced.
Next, we consider the relationship between the village committee and the upper-level government. Two possibilities might affect the village committee’s ability to provide public goods. First, VCs of large clans might have better access to government funds, which were often crucial for investment projects. Second, because the village committee was obligated to follow directives coming from the township government, the amount of money the village committee paid to the township might have a great impact on the village committee’s budget constraints. Because of these concerns, in column 6, we additionally control for log total transfers the village committee received from the upper-level government and log total taxes and fees it handed over to the upper-level government each year. Moreover, to account for the impact of high waves of rural to urban migration since the beginning of the twenty-first century, we also add the total number of people migrating out of the village each year in the regression. All three variables are available for 208 villages after 1993. We find that the coefficients become even bigger.Footnote 21
In summary, the estimated coefficient of VC of the largest clan is very robust, remaining significant and varying only slightly when different controls are added. The coefficient of VC of the second-largest clan is also robust unless village-specific linear time trends are controlled for. These results show that the association between VCs of large clans and public goods expenditure is robust and not likely to be driven by trending factors, village-level economic and demographic changes, or differentiated support from the upper-level government. Because the coefficients of VC of the largest clan and VC of the second-largest clan are statistically indistinguishable from each other in most cases, in the rest of the article we use the simplified model of Equation (2).
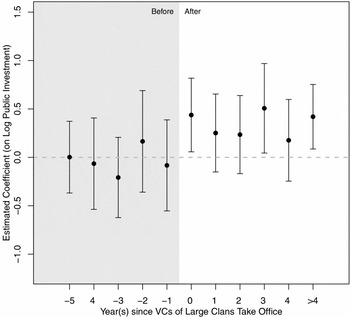
To establish a causal relationship between VCs of large clans and public goods expenditure, we need to be sure that the identifying assumption is valid. We are more confident that this assumption holds if we find that public goods expenditure increases right after VCs of large clans took office. To achieve this, we create a set of dummies dk , k = −5, −4, . . ., 0, 1, . . ., 4 where k = 0 indicates the year a VC of the two largest clans took office, and other values respectively correspond to a specific year relative to that year. For example, k = −1 indicates one year before the closest year when a VC of a large clan replaced a VC of a small clan, and k = 1 indicates one year after. All the years that were five or more years before are pooled together as the reference category indicated by k = −5, while k = 4 includes four or more years after the year a VC of a large clan took office. Then we estimate Equation (2) by substituting this new set of dummies for Dit . The estimated coefficients of the dummies are shown in Figure 3. Before VCs of the two largest clans took office, the estimates are mostly negative and statistically insignificant. The coefficients turn positive and statistically significant only after VCs of large clans took office.Footnote 22
Dynamic Effect of VCs of Large Clans on Public Investment

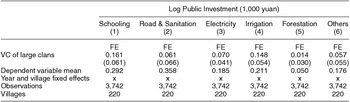
Because the VDS recorded the amount of investment by project type, we can check for which types of investment the association between VCs of large clans and public goods expenditure is stronger. The results based on Equation (2) are shown in Table 3. The dependent variable is the log amount of village investment by type. Table 3 suggests that strong associations exist between VCs of large clans and investment in facilities of village primary schools and irrigation infrastructure. Although irrigation infrastructure can be built only for the benefits of large clans, village primary schools are rarely discriminatory in rural China. Therefore, we can at least conclude that having village leaders from large clans also benefited the rest of the villagers in addition to clan members. Moreover, in the long run, we do not observe that the level of income inequality deteriorated more quickly in villages with large lineage groups.Footnote 23 The problem of clan capture seems to be less severe than one would otherwise expect.
VCs of Large Clans and Village Public Investment: by Project Type

Note: This table shows the associations between a VC of large clans and village public investment by project type. Standard errors clustered at the village level are in parentheses. The dependent variable is the log amount of village investment (1,000 yuan) of each type during that year. The independent variable is a dummy variable indicating whether a VC came from the village’s largest or second-largest clans. The sample is based on village-year observations from 1986 to 2005 after village elections were introduced. All regressions control for village and year fixed effects.
Clan Cohesiveness
To provide further evidence that it is the informal institutions of large clans that matter, we examine additional information on large clans in the sample villages. When a clan is more cohesive, it is more likely that it has greater social power in the village, as a result, its rules are more strictly enforced. Therefore, we expect the association between VCs of large clans and public goods expenditure to be stronger in villages with more cohesive large clans.
To test this hypothesis, we look at two indicators of clan cohesiveness: (1) whether the largest or second-largest clan kept records of family trees, and (2) whether they maintained lineage halls. We take these two variables as proxies for clan cohesiveness because they signify how closely clan members were connected with each other and whether a clan had sufficient organizational capacity. Records of family trees and lineage halls are specific to clans and signal a close relationship within the clan and frequent clan activities. Annual sacrificing activities, weddings, funerals and other clan events often take place in lineage halls.
It is possible that in villages with more public investment and better infrastructure, lineage halls could be more regularly refurbished for reasons that we cannot fully control for. To minimize such biases, the indicator of lineage halls is coded as one if they were built before the observed time periods and zero otherwise. Because maintaining records of the family tree requires persistent efforts of clan members, it is less likely to incur such biases.
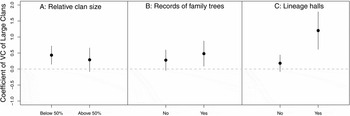
We interact VC of large clans with each of the two indicators of clan cohesiveness and put both the VC dummy and the interaction term in regressions using the baseline fixed effects specification. As a comparison, we also use a specification that includes the interaction between the VC dummy and a dummy variable indicating that the combined size of the two largest clans was above 50 percent (roughly the median). Figure 4 visualizes the results. Panel A of Figure 4 shows that the association between public goods expenditure and VCs of large clans is not increasing in the combined size of the two largest clans. However, panels B and C of Figure 4 show that when large clans appeared to be more cohesive, i.e., having maintained records of family trees and especially lineage halls (in 48% and 17% of the villages, respectively), VCs of large clans are strongly associated with more spending on public investment. These results suggest that what really matters for spending on public investment is not the number of people a large clan had, but the social aspect of the organization, likely the rules and norms it enforced.
VCs of Large Clans, Clan Size, and Cohesiveness

The Role of Village Party Organizations
Existing literature shows that VCs can face considerable constraints when exercising power (e.g., O’Brien and Han Reference O’Brien and Han2009; Oi and Rozelle Reference Oi and Rozelle2000). A VC not only receives orders from the township government, but is also subject to checks and even directives of the village party organization, especially the VPS. In fact, studies show that the power struggle between the VC and the VPS paralyzes village self-government in some places (e.g., Tan Reference Tan2010). Would the consideration of VPSs alter our main finding? For instance, would the VPS’s clan membership affect the VC’s ability to provide public goods? What would happen if the VC was also the VPS, which is called yijiantiao (literally, “one shoulder”)? What if the VC and VPS were from the same clan? Or what if the VC was in the village party branch, a sign that he was recognized and supported by the VPS?
Fortunately, the VDS includes data on the VPS and village party organizations for more than 130 villages, roughly 60% of the entire sample.Footnote 24 Such information allows us to answer the questions we just posed. Using names of VPSs and data on village clan structure, we define a dummy variable indicating whether the VPS came from the village’s largest or second-largest clan.
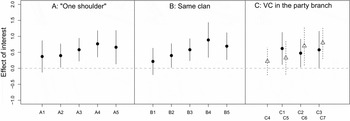
We first consider how “one shoulder” affects our results. For that purpose, we define a dummy variable indicating “one shoulder.” We include the VC dummy, the VPS dummy, the “one shoulder” dummy, as well as the interactions between the VC and VPS dummies and between the VC and “one shoulder” dummies in the baseline two-way fixed-effect model and visualize the result in panel A of Figure 5. Our specification allows us to compare five scenarios with the reference scenario in which both the VC and the VPS came from small clans and were not the same person: (A1) the VC and VPS were the same person but he was not from one of the two largest clans; (A2) the VPS came from one of the two largest clans while the VC came from a small clan; (A3) the VC came from one of the two largest clans while the VPS came from a small clan; (A4) both the VC and the VPS were from one of the two largest clans yet they were not the same person; and (A5) the VC and VPS were the same person and came from one of the two largest clans. Figure 5 shows that the average amounts of public investment of the last four scenarios are significantly higher than that of the reference scenario, after village and year fixed effects have been controlled for. The effect under the first scenario, i.e., “one shoulder” from a small clan, is positive but not statistically significant. Moreover, among the five scenarios, the level of public goods expenditure is highest under the fourth scenario, in which the VC and the VPS, though not the same person, were both from large clans. Those results indicate that “one shoulder” is less important than the clan membership of the VC and the VPS.
Village Leaders and Village Party Organizations

Next, we consider the effects when the VC and the VPS came from the same clan. The procedure is similar. Again, we estimate a “fully saturated” model using the baseline two-way fixed-effect specification and present the result in panel B of Figure 5. The reference scenario, in which the VC and VPS were from small and distinct clans, is compared with the following five scenarios: (B1) the VC and VPS were from the same small clan; (B2) the VPS was from one of the two largest clans while the VC was not; (B3) the VC was from one of the two largest clans while the VPS was not; (B4) the VC and VPS were from large yet distinct clans; and (B5) both the VC and VPS were from the same large clan. The last four comparisons give positive and significant estimates but the first does not. The highest level of public goods expenditure happened when the VC and the VPS came from distinct large clans (scenario B4). That is, the VC and the VPS did not have to come from the same clan as long as both of them came from a large clan.Footnote 25
Last, we investigate whether being in the village party branch enhances a VC’s ability to provide public goods. Again, we use a “fully saturated” model controlling for village and year fixed effects. Panel C of Figure 5 shows the results. The reference scenario is that the VC was not in the village party branch and neither the VC nor the VPS was from one of the two largest clans. There are seven scenarios to be compared with. In the first three scenarios, we have the VPS not from one of the two largest clans (the estimated effects of interest are depicted with dots) with one of the following three cases: (C1) the VC was the in the village party branch; (C2) the VC was from one of the two largest clans; and (C3) the VC was from one of the two largest clans and in the village party branch. The other four scenarios, whose estimated effects of interest are depicted with triangles, are when the VPS was from one of two largest clans with one of the following four cases: (C4) the VC was neither from a large clan nor in the village party branch; (C5) the VC was in the village party branch while not from one of two largest clans; (C6) the VC was from one of the two largest clans while not in the village party branch; and (C7) the VC was from one of the two largest clans and in the village party branch. The estimated effects of interest are positive and statistically different from zero in all but scenarios C1 and C5, in which the VC was in the party branch but not from one of the two largest clans. Also worth noting are that (1) all scenarios in which the VC was from one of the two largest clans have significantly positive estimates; (2) it is not necessary to require the VPS coming from one of the two largest clans to have more public goods expenditure as long as the VC was from one of the largest clans, a clear result when scenario C1 is compared with scenario C5; and (3) the effect of VPS coming from one of the two largest clans becomes insignificant if the VC did not, a result shown by scenario C4.Footnote 26
In summary, we not only show that the strong association between VCs of large clans and a higher level of public investment is robust when we take into account the roles of VPSs and village party organizations, but also find that the level of public investment is higher when the VPS was from a large clan than when he was not. However, we do not find enough evidence that the VC and VPS being the same person or from the same clan brought about additionally more public investment. Nor do we find that the VC being in the village party branch is particularly important for public goods provision once we control for clan memberships of the VC and VPS. Last, the role of the VPS diminished when the VC came from a large clan. In the rest of the article, we will mainly focus on the role of informal institutions associated with VCs primarily because (1) we have more complete data on VCs than VPSs, and (2) there are potentially more quasi-exogenous variations in the turnovers of VCs than VPSs—as we will see in the next section, these variations give us more leverage to identify the causal effect of informal institutions of lineage groups.
A REGERSSION DISCONTINUITY DESIGN
In this section, we employ a regression discontinuity (RD) design to address the potential endogeneity of electoral outcomes. Recall that we rely on elections as the source of variations of informal institutions that affect local governance. A natural question is why sometimes the largest clans won the election, while at other times they lost. We admit that the impact factors are complex and mostly beyond our knowledge. One obviously important factor is the CCP. To strengthen its rule in the countryside, the CCP has been trying to demobilize clans in elections. Our key identification assumption, though, is that those factors are uncorrelated with public investment, the outcome variable. Our fixed effects approach and additional controls of the provincial and village time trends, as well as other time-varying covariates, buttress this assumption. However, concerns of reverse causality and unobserved time-varying confounders remain. For example, villagers may expect VCs of large clans to provide more public goods and, therefore, elect them into office. A sharp RD design can address this concern because after conditioning on the forcing variable, the treatment indicator is uncorrelated with time-varying confounders at the cutoff. In our case, the forcing variable is the share of votes of a candidate from the largest or second-largest clan against the share of votes of a contender from a smaller clan.
Several caveats of employing an RD design in this study are worth noting. First, an RD estimate gives the local average treatment effect at the cutoff, which is 50 percent of all the votes. This quantity is not necessarily a quantity of interest and can provide very different estimates from those generated by the benchmark fixed effects models. One might be especially concerned about the external validity of an RD design in the Chinese context. Because formal democratic institutions are weak, elections may not be “allowed” to be close under many circumstances.
Second, although the treatment assignment mechanism is very clear in an RD design, in reality, the assignment mechanism may suffer from manipulation of the forcing variable by interested parties, making the RD design invalid. Evidence exists that an RD design fails regarding elections of US House of Representatives during a certain period of time (Caughey and Sekhon Reference Caughey and Sekhon2011).Footnote 27 Vote-buying, electoral frauds, and interference of the upper-level governments were widely observed by scholars for Chinese rural elections (e.g., Shi Reference Shi1999). Therefore, we may need to worry about the validity of an RD design in the context of rural China.
Third, an RD design typically demands a large amount of data. To construct an RD design, we need not only information of the elected VCs, but also information of their runoffs, including the lineage groups the latter belonged to and the votes they received in elections. These requirements cut the sample size to 2,230 village-year observations and 871 elected terms, compared with the original 3,742 observations and 1,315 terms. Dropped observations are mostly in early periods of the time series when village elections were not contestable (therefore no runoff information was recorded). Moreover, because we are interested in the effect of VCs of large clans and use VCs from small clans as comparison, only observations in which one of the candidates was from one of the two largest clans while the other was from a smaller clan are useful for constructing the RD design. This requirement further reduces the sample down to 715 observations and 253 terms.Footnote 28 Because the identification comes from close elections, the power of our RD analysis is limited.
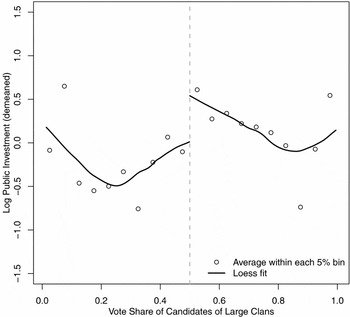
Bearing these concerns and limitations in mind, we present the main result of the RD design in Figure 6, which shows the averages of log investment within each 5 percent vote-share bin and two loess fits (from locally linear regressions) on both sides of the cutoff. The RD estimate is 0.573 with a standard error of 0.301; both are almost twice as large as the fixed effects estimates.Footnote 29 We find that the results from the RD design are consistent with our main finding and offer us more confidence that VCs of large clans causally increased public goods expenditure.
Robustness Check: A Regression Discontinuity Design

MECHANISMS
We have already shown that the presence of VCs from one of the two largest clans is associated with at least 35 percent more investment in public goods. In this section, we investigate two mechanisms, namely, the collective action mechanism and the accountability mechanism, through which informal institutions could possibly facilitate public goods provision.
First, we test whether the presence of VCs of large clans is connected with easier collective action among the villagers by using household-level data of levies that villagers paid to the village committee. As mentioned before, a VC needed to seek villagers’ voluntary compliance to collect levies from them. If VCs of large clans were more likely to collect more levies for public investment than VCs from small clans, we then have a critical piece of evidence to support the collective action mechanism.
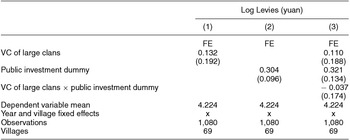
We have household-level data for around one-third of the sample villages.Footnote 30 Table 4 presents the results based on this sample. Using the baseline model that controls for both village and year fixed effects, column 1 shows that the presence of VCs of large clans is weakly associated with more levies. When a VC of large clans was in office, villagers on average paid 13.2 percent more levies a year. The estimated coefficient is not statistically significant, though, due to the large dispersion of the data. Column 2 regresses the log amount of levies on the public investment dummy when village and year fixed effects are controlled for. It shows that the amount of levies is highly correlated with the presence of public investment projects after time-invariant village heterogeneity and time-varying aggregate shocks are removed; the estimated coefficient is 0.304 and significant at the 1 percent level. In column 3, we put in both dummies and their interaction.
VCs of Large Clans and Levies

Note: This table shows that (1) the presence of a VC of large clans is weakly associated with more levies villagers paid to the village government and that (2) the presence of village public investment projects is strongly correlated with a higher level of levies. The dependent variable is the log amount of average levies villagers paid to the village government in a particular year. The independent variables include a dummy variable indicating whether a VC came from the village’s largest or second-largest clan, a dummy indicating any public investment projects during that year, and their interaction. Standard errors clustered at the village level are in parentheses. The sample is based on village-year observations of 69 villages, of which household level data are available, from 1986 to 2005 after village elections were introduced. All regressions control for village and year fixed effects.
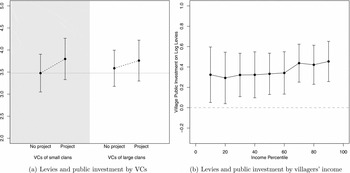
The result is visualized in Figure 7(a), which shows that no matter whether VCs of small or large clans were in office, villagers paid more levies when there are public investment projects. On average, though, when VCs were from large clans, villagers paid higher levies to the village committee because higher frequencies of public investment projects were observed during the terms of VCs of large clans. Figure 7(b) shows the immediate distributive consequences of public investment on levies. Each dot is an estimated coefficient from a separate fixed effects regression using levies that households at a specified village income percentile paid to the village committee as the dependent variable and the public investment dummy as the independent variable. It shows that both the rich and poor in the villages paid extra levies when there were public projects. Note that the regressions presented in Figure 7 and columns 2 and 3 of Table 4 do not imply a causal relationship between the presence of public investment projects and the amount of levies villagers paid to the village committee, because both variables are likely results of the presence of VCs of large clans. They show, however, that to make a public investment project happen, a VC often needs to convince the majority of the villagers to pay for it. To the extent that VCs from large clans took up more investment projects than VCs from small clans, this allows us to conclude that large clans help VCs overcome the collective action problem.
Public Investment and Levies on Villagers

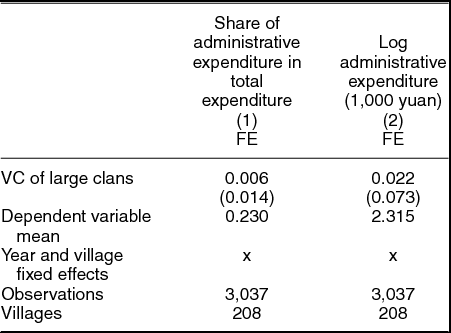
Second, we investigate if there is any sign that informal institutions of large clans hold VCs accountable. We look at the amount of administrative expenditure of the village committee. If a VC is subject to close scrutiny when using public funds, nonproductive administrative expenditure is most likely to be curbed. Previous studies have shown that electoral reforms in rural China caused a sharp decrease in the share of administrative expenditure in total expenditure of village committees (Wang and Yao Reference Wang and Yao2007). Using the baseline specification (Equation (2)) and both the share of administrative expenditure in total expenditure and the log amount of administrative expenditure as outcome variables, we show that VCs of large clans and administrative expenditure have almost zero correlation after village and year fixed effects are controlled for (Table 5). Although we cannot rule out the possibility, we do not find strong evidence for the informal accountability mechanism.
VCs of Large Clans and Administrative Expenditure

Note: This table shows that the association between VC of large clans and village administrative cost is close to zero after village and year fixed effects are controlled for. Standard errors clustered at the village level are in parentheses. In column 1, the dependent variable is the share of administrative expenditure in total village expenditure in that year. In column 2, the dependent variable is the log administrative expenditure (1,000 yuan). Both are from the NFS data. The independent variables are a dummy variable indicating whether a VC came from the village’s largest or second-largest clan. The sample is based on village-year observations from 1986 to 2005 after village elections were introduced. Both regressions control for village and year fixed effects.
ALTERNATIVE EXPLANATIONS
In this section, we discuss two alternative explanations for the observed association between VCs of large clans and more public goods expenditure, including (1) superior ability of VCs of large clans, and (2) improvement of formal institutions.
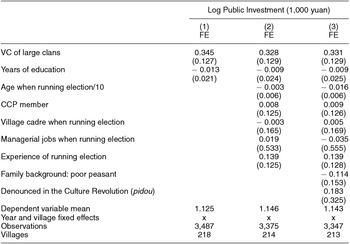
First, do large clans select more competent leaders? Munshi and Rosenzweig (Reference Munshi and Rosenzweig2013) find that in Indian parochial elections, castes with large population shares help select leaders with superior observed characteristics, such as providing more public goods. It is also possible that a successful entrepreneur from a large clan uses his or her resources and expertise to bring increased prosperity to the village.Footnote 31 To investigate these possibilities, we compile data of VCs’ characteristics, including years of formal education, age, administrative experience, experience of running businesses, CCP membership, historical family background, etc.Footnote 32 We control for these characteristics in the regressions. The results are shown in Table 6. The estimated coefficient of the VC of large clans remains almost unchanged. In fact, VCs’ observed characteristics, such as education and administrative experience, do not seem to have any predictive power for the amount of public investment.Footnote 33 The evidence does not support that lineage groups in rural China helped select more competent leaders.
Large Clans, VCs’ Characteristics, and Village Public Investment

Note: This table shows that the association between a VC of large clans and village public investment is robust when we control for the VC’s characteristics. Standard errors clustered at the village level are in parentheses. The dependent variable is the log amount of village investment (1,000 yuan) in that year. The independent variable is a dummy variable indicating whether a VC came from the village’s largest or second-largest clan. The sample is based on village-year observations from 1986 to 2005 after village elections were introduced. All regressions control for village and year fixed effects.
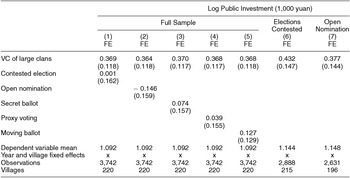
Another explanation is improvement in formal electoral institutions. As formal institutions improve, it is possible that elected leaders are more likely to implement policies catering to the median voter’s interest, such as providing more public goods. It is also possible that under better formal institutions, officials elected into office have preferences that are more in line with preferences of the voters. These preferences might not have been captured by VCs’ observed characteristics, but might be correlated with clans where VCs come from. Because our dataset has detailed information of electoral rules and procedures, including contested elections (an election is contested when there are more candidates than positions), open nomination, secret ballots, proxy voting, and moving ballot boxes, we can test if our main results are driven by changes of these indicators.Footnote 34 The results are shown in Table 7. As expected, our main finding is robust when we control for these indicators in the regressions. In fact, the institutional variations over time have very limited explanatory power for the variations in the amount of public investment. Moreover, the estimated coefficients of the VC dummy are slightly bigger in two subsamples where contested elections and open nomination had been introduced, respectively.
VCs of Large Clans, Electoral Institutions, and Village Public Investment

Note: This table shows that the association between a VC of large clans and village public investment is robust when we control for formal electoral institutions and procedures and when we use subsamples of contested elections and open nomination. Standard errors clustered at the village level are in parentheses. The dependent variable is the log amount of village investment (1,000 yuan) in that year. The independent variable is a dummy variable indicating whether a VC came from the village’s largest or second-largest clan. Columns 1–5 use the full sample, which includes village-year observations from 1986 to 2005 after village elections were introduced. Columns 6 and 7 use subsamples in which contested elections and open nomination were introduced, respectively. All regressions control for village and year fixed effects.
CONCLUSION
In the context of rural China, we find that informal institutions of lineage groups—rules and norms created and enforced by lineage groups—facilitate local public goods provision. Using fixed effects models as the main estimation strategy and a regression discontinuity design as a robustness check, we show that the presence of village chairpersons of large clans increased local public goods expenditure considerably. Such a relationship is stronger in villages where large clans persistently maintained lineage halls. Our finding is robust when we consider the roles of village party secretaries and village party organizations, as well as alternative explanations, such as superior observed characteristics of VCs of large clans and improved formal electoral institutions. This article is among the first attempts to study the causal effect of informal institutions on governance outcomes.
We explore two possible channels: (1) informal institutions facilitate collective action of financing public goods among villagers, and (2) informal institutions hold VCs accountable to villagers. We show that the collective action channel is better supported by data. We find that villagers at almost all income percentiles paid extra levies to the village committee when there were public investment projects. However, we find little evidence that informal institutions held village officials accountable: on average the amount of administrative cost did not change when VCs of large clans were in office.
Two questions are not fully answered by this article and require future research. The first is the possibility that large clans capture grassroots politics. The evidence presented in this article suggests that large clans might have improved local governance in rural China in one specific aspect, namely, spending on public investment. However, it is possible that we do not measure outcomes that deteriorated because of clan power. For example, public goods expenditure as we have measured might have benefited members of large clans much more than the rest of the villagers, or VCs of large clans filled their pockets and those of their clan members’ as they provided public goods. Large clans might collude with township officials to capture local politics as well. But because we do not have information on corruption or who used what public facilities, these consequences are not reflected by our study.
The fact that we do not observe clan capture might be due to that leaders of large clans were under tight control of the CCP. Although open nomination of candidates is the de jure procedure in village elections, the CCP, especially its organ at the township level, heavily intervenes in the nomination process. Moreover, as we discuss in the article, the exercise of power of the VC is constantly checked by the CCP. Such a unique institutional arrangement may limit the generalizability of our finding. For example, in places where local leaders are not closely monitored and controlled by other parties or the upper-level government, informal institutions may enable leaders to extract rents from constituencies or target transfers to a narrow group of supporters.
The second question that requires more research is the co-evolution of formal and informal institutions. How do changes of formal institutions affect the functioning of informal institutions and how do political actors embedded in informal institutions respond to changes of incentives due to formal institutional changes? In this article, we attempt to identify the effect of informal institutions in the context of rural democracy. Unfortunately, we cannot compare the effect before and after the introduction of elections due to data limitations. An equally interesting question is how the role of informal institutions has changed since the tax-and-fee reform deprived villages of their autonomous status of finance.
SUPPLEMENTARY MATERIALS
To view supplementary material for this article, please visit http://dx.doi.org/10.1017/S0003055415000155.





Comments
No Comments have been published for this article.