Introduction
Understanding the spatial distribution of species and habitats at multiple spatial scales is of central importance to ecology (He & Legendre, Reference He and Legendre2002; Harte et al., Reference Harte, Conlisk, Ostling, Green and Smith2005). Patterns in the distributions of species and habitats across space provide information critical to our ability to interpret the forces that structure and maintain ecological diversity (Gaston & Blackburn, Reference Gaston and Blackburn2000), particularly over time (Gardner et al., Reference Gardner, Cote, Gill, Grant and Watkinson2003). There is evidence that the spatial integrity of key habitats at the landscape scale is important for the continued success of conservation areas in a changing world (Saunders et al., Reference Saunders, Hobbs and Margules1991; Opdam & Wascher, Reference Opdam and Wascher2004), with both habitat loss and habitat fragmentation being of concern. Fragmentation is more than just the loss of habitat, but loss such that small, isolated patches are created, changing the properties of the remaining habitat (van den Berg et al., Reference van den Berg, Bullock, Clarke, Langston and Rose2001). In coral reef environments, many studies have investigated temporal changes in fine-scale patterns in reef structure (e.g. Bak et al., Reference Bak, Nieuwland and Meesters2005) or regional patterns (Gardner et al., Reference Gardner, Cote, Gill, Grant and Watkinson2003), but few have investigated mesoscale change, at the scale of landscapes (~hundreds of m to tens of km; Turner et al., Reference Turner, Gardner and O'Neill2003). It is crucial, as we are experiencing worldwide declines in coral reef habitats, to understand how local, regional and global impacts combine to affect the reef's structure.
The island of Bonaire, Dutch Caribbean, represents a unique, long-established Marine Protected Area (MPA). The Bonaire Marine Park (BMP) was established in 1979, after a series of other marine conservation measures, including increasing protection for turtles (1961), prohibitions on spear fishing (1971) and protection for corals, living or dead, from removal, damage by anchor dropping, and contact from divers (1975). In 1991 two marine reserves were simultaneously established that excluded underwater visitors, and the BMP was given full protection out to the 60 m depth contour. In 1999, the BMP gained national status as a park of the Netherlands Antilles and became the Bonaire National Marine Park (BNMP). Owing, at least in part, to the long-term protection they have received, the reefs of Bonaire are thought to be amongst the most ‘pristine’ coral reef environments in the Caribbean (Stokes et al., Reference Stokes, Leichter and Genovese2010).
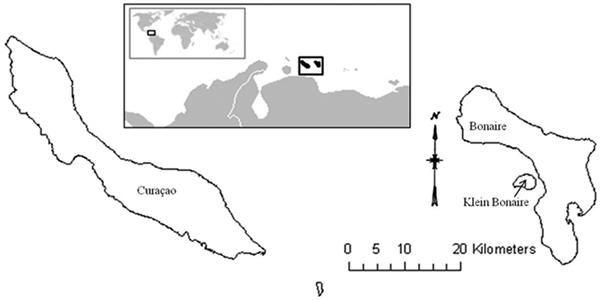
In 1985, Dr Fleur van Duyl published the Atlas of the Living Reefs of Curaçao and Bonaire (Netherlands Antilles), comprehensively mapping the coral reefs off the leeward coasts of Bonaire and Curaçao, an island to the west of Bonaire (Figure 1). The map classified the subtidal substratum into dominant benthic community types out to 10 m depth based on data collected by low-altitude aerial photography and ground-truthed extensively by scuba diving in the early 1980s. Van Duyl (Reference van Duyl1985) found coral to be the dominant bottom-type, making up around 62% of the benthos off the leeward side of Bonaire in shallow water (<10 m). The total amount of coral cover was made up of nearly 40% Acropora cervicornis and 40% head coral, with the most common head corals being Montastraea annularis, M. cavernosa, Diploria strigosa, Siderastrea siderea, S. radians, Dichocoenia stokesii, Colpophyllia natans, Porites astreoides, Meandrina meandrites and Stephanocoenia intersepta. Head corals in this group were sometimes accompanied by the foliate Agaricia spp. and finger corals were often present in this group (van Duyl, Reference van Duyl1985). Since van Duyl's work was completed, cover of A. cervicornis has dropped to nearly zero, but increases in the head coral group have occurred at various locations along the coast (Relles & Patterson, unpublished).
The islands of Bonaire and Curaçao are located in the Dutch Caribbean, about 80 km north of Venezuela.

Satellite remote sensing has proven to be an effective technique for creating benthic habitat maps in coral ecosystems at coarse habitat resolution (3–4 bottom-type classes) and less than 20 m deep (Mumby et al., Reference Mumby, Green, Edwards and Clark1997, Reference Mumby, Clark, Green and Edwards1998; Mishra et al., Reference Mishra, Narumalani, Rundquist and Lawson2006; Relles et al., Reference Relles, Jones and Mishra2012). Temporal change detection techniques (Jensen, Reference Jensen2005) can then be employed to compare changes in coral cover, or other substrata of interest, on a pixel-by-pixel basis, while computing total changes at the landscape level. The advantage of satellite remote sensing combined with change detection techniques is that total loss vs fragmentation can be rapidly quantified. Because fragmentation is a landscape-level process, fragmentation measurements are correctly made at the landscape scale (McGarigal et al., Reference McGarigal, Cushman, Neel and Ene2002; Fahrig, Reference Fahrig2003), but this has rarely been done on coral reef habitats. Decreases in patch size and increases in the isolation of patches lead to reductions in population connectivity and are of particular concern for small reef-dwelling organisms with limited adult ranges and could potentially affect reproduction or dispersal (Schroeder, Reference Schroeder1987). Coral reefs, like most habitats, offer a number of advantages to their denizens, including protection from predation and a location to forage and find mates. The complex structure of coral reefs provides the physical habitats and shelter sites that accommodate many size classes of associated organisms. The ability to make landscape-level maps of coral cover is important for conservation efforts and of particular interest to government officials and Marine Protected Area (MPA) managers. Coastal habitat maps are a fundamental requirement in establishing coastal management plans for systems like coral reefs (Cendrero, Reference Cendrero1989; Relles et al., Reference Relles, Jones and Mishra2012).
In this study, a recent (2008–2009) satellite-derived map of the reefs of Bonaire (Relles et al., Reference Relles, Jones and Mishra2012) is compared to the habitat maps (van Duyl, Reference van Duyl1985) from data collected in the early 1980s to identify areas of coral habitat loss and reef fragmentation. The changes in the spatial structure of these coral habitats between the two time intervals are described at the landscape scale using metrics of cover of coral and sand cover, fragmentation, patch size and connectivity between patches. These changes were evaluated in areas within the no-diving marine reserves and comparably sized unprotected sites to determine whether the lack of underwater visitors has had a significant positive impact on coral cover. The changes in reef structure associated with broad-scale disturbance from storms are also assessed by comparing areas exposed to and sheltered from predominant tropical cyclone tracks. This study complements previous research conducted at a finer-scale, from line transects and quadrats (Bak et al., Reference Bak, Nieuwland and Meesters2005; Steneck et al., Reference Steneck, Arnold and DeBey2011).
Materials and methods
Baseline data
The island of Bonaire is located in the southern Caribbean Sea, ~80 km off the coast of Venezuela (12°10′N 68°17′W; Figure 1). This study focuses on the reefs off the leeward coast of Bonaire, including the accompanying uninhabited island to the west, Klein Bonaire (Figure 2). Maps of dominant coral community type and other bottom-types (e.g. sand, rubble, shore zone and marine plants) were mapped in the early 1980s using aerial photographs and scuba diving to a depth of 10 m (van Duyl, Reference van Duyl1985). As an ancillary data source there is significant potential for error in the van Duyl (Reference van Duyl1985) dataset. The maps were created from aerial photographs taken from variable altitude and the scale of the photographs fluctuated. The maps were then constructed using the most recent base maps available at the time, which were from 1963 (van Duyl, Reference van Duyl1985). The atlas was digitized into images (TIFF format) and subsequently georectified using ArcGIS 9.3 (ESRI, 2010). To align the maps with the coast on the satellite images, between 12 and 18 control points were identified using the georeferencing tool in ArcGIS, which allowed features identified by van Duyl (Reference van Duyl1985) to be aligned to the satellite images (e.g. distinct terrestrial features of coastal morphology, piers and other permanent structures). Based on the control points, ArcGIS was used to compute spatial residual error values, a measure of the fit between the true location on the image itself and the transformed locations of the output control points. Control points with the highest levels of error were then removed until the total root mean square error (RMSE), a statistical measure of the magnitude of variability between the shape of the original file and the shape of the georectified file, was less than 9, without dropping the total number of control points below six. The resulting benthic habitat maps were saved as raster files. Van Duyl's (Reference van Duyl1985) 30 maps of Bonaire's leeward reefs varied with respect to the presence of distinctive features to identify along the present coastline in the satellite images and therefore in the number of useful control points and this is a potential source of error in the resulting raster datasets. Polygon vector shapefiles were drawn manually around each of van Duyl's original bottom-types using the editor function of ArcGIS 9.3 (ESRI). After creation of these polygons based on the van Duyl (Reference van Duyl1985) maps, bottom-types were reclassified into the coarser class distinctions of coral, sand and sand/coral to match the discrimination capabilities of the satellite remote sensing techniques (Table 1). The polygons were then converted to raster files at a resolution comparable to the satellite imagery. While van Duyl mapped areas of coral with per cent cover ranging from 10–20, 20–40 and >40%, satellite data were coarsely classified as coral if they contained greater than 20% coral cover. For this reason, areas considered to be 10–20% coral by van Duyl's classification were included in the sand/coral mixture class.
The outline map (A) shows the entire island of Bonaire and neighbouring island of Klein Bonaire. The north-west coast of the island (a), the central coast (b), and the southern coast (c) are inset. The locations of the exposed (MR1) and sheltered (MR2) marine reserves and adjacent exposed (nMR1) and sheltered (nMR2) non-reserve sites (B). Klein Bonaire showing the sheltered and exposed sides of the island (C).

Van Duyl's classifications on the left reclassified into the coarser classification system discernible by the satellite remote sensing method for the 2008–2009 maps. Coral cover greater than 20% (van Duyl, Reference van Duyl1985) was classified as coral under the coarser classification system and sand cover greater than 50% (van Duyl, Reference van Duyl1985) was classified as sand.

Satellite-derived data ground-truthed from scuba surveys and CPCe
Three multi-spectral, high-resolution (2.4 m pixel) images from the QuickBird (QB) satellite acquired in 2008 and 2009 along the leeward coast of the island of Bonaire, including the small, uninhabited neighbouring island of Klein Bonaire, were prepared and analysed to create benthic habitat maps. This required a first-order atmospheric correction, which removed the scattering effects of light and other electromagnetic radiation by particles smaller than the wavelength of light (Rayleigh scattering) and the scattering of radiative energy by processes at the aerosol and molecular level, particles larger than the wavelength of light. The effects of variable depth were accounted for using the model derived by Lyzenga (Reference Lyzenga1978, Reference Lyzenga1981), Mumby et al. (Reference Mumby, Green, Edwards and Clark1997) and Mishra et al. (Reference Mishra, Narumalani, Rundquist and Lawson2006) in order to remove water column attenuation effects. Tidal stage at the time of acquisition of the satellite images was insignificant; Bonaire has a micro-tidal range, with a mean tidal range of around 10 cm (Kjerfve, Reference Kjerfve1981). As a result, any tidal variation between datasets used in this study were within our observational measurement error. Estimating the bathymetry allowed the effects of particulates and chlorophyll in the water, as well as bottom albedo, to be removed from the imagery (detailed in Relles et al., Reference Relles, Jones and Mishra2012). After these corrections, an image of the remote sensing reflectance from the bottom comprised of three bands (red, blue and green) was analysed using the computer program ERDAS® Imagine. The Iterative Self Organizing Data (ISODATA) algorithm was used to perform an unsupervised classification of the benthos into 10 classes based on the optical properties of the pixel (Jensen, Reference Jensen2005; Mishra et al., Reference Mishra, Narumalani, Rundquist and Lawson2006). Those classes were then named and grouped together based on the dominant benthos found in each, which was ascertained by visual scuba surveys collected in January 2008. Seventeen underwater video transects were collected along the leeward coast out to a depth of 20 m and analysed as individual screenshots using the program Coral Point Count with Excel® Extensions (CPCe; Kohler & Gill, Reference Kohler and Gill2006). These groupings resulted in three coarse classes: sand, coral and a sand/coral mixture (Relles et al., Reference Relles, Jones and Mishra2012), which were then used to perform a supervised classification of the benthos. QB imagery has proven useful for such coarse classifications (3–4 classes) in coral reef habitats (Mishra et al., Reference Mishra, Narumalani, Rundquist and Lawson2006). Details on the algorithms for atmospheric and water column corrections, as well as the classification system, are described extensively in Relles et al. (Reference Relles, Jones and Mishra2012). The coral class included areas where live hard coral cover was greater than 20%, while the sand class had greater than 50% sand cover, generally the rest of the area was covered in the exposed calcium carbonate skeleton. The sand/coral mixture class contained some mixture of less than 20% hard coral and less than 50% sand with the additional cover attributed to the presence of octocorals, various marine plants, including Sargassum spp., or dead coral with algae based on video collected by scuba.
Several types of metrics can determine the accuracy of a classification; overall accuracy is simply the sum of correctly labelled test sites divided by the total number of test sites, while user accuracy is the probability that a classified pixel actually represents that category on the ground (Mumby et al., Reference Mumby, Green, Edwards and Clark1997). The overall accuracy of the classification system used here was 71%, with a user accuracy for the sand class of 94% and a user accuracy for the coral class of 50%. The lower level of user accuracy for the coral class is a potential source of error in the classification system for the satellite-derived 2008–2009 data set and could potentially result in a coral pixel being mislabelled as sand. Using this system a total of 6.8 km2 of reef along more than 50 km of leeward coastline was mapped out to a depth of ~10 m.
Harmonization of data
Prior to comparison of the two data sets (i.e. 1980s and 2008–2009), it was necessary to adjust the spatial resolution such that both data sets had the same resolution as the lowest resolution data set; in this case van Duyl (Reference van Duyl1985). The minimum mapping unit (MMU), which represents the minimum size of a polygon delineated by van Duyl (Reference van Duyl1985), and presumably the smallest habitat area discernible in the aerial photographs used to create the maps, was 9 m × 9 m (81 m2). The classified 2008–2009 satellite images were then down-resolved from their original 2.4 m × 2.4 m pixels (5.76 m2) by resampling the 2.4 m pixels into 9.6 m pixels using a majority rule. This resampling is a potential source of error as the 2.4 m pixels in the satellite data set were down-resolved to 9.6 m, the majority rule of resampling potentially causes a pixel that is coral to change to sand if the majority of pixels in the resampling area are sand. The same is true for a sand pixel surrounded by coral, but the down-resolving is necessary for change detection comparisons between the two data sets.
Change detection
The categories of coral, sand/coral and sand were represented numerically as 1, 2 and 3, respectively in the van Duyl data set, hereafter referred to as 1980s; and 10, 20 and 30, respectively, for the satellite data set, hereafter referred to as 2008–2009. Because of this coding convention, progression from the ones column to the tens column of the resulting sum would represent the change in bottom-type from the 1980s to 2008–2009 (Table 2). Changes were quantified as positive, negative or neutral/no change. Change was considered positive when a pixel that was something other than coral changed to coral. It was also considered positive when an area previously dominated by sand became an area of sand/coral mixture. Negative changes occurred when coral changed to anything that was not coral, including when an area of sand/coral mixture changed to exclusively sand.
Change values calculated in ArcGIS representing changes in bottom type between the early 1980s and 2008–2009, distinguishing positive, negative and no change.

Patch dynamics
Raster data for both years were analysed using FragStats 3.3 (McGarigal et al., Reference McGarigal, Cushman, Neel and Ene2002), which calculated patch, class and landscape metrics. A patch is defined as an area of similarly-classified pixels, using an eight-cell rule that takes into consideration all eight adjacent cells, including the four orthogonal and four diagonal neighbours, to determine patch membership. The classes in this case were coral, sand and sand/coral mixture, as described above. In addition to calculating the number and size of patches, including total patch area and perimeter-to-area ratios (PARA), two indices of connectivity between patches were also calculated: a contiguity index (CONTIG) and the Euclidean Nearest Neighbour (ENN) distance. Contiguity is quantified in FragStats by convolving a 3 × 3 pixel template with a binary digital imagine in which the pixels within the patch of interest are assigned a value of 1 and the background pixels (all other patch types) are given a value of zero. Template values of 2 and 1 are assigned such that orthogonally contiguous pixels are weighted more heavily than diagonally contiguous pixels; the contiguity value for a pixel is the sum of the products of each template value and the corresponding input image pixel value within the nine cell neighbourhood. Contiguity values range between zero and 1, with large contiguous patches resulting in larger values, as opposed to smaller, more disparate patches (McGarigal et al., Reference McGarigal, Cushman, Neel and Ene2002). The isolation of patches of coral was measured using the ENN approach, the shortest straight-line distance between the focal patch and its nearest neighbour of the same class (McGarigal et al., Reference McGarigal, Cushman, Neel and Ene2002), which hereafter will be referred to as connectivity of the reef habitat. Patch, class and landscape metrics for the two data sets, 1980s and 2008–2009, were compared statistically using an ANOVA when the data were normally distributed and the Mann–Whitney Rank Sum Test and Kruskal–Wallis non-parametric test when the data were not normally distributed.
No-diving marine reserves
The farthest north-west marine reserve closed to divers was designated marine reserve number one (MR1) and was considered an exposed site because its position along the coastline left it potentially more exposed to storms. A comparable site of equal size and adjacent to MR1 was identified as nMR1 and considered to be an exposed site in a similar area along the coast that was not closed to divers and other underwater visitors. The second marine reserve is located farther south along the coast and is sheltered by the north-western portion of the island and was designated MR2. A comparable site of equal size to the east of MR2 was designated as the non-reserve, sheltered site, nMR2. MR1, nMR1, MR2 and nMR2 are shown in Figure 2B. These four sites were compared to look at the patch statistics described above and compare marine reserve to non-reserve, exposed vs sheltered sites, and the earlier, 1980s data to the 2008–2009 satellite data. The Mann–Whitney Rank Sum Test was used to determine which year, exposure, and marine reserve status combinations were significantly different from one another in terms of connectivity; because there were 21 pairwise comparisons of the seven combinations (only one patch in MR1 in the early 1980s, therefore no ENN value) the alpha level of significance was adjusted accordingly by dividing it, 0.05, by 21, resulting in an α of 0.0024 (Bonferroni adjustment).
Klein Bonaire coastline exposure
The small island of Klein Bonaire, located just west of the main island of Bonaire, is uninhabited. The western portion of the island is exposed to incoming waves and storm energy, while the eastern portion is sheltered by the main island. The island was divided into exposed and sheltered (Figure 2C) and the two halves were statistically analysed to compare the patch statistics described above for the exposed vs sheltered halves between the 1980s and 2008–2009.
Results
Baseline reef environment
In the early 1980s, 707 hectares of reef offshore of the leeward coast of Bonaire was mapped (van Duyl, Reference van Duyl1985). Sixty-two per cent of this area represented greater than 20% hard coral cover at the time (441 ha), while areas of high sand cover (>50% sand) made up almost 32% (226 ha). The remaining 6% was composed of a sand/coral mixture (40 ha), which included soft corals, as well as dead coral covered with algae, and other marine plants.
Current reef environment
In 2008–2009, 695 hectares of the 707 hectares of reef that were mapped in the early 1980s were remapped using satellite remote sensing techniques; the disparity in area mapped was a result of cloud cover in the satellite images. Slightly greater than 30% of the 92.2 m2 pixels represented areas of greater than 20% hard coral cover (210 ha). Sandy bottom (>50% cover) dominated 53% of the reef, ~370 ha, while the remaining 17% of the reef (115 ha) was covered by a sand/coral mixture, often accompanied by octocorals (e.g. sea whips and gorgonians), dead coral covered with algae, and marine plants.
Changes in the reef environment
Considering the leeward coast in its entirety, areas of no change made up 45% of the total reef area and negative change occurred on 43% of the total area, while areas of positive change were only found in 12%. For areas previously dominated by coral, 47% became sand, while 36% stayed coral. The largest percentage of sand pixels from the 1980s data set remained sand in 2008–2009 (66%), while 18% became coral and 15% changed to a sand/coral mixture. The largest percentage of the sand/coral mixture pixels changed to sand in 2008–2009 (43%), 24% remained sand/coral, while 34% changed to coral.
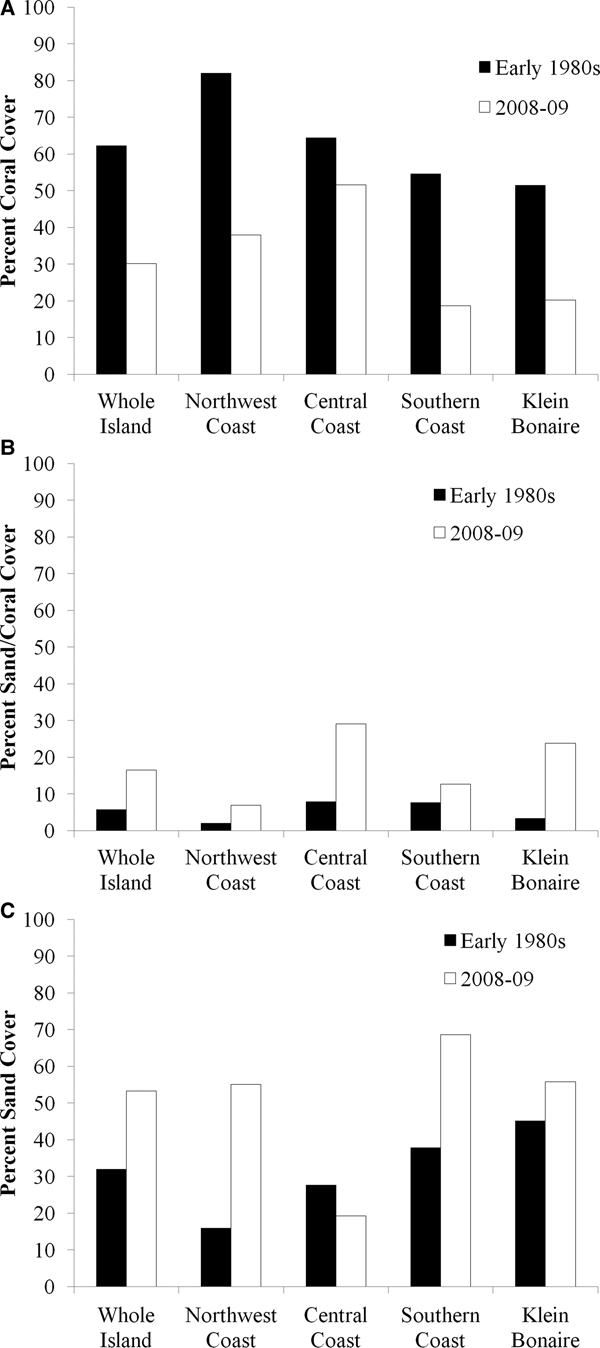
The north-west coast, most of which is uninhabited because it includes Washington Slagbaai National Park (Figure 2A), experienced the highest area of negative change (51%), with 60% of coral pixels changing to the sand/coral mixture class or to just sand. While 82% of the area was represented by coral in the 1980s (133 ha), coral dropped to 38% of the area in 2008–2009 (61 ha; Figure 3A), and the area of sand increased from 16% (26 ha) to 55% (89 ha; Figure 3C). The sand/coral mixture class experienced an increase from 2% (3 ha) to 7% (11 ha) from the early 1980s to 2008–2009 (Figure 3B).
Changes in per cent coral cover (A), sand/coral mixture (B) and sand (C) between the early 1980s (black) and 2008–2009 (white) on the entire leeward coast of the island of Bonaire, the north-west coast, the central coast, the southern coast, and the uninhabited island of Klein Bonaire.

The coast of the central part of the island (Figure 2B), which includes one of the no-diving marine reserves (MR2) and the capital city (Kralendijk), extends 16 km along the coastline to the north of the city, experienced the highest level of positive change (33%) and the lowest level of negative change (26%) of the four areas. A larger portion of this coastal area was coral in the early 1980s (64%) than in 2008–2009 (52%; Figure 3A). The sand/coral mixture increased from 8% in the early 1980s to 29% in 2008–2009 (Figure 3B). Correspondingly, the amount of sand cover in the area declined from 28% to 19% (Figure 3C).
The southern coast is also sparsely inhabited and consists mostly of salt pans for the island's sea salt industry (Figure 2C). In the early 1980s, 55% of this portion of the coastline was covered in coral (158 ha), which dropped to 19% in 2008–2009 (52 ha; Figure 3A). Correspondingly, sand cover increased from 38% (109 ha) to nearly 70% (190 ha: Figure 3C).
The uninhabited island of Klein Bonaire, located ~1 km west of Bonaire, experienced declines in coral cover from 52% (59 ha) to 20% (23 ha) over the time period (Figure 3A). Thirty-four per cent of the coral pixels changed to sand, while 35% changed to the sand/coral mixture, resulting in an increase in the sand/coral mixture class from 3% (4 ha) to 24% (27 ha; Figure 3B), and the sand class from 45% (51 ha) to 56% (63 ha; Figure 3C).
Whole island patch dynamics
While the total percentage of area covered by coral declined from 62% in the 1980s to 30% in 2008–2009 (Figure 3A), the number of patches of coral increased from 72 to 221 (Figure 4). Mean patch size decreased from 6.12 ha to 0.95 ha (U 221,72 = 6035.00, P = 0.002). The PARA increased from 2247.87 to 2827.34 (U 221,72 = 5838.50, P < 0.001). The contiguity decreased from 0.41 to 0.30 (U 221,72 = 5959.50, P = 0.001). The connectivity values were not significantly different between years.
Changes in the number of coral patches between the early 1980s (black) and 2008–2009 (white) off the leeward coast of the main island, on the sheltered and exposed sides of Klein Bonaire, and in the marine reserves and adjacent non-reserve sites. Note: log scale is used and only one coral patch in the early 1980s in the no-entry marine reserve 1 (MR1).

No-diving marine reserves
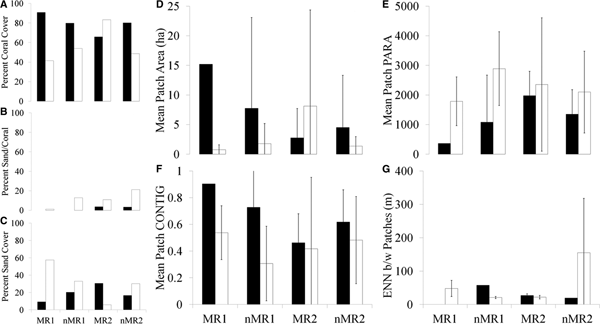
Out of the four areas, MR1, MR2, nMR1 and nMR2, only the sheltered, no-diving reserve site (MR2) experienced a positive increase in coral cover over the time period, going from 66% coral to greater than 83% (Figure 5A). This was accompanied by a decline in sand from 31% in the early 1980s to 6% in 2008–2009 (Figure 5C). MR1, nMR1 and nMR2 all experienced declines in coral cover and increases in sand (Figure 6). MR2 is the only site that experienced a decrease in patchiness within the reserve over time (Figure 4), which was accompanied by increases in the mean patch area and PARA (Figure 5D & 5E). MR1, nMR1 and nMR2 all experienced increases in the number of patches (Figure 4) and decreases in mean patch area (Figure 5D), but mean PARA increased in all three (MR1, nMR1 and nMR2; Figure 5E). All four areas experienced declines in contiguity (Figure 5F). Mean connectivity values decreased in MR2 and nMR1, but increased in nMR2 (Figure 5G). In the early 1980s, there was only one large coral patch in MR1 so there is no connectivity value. Patch PARAs and contiguity were not significantly different as a result of year, exposure, status as a marine reserve or any combination of the three (Table 3). The mean patch area was not significantly impacted by year, exposure or status as a marine reserve. Connectivity was significantly different between the groups (H = 16.68, df = 6, P = 0.01, adjusted for ties). In the early 1980s, the connectivity of the non-reserve, exposed site was significantly higher than the sheltered reserve site in the early 1980s (t-test = −5.79, df = 7, P < 0.001) and in 2008–2009 (t-test = −10.446, df = 3, P = 0.002).
Changes in per cent coral cover (A), sand/coral mixture (B) and sand (C) between the early 1980s (black) and 2008–2009 (white) in the two marine reserves (MR1 and MR2) and unprotected adjacent areas (nMR1 and nMR2) on Bonaire. Note: there was no sand/coral mixture class in MR1 or nMR1 in the early 1980s. Changes in the patch parameters area (D), PARA (E), contiguity index (F) and ENN distance (G) between the early 1980s (black) and 2008–2009 (white) in the two marine reserves (MR1 and MR2) and unprotected adjacent areas (nMR1 and nMR2) on Bonaire.

Coral, sand/coral mixture and sand classes in the exposed MR1 and nMR1 in the early 1980s (A) and 2008–2009 (B). The negative, neutral and positive change values over the time period in MR1 and nMR1 (C). Coral, sand/coral mixture, and sand classes in the sheltered MR2 and nMR2 in the early 1980s (D) and 2008–2009 (E). The negative, neutral and positive change values over the time period in MR2 and nMR2 (F).

F-stats and P-values resulting from a three-way ANOVA with year, exposure and marine reserve status as predictors for the variables PARA and CONTIG (df = 29).

Effect of exposure on Klein Bonaire
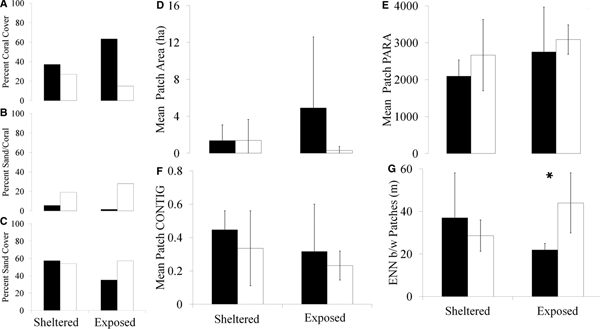
From the early 1980s to 2008–2009, the sheltered, eastern portion of Klein Bonaire declined from 37% coral to 27% (Figures 7A & 8). Between the two time periods the sand/coral mixture class increased from 6% of the total area to 19% (Figure 7B), while sand declined slightly from 57% to 54% (Figure 7C). The exposed, western side of Klein Bonaire initially had a higher percentage of coral cover than the eastern side (63%), which declined to less than 15% in 2008–2009 (Figures 7A & 8). This was accompanied by an increase in sand from 35% to 57% and an increase in the amount of area covered by a sand/coral mixture from 1.5% to 28% (Figure 7B & 7C). The exposed side of the island increased in the number of patches of coral from 8 to 31, whereas the sheltered side of Klein experienced a decline in the number of coral patches from 14 to 10 (Figure 4).
Changes in per cent coral cover (A), sand/coral mixture (B) and sand (C) between the early 1980s (black) and 2008–2009 (white) on the sheltered and exposed portions of Klein Bonaire. Changes in the patch parameters area (D), PARA (E), contiguity index (F) and ENN distance (G) between the early 1980s (black) and 2008–2009 (white) on the exposed and sheltered sides of the island. Only the change in ENN distance over the time period on the exposed side of the island was significant (U 31,8 = 50.5, P = 0.01). *Indicates a significant difference between time periods. Error bars indicate ± two standard errors.

Between the two time periods, only connectivity was significantly different on the exposed side of the island (U 31,8 = 50.5, P = 0.01; Figure 7G). There was no significant effect of year or exposure on patch area (Figure 7D), PARA (Figure 7E) or contiguity (Figure 7F). Connectivity was significantly different between the habitat groups (H = 7.99, df = 3, P = 0.05, adjusted for ties), although, after Bonferroni adjustment (for six pairwise comparisons of the four habitats: α = 0.0083), pairwise comparison (Mann–Whitney Rank Sum Test) found none of the combinations of year and exposure to be significantly different.
Discussion
Using satellite remote sensing techniques to determine coral cover on the shallow reefs of Bonaire (less than 10 m) and comparing it to the atlas created by van Duyl in the 1980s, coral has declined from 62% to only 30% over the time period. However, Bonaire's reefs are experiencing less severe declines in coral cover than elsewhere in the Caribbean, which have seen declines from about 50% to 10% hard coral cover in three decades (Gardner et al., Reference Gardner, Cote, Gill, Grant and Watkinson2003; Jackson et al., Reference Jackson, Donovan, Cramer and Lam2014). Our findings on current coral cover using remote sensing techniques (30%) are similar to findings by Steneck et al. (Reference Steneck, Arnold and DeBey2011, Reference Steneck, Arnold, de León and Rasher2015), who reported 34–39% live cover at quadrats in 10 m of water off the leeward coast of Bonaire and to Stokes et al. (Reference Stokes, Leichter and Genovese2010) who reported coral cover ranging from 23.7–38.4% at depths between 10 and 30 m. Bak et al. (Reference Bak, Nieuwland and Meesters2005) reported ~20% coral cover within permanent quadrats at 10–20 m depth on Bonaire. Jackson et al. (Reference Jackson, Donovan, Cramer and Lam2014) reported coral cover on Bonaire to be 31% at 10 m depth, which was a decrease of 32% between 1974 and 2008. At 20 m depth cover was much lower, 8%, a decrease of 63% between the same years (Jackson et al., Reference Jackson, Donovan, Cramer and Lam2014). Areas of previously high coral cover examined here were replaced mostly by sand and the remaining coral has become increasingly patchy, with a greater number of small, less contiguous coral patches. The data for van Duyl (Reference van Duyl1985) was collected in the early 1980s, prior to the die-off of large acroporids, which occurred on Bonaire in 1983 (Knowlton et al., Reference Knowlton, Lang, Rooney and Clifford1981; Jackson et al., Reference Jackson, Kirby, Berger, Bjorndal, Botsford, Bourque, Bradbury, Cooke, Erlandson, Estes, Hughes, Kidwell, Lange, Lenihan, Pandolfi, Peterson, Steneck, Tegner and Warner2001, Reference Jackson, Donovan, Cramer and Lam2014). On Bonaire rubble created from the broken calcium carbonate of Acropora palmata and A. cervicornis is clearly visible, particularly in the shore zone and shallow reef (<5 m). However, in contrast to other regions in the western Atlantic, Bonaire has not been severely damaged by hurricanes in recent times (Bries et al., Reference Bries, Debrot and Meyer2004), but when hurricanes do occur in the region the normally calm leeward coast can experience higher wave energy (van Duyl, Reference van Duyl1985; Pandolfi & Jackson, Reference Pandolfi and Jackson2001). In 1999 hurricane Lenny moved in a rare west-to-east direction across the Caribbean, resulting in coral toppling, fragmentation, tissue damage, bleaching and smothering along the coast of Bonaire (Bries et al., Reference Bries, Debrot and Meyer2004). A subsequent study comparing QB satellite images from the years before and after Lenny could measure the impact of this specific storm on coral cover. Fortunately, Bonaire has not seen an overgrowth of macroalgae in areas where coral has been lost and replaced by sand and rubble (Kramer, Reference Kramer2003; pers. obs.), as has been documented elsewhere in the Caribbean (Bellwood et al., Reference Bellwood, Hughes, Folke and Nystrom2004; Bruno et al., Reference Bruno, Sweatman, Precht, Selig and Schutte2009).
Although most of the reef experienced declines in coral cover, a non-negligible 16% of the reef did experience positive changes toward higher coral cover, and a large amount, 40%, remained unchanged between the early 1980s and 2008–2009. It was initially surprising to the authors that the largest amount of increase in coral cover was concentrated along the middle of the leeward coast, where the capital city of Kralendijk is located and most of the population resides. In contrast, the much less inhabited northern and southern leeward coasts experienced higher levels of negative change. The authors expected more negative impacts to be concentrated around the population centre owing to nutrient inputs, sedimentation and runoff as a result of development. A possible reason these negative impacts were not found where expected is that mapping by van Duyl (Reference van Duyl1985) may have occurred after damage had already taken place as a result of rapid building and development of the capital city of Kralendijk. In addition, this area of coastline is sheltered by the neighbouring island of Klein Bonaire and the adjacent shore of Klein Bonaire, which is sheltered by the main island, was also not found to have experienced as drastic a decrease in coral cover when compared to the exposed side of Klein Bonaire; it became less patchy over the time period, with fewer, but larger patches of coral, suggesting that protection of the coastline may be helping to buffer coral losses and fragmentation. The fact that the sheltered marine reserve and sheltered side of Klein Bonaire both experienced decreases in the number of coral patches and increases in patch area supports the hypothesis that status as a marine reserve and sheltering from exposure may buffer against coral fragmentation. Surrounding Klein Bonaire the majority of coral loss was in the shallower portions of the reef, along the shoreline (Figure 8). Elsewhere, long stretches of coral patches have been broken up along the coast over time, as in MR1, MR2 and nMR2 (Figure 6), and coral in the shallowest part of the reef, along the coast, has been lost.
Coral, sand/coral mixture, and sand classes on the western, exposed coast (left) and on the eastern, sheltered coast (right) of Klein Bonaire in the early 1980s (A) and 2008–2009 (B). The negative, neutral and positive change values over the time period along the exposed coast (C).

It is not surprising that increases in the number of patches of coral were accompanied by overall declines in cover and decreases in the size of individual patches. Patches with small nearest neighbour distances are typically situated in landscapes containing more habitat than are patches with large nearest neighbour distances, so this measure of isolation is generally related to amount of total habitat in the landscape (Fahrig, Reference Fahrig2003). Connectivity showed positive changes as the Euclidean nearest neighbour (ENN) value declined over time in the sheltered marine reserve and in the exposed non-reserve site, but the sheltered non-reserve site experienced an increase in this value, with a larger number of smaller coral patches spaced farther apart from one another. Fragmentation per se implies a larger number of smaller patches; however, as these changes, in addition to the change in contiguity and connectivity values, were not significant, this suggests that habitat fragmentation is less of an issue on Bonaire than habitat loss in general. Fahrig (Reference Fahrig2003) suggests that the term ‘fragmentation’ be limited to the breaking apart of habitat, independent of habitat loss; this can happen on a reef when a large coral patch breaks apart at the centre, but gains area along the outside edges, resulting in no net loss of total habitat; empirical evidence to date suggests that the loss of habitat has large negative effects on biodiversity. Recent studies have shown that a variety of impacts can result from habitat fragmentation; it is unknown whether such impacts are the result of fragmentation itself, the total loss of habitat during fragmentation, degradation of the habitat after the fragments are isolated or the effect of isolation itself (Caley et al., Reference Caley, Buckley and Jones2001). Most studies of habitat fragmentation in the marine environment have been in seagrass habitats (Eggleston et al., Reference Eggleston, Etherington and Ellis1998; Hovel & Lipcius, Reference Hovel and Lipcius2001, Reference Hovel and Lipcius2002). Shrimp are more abundant in small patches of seagrasses because a large perimeter-to-area ratio (PARA) is important for feeding (Eggleston et al., Reference Eggleston, Etherington and Ellis1998) and a greater number of invertebrate taxa occur in larger patches of seagrass habitat (Bowden et al., Reference Bowden, Rowden and Martin2001). Other studies have reported reduced survival in fragmented habitats as a result of increased exposure to predators along the edges of habitat patches, i.e. a large PARA (Brittingham and Temple, Reference Brittingham and Temple1983; Andrén & Angelstam, Reference Andrén and Angelstam1988). These effects of fragmentation probably vary greatly by species (Eggleston et al., Reference Eggleston, Etherington and Ellis1998), particularly between invertebrates and fishes. Although loss of coral habitat on Bonaire is undoubtedly occurring, and the remaining available habitat is being broken into smaller patches, it is not possible to separate the effects of loss from fragmentation. Fahrig (Reference Fahrig2003) suggests that the effects of fragmentation per se may be greater in tropical systems than in temperature systems, but this prediction remains to be tested. Caley et al. (Reference Caley, Buckley and Jones2001) represents an experimental study on a coral reef at a fine spatial scale and found habitat degradation to have a much greater detrimental impact than fragmentation, and the effects of fragmentation in the absence of loss and degradation to be either neutral or positive, and provides a useful and complementary approach to experiments at macro-landscape scales such as the present study. Unfortunately, landscape-level analyses of coral cover are lacking and do not lend well to experimental manipulation, particularly given the current fragile state of coral reef ecosystems. Satellite remote sensing techniques are a non-invasive method for coarsely classifying coral reef habitats (Mishra et al., Reference Mishra, Narumalani, Rundquist and Lawson2006; Relles et al., Reference Relles, Jones and Mishra2012) rapidly at the landscape scale to assess changes in coral cover following disturbances such as disease, storms, sedimentation and eutrophication. The present study shows that modern maps created by this method can be compared to ancillary data sets to assess trends in coral cover over significantly longer time scales. Increased ground-truthing of the satellite data would be useful for improving the accuracy of the classification system, specifically the relatively poor user accuracy for the coral class reported here (50%).
Landscape-level analyses such as this are useful for evaluating the success of marine policy and focusing future management decisions on areas of concern, as coral reef ecosystems continue to change faster than our current abilities to measure those changes. Based on our findings the island of Bonaire seems to be doing better than elsewhere in the Caribbean as a well-managed and long-established Marine Protected Area (MPA). The work completed here can potentially be used to establish additional no-diving marine reserves by identifying areas that have maintained relatively high coral cover or have experienced increases in coral over the time period and also identify areas of concern that have not fared as well and may warrant an increased level of protection.
Acknowledgements
Expert field assistance was provided by co-PIs J. Leichter, M.D. Stokes and A. Trembanis, and expedition members C. Cocarro, K. Collins, A. Forrest, S. Genovese, T. Hiller, D. Jones, B. Laval, E. Magnússon, J. Mallinson, K. McCole, D. Miller, S. Patterson, N. Rankin, A. Relles, C. Roper, O. Rutten, H. Stevens and R. Yeo. R. de Leon and E. Beukenboom of STINAPA Bonaire provided logistical help, field assistance and boat access. F. van Slobbe, Department of Environment and Natural Resources, and the Honorable H. Domacassé, Lt. Governor of the Government of the Island Territory of Bonaire provided insights into development trends and logistical and legal support for the expedition. D. Mason and L. Chang provided expert medical advice and field gear, and W. Reisner gave valuable dive training and safety oversight. We thank B. Bowker of Carib Inn, and Toucan Diving, especially S. Wackenhut and E. Muller, for help on the water. T. Lansing, a Virginia Governor's School student, performed supervised video analysis of some of the data. R. Seitz, C.T. Friedrichs and J.E. Duffy made helpful comments on the manuscript. This is Contribution No. 3766 of the Virginia Institute of Marine Science, College of William and Mary.
Financial support
DJ wishes to acknowledge the UK Natural Environment Research Council Collaborative Autosub Science in Extreme Environments Travel Bursary for supporting fieldwork in Bonaire (NERC Autosub Grant NER/T/S/2000/00994). DJ was funded in part for this work by the UK Natural Environment Research Council as part of the Marine Environmental Mapping Programme (MAREMAP). This work was supported by a NOAA Office of Ocean Exploration and Research Award #NA07OAR4600291. NJR was supported by a School of Marine Science Minority Graduate Fellowship, a US National Science Foundation GK-12 Fellowship (NSF0840804), a travel grant from the William & Mary Reves Center, and an American Society of Limnology and Oceanography Multicultural Program travel grant.