Introduction
According to the World Bank's World Development Indicators, among nations and territories with populations of more than one million the total fertility rate (TFR) in 2005 was highest in Niger (7.67) and lowest in Hong Kong (0.97). 5.66 of the 7.67 children borne by the average woman in Niger (73.8%), and 0.966 of the 0.97 children borne by the average woman in Hong Kong (99.55%) survived to the age of 5 years. Birth and death rates are statistically associated with measures of economic, intellectual and social development. For example, the per capita gross domestic product (GDP) is US$781 in Niger and US$34,833 in Hong Kong. The average IQ of the population is estimated as 69 in Niger and 108 in Hong Kong (Lynn & Vanhanen, Reference Lutz, Testa and Penn2006).
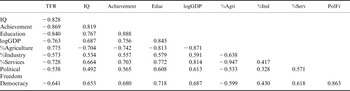
The inverse relationship of a country's level of ‘development’ with its TFR is strong and consistent at the global level. Table 1 summarizes the correlations of the total fertility rate with a number of ‘development indicators’ for those 170 countries for which complete data are available. These correlations are in agreement with historical experience. Since the late 19th century in Europe and North America, fertility declined while both per capita income (Maddison, Reference Maddison2007) and IQ (Tuddenham, Reference Tuddenham1948; Loehlin et al., Reference Loehlin, Lindzey and Spuhler1975, pp. 137–139; Flynn, Reference Flynn1984, Reference Flynn1987; Raven, Reference Raven2000) were rising and democratic forms of government became more common.
Correlations of the total fertility rate (2000–2005 average) with other country-level variables (N=170 countries)

Achievement, school achievement; PolFr, political freedom.
However, it is not immediately obvious, either from the historical trends or the correlations in Table 1, which aspect of development is the most direct causal influence on the fertility rate. The problem is that indicators of social, economic and intellectual development are highly correlated with each other.
The present study uses a cross-sectional approach to investigate the relative roles of intellectual, economic and social development in the decline of fertility with modernization. Both multiple regression analysis and causal modelling are used, and alternative development indicators are used in an attempt to establish concordance between the results obtained with different methods.
Methods
The following variables were used:
TFR is the total fertility rate averaged for the years 2000–2005. Data are from the World Development Indicators of the World Bank, which can be purchased at http://econ.worldbank.org.
logGDP is the logarithm of gross domestic product adjusted for purchasing power, averaged for the years 1990–2005, also from the World Development Indicators. The logarithmic transformation was used because of the highly skewed nature of GDP worldwide, which approximates to a normal distribution in the logarithmic form.
%Agriculture and %Services are the percentage of the labour force employed in the agricultural and service sectors, respectively. Data are from the World Fact Book of the CIA, 2004 edition (http://www.tomeraider.com/ebooks/non-fiction/world_and_travel/cia_world_factbook_2004_ebook--BK629.php), with missing data points extrapolated from the percentage contribution of agriculture and services to the GDP in 2001, published by the United Nations (2004a). A measure of Modern economy was formed by subtracting %Agriculture from %Services.
IQ is the average IQ in the country according to Lynn & Vanhanen (Reference Lutz, Testa and Penn2006) and Lynn (Reference Lutz, Testa and Penn2006). Measured scores are available for 114 countries. Lynn & Vanhanen (Reference Lutz, Testa and Penn2006) also provide estimated IQs of 79 additional countries based on the IQs of neighbouring countries with similar population and culture. The estimates were included in the present study, yielding a total of 193 countries with IQ scores.
Achievement was used as an alternative measure for intelligence. It was averaged from the standardized scores of two measures: (1) Results of international school achievement tests in mathematics and science from TIMSS (Third International Mathematics and Science Study) averaged from the 1995, 1999 and 2003 assessments (data available from http://timss.bc.edu/timss2003.html) and PISA (Program for International Student Assessment) 2003 and 2006 assessments (data available from http://www.pisa.oecd.org/dataoecd/58/41/33917867.pdf and http://www.pisa.oecd.org/pages/0.3417,en_32252351_32236191_1_1_1_1_1,00.html). For each country, all available data were computed into a single overall score as described in Lynn et al. (Reference Lynn, Meisenberg, Mikk and Williams2007). This measure correlates at r=0.904 with the Lynn & Vanhanen IQs (estimates included) for those 73 countries for which both measures are available. (2) The arcsine-transformed average of the 1990 and 2002 adult literacy rates (United Nations, 2004b). This measure correlates at r=0.741 with the Lynn & Vanhanen IQs for those 187 countries for which both measures are available. The results of the international student assessment programmes were combined with the literacy rate into a single measure of achievement because the former are available only for 73 countries, most of which are at rather high levels of economic development. Literacy rates are available for a larger number of 195 countries and are most meaningful for countries at lower levels of development. Therefore the composite measure of scholastic achievement is available for countries at all developmental levels. The correlation between arcsine-transformed literacy rates and the scores on scholastic achievement tests was r=0.721 for those 72 countries that have measures for both variables.
Education was calculated by averaging the standardized scores of two measures: (1) Average years of schooling for adults over the age of 25 from the Barro-Lee dataset for the year 2000, or extrapolated from the latest available date. The data are available at http://www.cid.harvard.edu/ciddata/Appendix%20Data%20Tables.xls. (2) School life expectancy for the year 1999 (or extrapolated from earliest available date) from UNESCO at http://stats.uis.unesco.org/TableViewer/tableView.aspx. This dataset represents the educational exposure of the younger generation. It correlates with the Barro-Lee data for adults at r=0.840 (N=88 countries). Missing data were extrapolated from the combined enrolment ratio for primary, secondary and tertiary schools in 2002 (United Nations, 2005). Missing data for the remaining four (out of 170) countries were extrapolated from the arcsine-transformed averages of the adult literacy rates in 1990 and 2002 (United Nations, 2004b).
Freedom was defined as the scores of political freedom (political rights+civil liberties) from Freedom House at http://www.freedomhouse.org/research/freeworld, averaged over the years 1988–2005.
Democracy was defined as Vanhanen's democracy index, average 1990–2004, from the Finnish Social Science Data Archive at http://www.fsd.uta.fi/english/data/catalogue/FSD1289/. Freedom and Democracy were highly correlated (r=0.847, N=179 countries), and in some analyses were averaged into a single Freedom/Democracy variable.
Data for Skin colour were from Jablonski & Chaplin (Reference Jablonski and Chaplin2000), with missing data extrapolated under the assumption of clinal variation.
The statistical analysis was performed with SPSS software, using Amos 7.0 for the latent variable analysis. The analysis was limited to countries with a population of at least 250,000, because small countries are more likely to be atypical. With this restriction, complete data were available for 170 countries.
Results
Table 1 shows the country-level correlations of the total fertility rate (TFR) with possible causal variables, as well as the intercorrelations of these variables. School achievement, education and IQ are most predictive. Economic indicators, including log-transformed GDP and the percentage of the labour force employed in agriculture and the service sector, are somewhat less predictive, and the correlations with political freedom and democracy are even lower. These correlations suggest that cognitive development, measured as school achievement, educational exposure or IQ, tends to be more important than economic conditions in reducing fertility, which in turn are more important than politics. However, the high correlations between the predictor variables preclude any firm conclusions about causal paths.
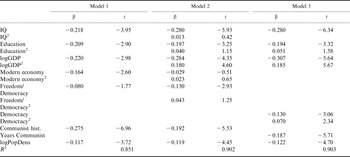
To refine the correlational analysis, the variables in Table 1 were used in regression models. However, because the results and interpretation of multiple regression models are sensitive to collinearity, Achievement (highly correlated with Education and IQ) was omitted; %Agriculture and %Services were never used together, but either alternatively or as the combined measure of Modern economy; and Political freedom and Democracy were used either singly or as the composite measure Freedom/Democracy. The models also included two other plausible predictors of fertility: log-transformed population density, and a measure for a history of communist rule. The latter was either in the form of a dummy variable for communist history, or a continuous measure for the number of years under communist rule. Non-linear effects were modelled by including squared terms. Table 2 shows some of these regression models.
Regression models predicting the total fertility rate (N=170 countries)

log PopDens, log-transformed population density.
If only linear effects are included (Model 1), the effects of IQ, Education and logGDP are of similar strength and each is highly significant. Also a modern economic structure, defined as a high proportion of the labour force in services as opposed to agriculture, reduces fertility independently in this model. The effects of Freedom/Democracy are negative as expected, but this effect is not significant. Finally, both a history of communist rule and log-transformed population density reduce the TFR independent of the other predictors.
The inclusion of non-linear effects (Model 2) shows that the effect of IQ is linear. However, logGDP and possibly Education and Freedom/Democracy show saturation effects. At low levels of development, rising education, logGDP and Freedom/Democracy strongly reduce fertility, but this effect is no longer observed at high levels of development. Indicators of economic development other than logGDP (percentage of the labour force in the service sector, industry or agriculture) are ineffective in the non-linear model. When Model 2 is modified and simplified to maximize the adjusted R 2, Model 3 is obtained. The results are very similar to Model 2. The R 2 values in Table 2 are remarkably high. A country's fertility can be predicted quite accurately from the variables in the models, especially when non-linear effects are included.
Regression models ignore interactions between the predictors. Therefore path models were employed to include these interactions. The use of highly collinear variables as predictors for the same outcome was again avoided, and the models were designed to be conceptually plausible, in addition to providing acceptable model fit.
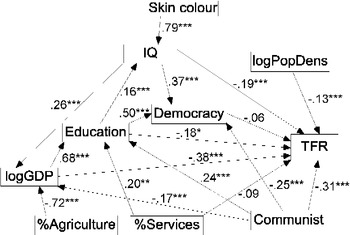
The model presented in Fig. 1 is the preferred model because it has not only an acceptable fit (χ2=20.37, df=17, p=0.256, RMSEA=0.034), but also plausible causal interactions among the variables. For example, GDP is raised primarily by a non-agrarian economy, and it is also raised by a high IQ of the population and reduced by a history of communist rule. IQ is shown as a positive influence on GDP rather than vice versa. Reversal of the IQ → logGDP arrow in Fig. 1 leads to serious deterioration of the model fit. This is in accordance with the recent finding from cross-lagged models that the effect of intelligence on GDP is stronger than the reverse effect of GDP on intelligence (Rindermann, Reference Rindermann2008a). Democracy (measured mainly during the 1990s) is favoured by high education and IQ, and reduced by a history of communist rule. The former effects agree with the results of cross-lagged models, which also show education and intelligence as positive influences on democracy (Rindermann, Reference Rindermann2008b). The strong relationship between skin colour and IQ is expected because of the very high correlation of 0.902 between these two variables. Correlations of this magnitude have been described before by at least two investigators working independently with different data sources (Meisenberg, Reference Lynn and van Court2004; Templer, Reference Templer2006).
Path model showing the effects of predictors on the total fertility rate (TFR). logPopDens, log-transformed population density; %Agriculture, %Services, percentage of the labour force in agriculture and the service sector; Communist, years under communist rule. *p<0.05; **p<0.01; ***p<0.001. χ2=20.37, df=17, p=0.256.

The effects on fertility are compatible with the regression models in Table 2. Again there are significant negative effects of logGDP, Education and IQ, which suggest that both material wealth and cognitive development independently reduce fertility. Also, years under communist rule and log-transformed population density are again found to reduce fertility. The inability to observe direct effects of the service and agrarian sectors on fertility despite a strong effect of logGDP shows that it is not the structure but the success of the economic system that reduces fertility. Democracy marginally reduces fertility, but in contrast to the regression models in Table 2 the effect is not statistically significant. If a similar model is constructed with political freedom rather than democracy as an indicator of a ‘modern’ political system, the effect of political freedom on fertility is again negative without reaching statistical significance (not shown).
The models of Table 2 and Fig. 1 distinguish between economic structure, measured as the percentage of the labour force in services and agriculture, and national wealth, measured as per capita GDP, but they do not clearly distinguish between economic and intellectual development. Education, measured mainly by years in school, is more closely related to log-transformed GDP than to IQ (Table 1) and can therefore be considered a measure of economic as well as cognitive development. According to Fig. 1, logGDP is itself determined to a non-trivial extent by IQ and can therefore be considered an indicator of intellectual as well as economic development. This confirms earlier reports about effects of intelligence on GDP (Lynn & Vanhanen, Reference Lynn and Vanhanen2001, Reference Lynn and Vanhanen2002, Reference Lynn and Vanhanen2006) and economic growth (Weede & Kämpf, Reference Weede and Kämpf2002; Jones & Schneider, Reference Jones and Schneider2004; Weede, Reference Weede2004; Rindermann, Reference Rindermann2008a).
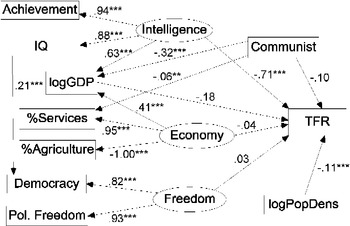
Therefore latent variable models were employed in an attempt to capture these constructs. Freedom was defined by the two indicator variables of democracy and political freedom; a modern Economy was defined by the percentage of the labour force employed in agriculture and services; and Intelligence was defined by IQ and school achievement. Although school achievement, measured by the literacy rate and the performance in international scholastic assessment tests, is most closely related to the amount of formal schooling, it nevertheless correlates more highly with IQ than with logGDP and can therefore be considered a bona fide indicator of cognitive rather than economic development (Table 1). Length of schooling was not employed in the latent variable models because of its ambiguous status as a measure of both economic and intellectual development, but logGDP was included with the expectation that it would be affected both by economic structure and intelligence. Interactions involving the indicator variables were permitted to the extent that they were required for an acceptable model fit.
Figure 2 shows the preferred model. Its fit is acceptable with χ2=20.27, df=18 (p=0.318 and RMSEA=0.027). As expected it shows logGDP as being determined primarily by the latent variables of Economy and Intelligence, and also by a history of communist rule. The arrow from IQ to democracy is required for an acceptable model fit because IQ is more closely related to democracy than to political freedom (Table 1).
Latent variable model showing the effects of predictors on the total fertility rate (TFR). logPopDens, log-transformed population density; %Agriculture, %Services, percentage of the labour force in agriculture and the service sector; Communist, years under communist rule. *p<0.05; **p<0.01; ***p<0.001. Model fit: χ2=20.27, df=18, p=0.318.

The TFR is determined to an overwhelming extent by intelligence, whereas a modern economic structure (Economy) and a modern political system (Freedom) are entirely ineffective. Even the effect of logGDP is modest and does not reach statistical significance (p=0.104). High population density and communist history again reduce fertility in this model, although the effect of communism failed to reach statistical significance.
Discussion
Some theorists assume that the historic transition from high to low fertility was the consequence of economic growth (e.g. Clark, Reference Clark2007, pp. 289–296). This view is based on two observations: the demographic transition in Europe took place within a few decades after the beginning of sustained income rises during the 19th century (Clark, Reference Clark2007); and fertility dropped first among the wealthier classes (Sallume & Notestein, Reference Sallume and Notestein1932; Haines, Reference Haines, Gillis, Tilly and Levine1992). However, there is not always a close link between declining fertility and rising wealth. For example, South Korea and Brazil experienced similar rises in per capita GDP from the 1950s to the 1980s. Both went through the demographic transition at that time, but at every level of GDP, the TFR was higher in Brazil than in Korea by about two children per woman (Doepke, Reference Doepke2004).
One possible reason for discrepancies of this kind is that intellectual rather than economic development is the main determining factor for the timing of the fertility transition. For example, the average IQ in South Korea (adjusted for the secular trend) is 106, but the average IQ in Brazil is only 87 (Lynn & Vanhanen, Reference Lutz, Testa and Penn2006). The hypothesis that intelligence rather than wealth is the ‘prime mover’ of fertility decline is supported by the observation that in a large majority of countries today we find a clearly negative correlation between educational attainment and fertility at the individual level. However, the independent relationship between income and fertility, after controlling for education, is small and of variable sign. In the more advanced countries in particular, the income–fertility relationship, with education controlled, is more often positive than negative (Meisenberg, Reference McPherson and Weltzin2008).
Intelligence is a plausible cause of declining fertility because intelligence rose massively during the 20th century in the advanced nations of the world (Flynn, Reference Flynn1987). In Britain, psychometric intelligence was already rising among those born in the late 19th century (Raven et al., Reference Raven, Raven and Court1998, Graph G2), at a time when fertility began declining. This 19th century Flynn Effect was most likely caused by mass education. The average length of schooling in Britain rose from 2.3 years for those born in 1801–1805 to 5.2 years for those born in 1852–1856 and 9.1 years for those born in 1897–1906 (Matthews et al., Reference Matthews, Feinstein and Odling-Smee1982). It is therefore plausible that the historic fertility transition was caused not by rising prosperity, but by educational exposure and specifically by the cognitive skills that are fostered by education (van de Walle, Reference van de Walle1980; Boonstra, Reference Boonstra1998). Today, psychometric intelligence is rising along with educational exposure and per capita income in developing countries while these countries are moving through the fertility transition (Daley et al., Reference Daley, Whaley, Sigman, Espinosa and Neumann2003; Meisenberg et al., Reference Meisenberg, Lawless, Lambert and Newton2005; Colom et al., Reference Colom, Flores-Mendoza and Abad2006; Khaleefa et al., Reference Khaleefa, Abdelwahid, Abdulradi and Lynn2008).
The results of the present study show that both prosperity, measured as logGDP, and ‘intelligence’, measured as IQ and/or school achievement, are consistent and independent predictors of low fertility. The conceptual separation of these two constructs is difficult because there is much collinearity between the four variables of logGDP, educational exposure, educational achievement and IQ. If education is omitted from regression models and path models, both IQ and logGDP predict fertility, with logGDP being the stronger predictor. In models with logGDP and school achievement as the only measures of prosperity and cognitive development, both are about equally effective.
Although regression models and path models show a strong effect of prosperity (measured as logGDP) on fertility, the latent variable model of Fig. 2 shows Intelligence as the overwhelming determinant of fertility. The likely reason for this result is that by treating logGDP as a consequence of the latent variable Intelligence, logGDP becomes part of its definition. In models that omit the Intelligence → logGDP path, and define Intelligence purely by IQ and school achievement, the effect of logGDP becomes again highly significant although the effect of Intelligence remains stronger than the effect of logGDP.
However, a modern economic structure, as defined by a low percentage of the labour force in agriculture and/or a high percentage in the service sector, rarely appears as a significant independent predictor of low fertility, although some early theorists believed that the demographic transition was related to the transition from an agrarian to an industrial economy (Heer, Reference Heer1968). Only economic success, measured by logGDP, predicts low fertility – and economic success is influenced by intelligence.
The reason why prosperity should reduce fertility is not obvious. In countries that are going through the demographic transition, people commonly cite a lack of financial resources as a reason for limiting their family size (Knodel et al., Reference Knodel, Havanon and Pramualratana1984), and therefore we would expect a positive relationship between wealth and fertility at the individual and possibly the country level. The observed negative relationship at the country level could indicate that in wealthy countries, well-advertised consumer goods and costly entertainments compete with children for the parents’ financial resources, thus reducing the parents’ willingness to make financial commitments to children (Meisenberg, Reference Lynn, Meisenberg, Mikk and Williams2007, pp. 333–335).
The raw correlations of Table 1 show that fertility is more closely related to school achievement and amount of schooling than to IQ. This might indicate a weakness of the Lynn & Vanhanen (Reference Lutz, Testa and Penn2006) dataset, but it can also mean that ‘mental horsepower’ is not the most immediate influence on fertility. What determines fertility outcomes are the habits of thought that bright children acquire in school. These habits of thought can perhaps best be described as a rational approach to life and a sense of control over one's life. One inevitable outcome is the effective use of birth control. Contraception failure has been and possibly still is associated with low income and education (Kost & Forrest, Reference Kost and Forrest1995) and with low IQ (Udry, Reference Udry1978), at least in the United States. Another effect of formal education is a widening of mental horizons, leading to intellectual and career-related pursuits that are not easily compatible with child rearing, especially for women (Abma & Martinez, Reference Abma and Martinez2006). At the individual level, the negative relationship of fertility with education (Meisenberg, Reference McPherson and Weltzin2008) and IQ (Retherford & Sewell, Reference Retherford and Sewell1988; Vining, Reference Vining1995; Lynn & van Court, Reference Lynn and van Court2004) is almost invariably greater for females than males.
Although higher literacy or education has often been associated with higher fertility in pre-industrial societies (Lamson, Reference Lamson1935; Hadeishi, Reference Hadeishi2003; Clark & Hamilton, Reference Clark and Hamilton2006), the relationship between education and fertility becomes negative in the early stages of the fertility transition both at the individual level (Meisenberg, Reference McPherson and Weltzin2008) and the aggregate level (Vinovskis, Reference Vinovskis1976). In modern societies, the negative correlation between intelligence and fertility is mediated in large part through education (Retherford & Sewell, Reference Retherford and Sewell1989; Neiss et al., Reference Neiss, Rowe and Rodgers2002; Parker, Reference Parker2004).
Also, attitudinal factors that are at least somewhat independent of economic and intellectual development are plausible causes of fertility transitions. This is the basic assumption behind the theory of the ‘second demographic transition’, which postulates a non-traditional and individualist value system as the immediate cause of the transition to sub-replacement fertility in the most advanced societies (Lesthaeghe & Neels, Reference Lesthaeghe and Neels2002). This raises the possibility that liberal democracy, as the society-wide expression of this value system, is independently associated with low fertility.
However, the present study finds no strong support for the hypothesis that democracy and political freedom are associated with low fertility independent of their relationships to other development indicators. Although there are modest effects in the regression models of Table 2, there is no significant effect in the models of Fig. 1 and Fig. 2. This finding agrees with conclusions from historic evidence that socioeconomic rather than cultural factors are the major causes of fertility transitions (e.g. Friedlander et al., Reference Friedlander, Schellekens and Ben-Moshe1991).
Based on the observation that the transition to lower fertility is virtually always preceded by reduced mortality and increased life expectancy, reductions in mortality have been proposed as the immediate cause of fertility decline during the demographic transition (Soares, Reference Soares2005). In the present study, the TFR correlates with life expectancy at r=0.832 and with under-five mortality at r=0.882. The correlation of life expectancy is 0.807 with logGDP, 0.764 with educational exposure, 0.731 with educational achievement and 0.823 with IQ. For under-five mortality these correlations are −0.816, −0.794, 0.776 and −0.758. These correlations are compatible with the idea that mortality and life expectancy mediate many or most of the effects of IQ, education and GDP on fertility. However, a formal analysis of this hypothesis is not fruitful because of excessive collinearity among the predictors. An alternative explanation is that both mortality and fertility are determined by a combination of prosperity and intelligence. In the historical context, small rises of both reduce mortality, while larger or more sustained rises of both also reduce fertility. For this reason mortality reductions generally precede fertility reductions during the demographic transition, even in the absence of a direct effect of mortality on fertility.
Among the ‘incidental’ findings of this study is a moderately sized but consistent negative effect of high population density on fertility. This effect has been observed both in historic populations (Leet, Reference Leet1977; Lee, Reference Lee1987) and in country-level comparisons today (Lutz et al., Reference Lutz, Testa and Penn2006). Countries with high population density tend to be highly urbanized, and today, urban residence is universally associated with low fertility (United Nations, 1987).
Another finding is the fertility-reducing effect of communism. This effect tends to be strongest in the countries of the former Soviet Union, which have had the longest exposure to communism. One possible reason is the prolonged economic crisis of these countries after the collapse of communism. Although continuously high GDP reduces fertility, short-term economic insecurity reduces it. This has been described for East Germany after reunification (Kreyenfeld, Reference Kreyenfeld2003). Another possible mechanism is the low religiosity of the former communist countries (Meisenberg, Reference Lynn and van Court2004). Traditional religiosity is associated with high fertility in the United States and Europe today (Frejka & Westoff, Reference Frejka and Westoff2008). A more immediate mechanism is perhaps the high abortion rate in the ex-communist countries (United Nations, 2007).
Differential fertility among countries is important for global trends. If fertility is higher in countries with low per capita GDP, then differential fertility will reduce the average per capita income of the world population unless per capita GDP rises within countries; and if fertility is higher in low-IQ countries than in high-IQ countries, then the average IQ of the world population will decline unless IQs rise within countries.
To determine the effect of differential fertility on IQ, the average IQ of the world population today was first calculated according to the formula:

In this formula, P is the size of the world population, and IQi and Pi are the average IQ and the population size of individual countries, respectively. Under the assumption that the current international fertility differentials persist, international migration is negligible and the average IQ within countries does not change, the average world IQ of the next generation can be calculated according to the formula:

In this model, M i is the country-specific rate of pre-reproductive mortality. It is based on the under-five mortality rates for 2003 published by the United Nations (2005), with 25% added to account for mortality from age 5 to the onset of reproduction. The difference is −3.74 IQ points per generation or, assuming a generation time of 28 years, 1.34 points per decade. This is larger than the phenotypic IQ decline of 3.64 points (0.73/decade) calculated for 2000–2050 by Lynn & Harvey (Reference Khaleefa, Abdelwahid, Abdulradi and Lynn2008), which is based on population estimates and projections by the United Nations. For example, in the present calculation China (average IQ: 105) has a negative population growth because of its low TFR of 1.83, although the Chinese population is still growing because of its young age structure. Effectively, the present calculation describes the changes in the IQ of the young, reproductive-aged population while Lynn & Harvey (Reference Khaleefa, Abdelwahid, Abdulradi and Lynn2008) describe developments for the total population. The former is arguably more relevant because the reproductive-aged population also provides the bulk of the economically active and culturally creative population.
A similar calculation shows that in the absence of per capita GDP changes and migration, the average per capita GDP of the world population would decline from today's average of US$8038 to US$6436 in one generation. This is a decline of 0.79% per year. Actually, per capita GDP within the world's countries (weighted by population size) rose by 5.7% per year between 2000 and 2005. Therefore the average per capita GDP of the world population has been rising – by about 4.9% (5.7%–0.79%) per year.
In the case of intelligence, the results imply that an average IQ gain (‘Flynn Effect’) of 1.34 points per decade in the young generation is required within countries to offset the decline that is caused by differential fertility between countries. Is a Flynn Effect of this magnitude likely? During much of the 20th century, average IQ gains in the United States have been around 3 points per decade (Flynn, Reference Flynn1984). Some countries have experienced even faster gains during the first decades after World War II (Flynn, Reference Flynn1987), although smaller gains have also been reported (Loehlin et al., Reference Loehlin, Lindzey and Spuhler1975, pp. 136–138). More recently, gains of similar magnitude have been reported from less developed countries: 2.4 points/decade in Brazil (Colom et al., Reference Colom, Flores-Mendoza and Abad2006), 2.9 points/decade in Sudan (Khaleefa et al., Reference Khaleefa, Abdelwahid, Abdulradi and Lynn2008), 5.1 points/decade in Dominica (Meisenberg et al., Reference Meisenberg, Lawless, Lambert and Newton2005) and 8.0 points/decade in Kenya (Daley et al., Reference Daley, Whaley, Sigman, Espinosa and Neumann2003).
However, the Flynn Effect has ended among those born after 1980 in the countries of northern and western Europe. Today, the intelligence of the young generation seems to be declining slowly in at least some of these countries (Sundet et al., Reference Sundet, Barlaug and Torjussen2004; Shayer et al., Reference Shayer, Ginsburg and Coe2007; Teasdale & Owen, Reference Teasdale and Owen2008), although small IQ gains have still been recorded from those born between 1980 and 1990 in the United States (Rodgers & Wänström, Reference Rodgers and Wänström2007). We do not know whether the Flynn Effect is ending also in China and other East Asian countries, which today have the highest IQs worldwide. It is likely that in East Asia, as well as the advanced countries of the West, human intelligence is approaching a biological limit that is not easily overcome by even greater educational efforts, and that for nearly half of humanity the Flynn Effect has virtually ended.
Today the average magnitude of the Flynn Effect within countries is still more than sufficient to offset the downward pressure caused by fertility differentials between countries, but not by a wide margin. However, within countries there is almost invariably a negative relationship of fertility with education (Meisenberg, Reference McPherson and Weltzin2008) and intelligence (Udry, Reference Udry1978; Retherford & Sewell, Reference Retherford and Sewell1988; Lynn, Reference Lynn1996; Lynn & van Court, Reference Lynn and van Court2004). When human intelligence has reached its biological limit, the average intelligence of the population will not remain constant but will decline slowly as a result of dysgenic fertility.
Through much of the 21st century, IQ differences between countries are likely to shrink because of a continued Flynn Effect in the less developed countries and perhaps, to a lesser extent, a slow decline of intelligence in the most advanced countries. Also, economic differences between countries will become smaller. Because low fertility seems to be caused by high levels of education, intelligence and prosperity, the current fertility differentials between countries will also diminish in size. However, as more and more countries reach the end of the Flynn Effect, the overall trend of the world's intelligence is likely to become negative before the end of the 21st century (Meisenberg, Reference Lynn, Meisenberg, Mikk and Williams2007).
Lynn & Harvey (Reference Khaleefa, Abdelwahid, Abdulradi and Lynn2008) estimated that 35% of the IQ differences between countries can be attributed to genetic differences between national populations, and that therefore differential fertility between as well as within countries contributes to the decline of ‘genotypic IQ’ in the world. Adopting this estimate, fertility differentials between countries contribute approximately 3.75 × 0.35=1.31 points per generation to the decline of genotypic intelligence among the young world population today.
The ‘genotypic’ IQ decline in the late 20th century United States has been estimated at 0.35 points (Retherford & Sewell, Reference Retherford and Sewell1988), 0.5 points (Vining, Reference Vining1995) and 0.9 points (Lynn & van Court, Reference Lynn and van Court2004). The United States have a rather average relationship between education and fertility (Meisenberg, Reference McPherson and Weltzin2008), and therefore it is likely that the current worldwide trends in genotypic intelligence are determined at least as much by fertility differences between countries as by fertility differences within countries. The most important unknown quantity in this assessment is the extent to which genetic differences contribute to IQ differences between countries.
According to Lynn (Reference Khaleefa, Abdelwahid, Abdulradi and Lynn2008), the same relationships that we observe between national populations also apply to subpopulations within countries. Wherever different ethnic and racial groups live together in the same country, with great regularity the groups with the higher levels of education, income and psychometric intelligence have the lower fertility. Thus we observe the same kind of fertility differentials between countries, between subpopulations within countries, and between individuals within countries.
Interestingly, ‘peak oil’ (McPherson & Weltzin, Reference McPherson and Weltzin2008) is being reached at the same time that ‘peak IQ’ is reached in the most advanced countries. In our efforts to cope with resource depletion and other economic and ecological challenges, we can no longer rely on the inexorable rise of human intelligence that prevailed throughout the 20th century. Predictably, sometime during the 21st century the average intelligence of the world population will go into stagnation and finally begin to decline. The interdependence between intelligence, economy and education (Fig. 1, see also Dickens & Flynn, Reference Dickens and Flynn2001; Meisenberg, Reference Meisenberg2003) implies that economic development will follow on the same trajectory, most likely with a delay of one or a few generations.