I. INTRODUCTION
Size-dependent melting and evaporation are theoretically and experimentally validated phenomena.Reference Mei and Lu1 On the other hand temperature-induced solid state transitions at the nanoscale have been reported, but inadvertent particle reorganization, sublimation, or sintering change the dispersion and obstruct the experimental observation. Rivest et al. recently showed the size-dependent solid–solid transition of low-chalcocite to high-chalcocite copper(I) sulfide nanorods scattered on a substrate.Reference Rivest, Fong, Jain, Toney and Alivisatos2 They found a similar 1/D dependence of the transition temperature-like in melting of nanoparticles.Reference Mei and Lu1 Baldinozzi et al.Reference Baldinozzi, Simeone, Gosset and Dutheil3 investigated up to 680 °C the structure of nanocrystalline zirconia according to grain size using high-resolution neutron diffraction. They measured that the tetragonal volume fraction is nearly 100% for 10-nm particles, whereas it is only 50% for 60-nm ones. Curve extrapolation suggests no tetragonality above 200 nm. Suresh et al. also found a size dependency of the solid–solid phase transformation from the tetragonal to monoclinic form for yttria stabilized zirconia nanoparticles.Reference Suresh, Mayo, Porter and Rawn4 The proposed model relies on size dependent chemical potentials developed for the melting of nanoparticles. Navrotsky et al.Reference Navrotsky5–Reference Xu, Zhou and Navrotsky8 quantitatively showed the size-dependent polymorphism and drew phase diagrams of several oxides like alumina, titania, and zirconia. They also measured the impact of hydrated surfaces and of shape on the surface energy and stability. A summary of unusual phase compositions caused by nanometer-size was given by Andrievskii and Khachoyan.Reference Andrievskii and Khachoyan9
Yet, heating alters the size-distribution. So it is difficult to measure the transition temperature for a given particle size and it is more convenient to calculate the critical size (D c) for a phase transformation at a given temperatureReference Suresh, Mayo, Porter and Rawn4:
 $${1 \over {D_{\rm{c}} }} = {{\Delta _{{\rm{tr}}} H} \over {6\Delta \gamma v_{\rm{m}} }}\left( {1 - {T \over {T_0 }}} \right){\rm{\quad.}}$$
In analogy to the size-dependent melting, ΔtrH [J/mol], v m [m3/mol], and T 0 [K] are the bulk enthalpy of transition, the molar volume, and the bulk temperature of transformation, respectively. Δγ is the difference between the interfacial energies of the two phases [J/m2]. In the case of free particles this corresponds to the difference of surface energies between two solid phases before and after the transformation:
 $${\rm{\gamma }}_{{\rm{sv}}} ({\rm{phase }}\;1) - {\rm{\gamma }}_{{\rm{sv}}} ({\rm{phase }}\;2) = \Delta {\rm{\gamma }}\quad{\rm{.}}$$
But for sintered crystallites in a nanostructured material it changes to the difference in grain boundary energies. In the latter case an additional term to account for the deformation energy involved in the transformation has to be added. Apparently a major difference between free particles, a more or less compacted powder and a dense, polycrystalline material are their surface states: Single particles have free surfaces, agglomerated ones have a mixture of surfaces and interfaces to their neighbors and a dense body solely consists of grain boundaries. As interfaces rule the properties at the nanoscale such differences have decisive consequences. In practice working with nanoparticles evokes a lot of problems. Peculiarities of different syntheses often cause the size-dependent properties to be superimposed by other factors like residual stresses, interface segregations, size-distribution, nonequilibrium phases, impurities, and surface adsorbates. Characterization in the nanoscale is also challenging. The view on size-dependent behavior is therefore often blurred by several parasitic effects.
A. Bismuth oxide powder
The present work focuses on the stability of solid crystalline bismuth oxide. In the pure binary oxide the common oxidation state of Bi is +III, but in mixed valent Bi(III,V) oxides (e.g., Bi2O5Reference Kumada, Kinomura, Woodward and Sleight10) and in ternary oxides (e.g., KBiO3Reference Jansen11) the +V state has also been reported. Also subvalent bismuth oxides (e.g., BiOReference Zav’yalova, Imamov and Pinsker12) are known. However, most of the work on bismuth oxides concentrates on Bi2O3. The proportion of covalency in the bonds is approximately 60%. A number of different polymorphs are known and only the most important ones are mentioned here. They are summarized in Fig. 1 together with the approximate transition temperatures. The stable structures are monoclinic α-Bi2O3 (P21/c (14)) which transforms at 1002–1008 K to cubic δ-Bi2O3 (Fm3m (225)). Melting takes place from the δ-structure at 1077–1098 K (most often 1097 K) and the boiling point is 2163 K (in air). Two alternatively occurring, metastable phases are reported during cooling, the tetragonal β-Bi2O3 (P-421c (114)) or the b.c.c. γ-Bi2O3 (I23 (197)). The process is difficult to control and is strongly influenced by the presence of trace amounts of metal impurities and the texture of the sample. The conditions under which the phases form also seem to depend on the treatment history: heating rate, cooling rate, maximum temperature, and atmosphere. Furthermore β-Bi2O3 can be directly produced at room temperature (RT) by quenching from the melt, by decomposition of (BiO)2CO3 in air or bismuth oxalate in vacuum, or by additions of, e.g., CeO2 and ZrO2.Reference Chen and Eysel13,Reference Cedomir, Zdujic, Poleti, Karanovic and Mitric14 Similarly γ-Bi2O3 can persist down to RT and can be directly prepared from α-Bi2O3 by tempering with an addition of small amounts of CoO.Reference Mehring15 All this is proof for a complex, multifactorial behavior. It could be influenced by compositional changes. Several articles report the loss of oxygen during heating of δ-Bi2O3, Zav’yalova and ImamovReference Zav’yalova and Imamov16 state the stoichiometry of the δ-phase to be Bi2O < 2.7, and Klinkova et al.Reference Klinkova, Nikolaichik, Barkovskii and Fedotov17 proposed that the deciding difference between different polymorphs in pure bismuth oxide is the oxygen content. As proof of their hypothesis they showed that a transition from δ-Bi2O3 to γ-Bi2O3 or a distorted tetragonal structure (Fig. 1) could be achieved without cooling, simply by annealing at a constant temperature in vacuum (vacuum acting as a reducing atmosphere). The claim is further supported by the fact that all bismuth oxide high-temperature phases possess a considerable anionic conductivity, thus a high-oxygen mobility in the lattice. Strictly speaking it would mean that the different bismuth oxide structures are not true polymorphs, but that the structures depend inter alia on the Bi:O ratio.
Scheme of bismuth oxide structures. Red arrows indicate heating, blue arrows indicate cooling. The information is a composition from literature values cited in the text, mainly from Mehring73 and Klinkova et al.75 The transitions are reported to depend on multiple factors like maximum heating temperature and cooling rates. The absolute values of the temperatures and rates vary and no guarantee for the quantitative correctness can be given. Elevated temperatures in vacuum atmosphere can also provoke transitions (dashed arrows). Oxygen contents are from Klinkova et al.

The common bismuth oxide structures were summarized by Medernach and Snyder.Reference Medernach and Snyder18 The α-Bi2O3 as the stable RT phase has a monoclinic structure of P21/c space group with 8 Bi+3 and 12 O−2 atoms in the unit cell. The lattice parameters are a = 5.8444(2) Å, b = 8.1574(3) Å, c = 7.5032(3) Å, α,γ = 90°, and β = 112.97(1)°. The cubic δ-bismuth oxide has a calcium fluoride (CaF2) type structure in which 25% of the sites in the oxygen sublattice are vacant. This is the reason for its ionic conductivity.Reference Yashima and Ishimura19 It is an ongoing discussion whether the vacancies are statistically distributed.Reference Hull, Norberg, Tucker, Eriksson, Mohn and Stolen20 The unit cell has the dimension a = 5.6549(9) Å and contains 4 Bi+3 and 6 O−2 atoms. In certain cases the bismuth oxide can adopt to the metastable β-phase which has the same structure as the δ-phase, but with ordered oxygen positions.Reference Cedomir, Zdujic, Poleti, Karanovic and Mitric14,Reference Blower and Greaves21 It is described by a tetragonal unit cell with a = b = 7.7400(6) Å and c = 5.6446(6) Å. β-Bi2O3 has poor ionic conductivity (<10−2 W−1 cm−1)Reference Hull, Norberg, Tucker, Eriksson, Mohn and Stolen20. γ-Bi2O3 has a more complicated structure. As the structure is not relevant for this study it will not be further elaborated.
At the nanoscale, thin films of bismuth oxide were investigated by Zav’yalova et al.Reference Zav’yalova, Imamov and Pinsker12,Reference Zav’yalova and Imamov16 Due to the confinement other structures were observed and analyzed by x-ray diffraction (XRD) at RT. Among them was the metastable β-phase and a distorted form with the stoichiometry Bi2O2.5. More recently Fan et al.Reference Fan, Pan, Teng, Ye, Li and Zhang22 showed that β-Bi2O3 as well as δ-Bi2O3 thin films could be deposited by reactive sputtering of Bi onto NaCl, Si, ZrO2, quartz, and glass substrates with controlled temperature. The films were polycrystalline with an average grain size of ≤20 nm. While the δ-phase only formed in a narrow temperature window around 473 K, the β- and α-phases were readily achieved at higher temperatures. There are a few reports on synthesized bismuth oxide nanoparticles and needles from different groups.Reference Huang, Leu and Fung23–Reference Liu, Jiang, Jin, Xia and Tang30 If reported the typical structure was β-Bi2O3. Only Han-Xiang et al. also prepared the δ-phase by a vacuum vapor-phase oxidation.Reference Hu, Qiu and Xu31 Except for XRD no further characterization of the particles took place. Hence no surface energies or other thermodynamic properties of bismuth oxide nanoparticles are known.
II. EXPERIMENTAL PROCEDURE
A commercially available Bi2O3 nanopowder (NanoArc®, Alfa Aesar Industries, Karlsruhe, Germany) with a 99.5% purity and a stated size of 38 nm and a high-purity α-Bi2O3 micrometer powder (99.9998%-Bi Puratrem, STREM chemicals Inc., Newburyport, MA) were used.
The nanopowder was dispersed in pure ethanol and treated with an ultrasonic finger for 1 min. A drop of the dispersion was allowed to dry on a carrier glass. After sputtering a gold (Au)–palladium (Pd) coating the samples were investigated with a Field-Emission Scanning Electron Microscope (FESEM; model FEI XL30; FEI, Hillsboro, OR, …). Room temperature XRD was carried out with a 2D-detector at beamline P02.1 (λ = 0.207309 Å), PETRA III, HASYLAB, Hamburg. From the line profile the isotropic crystallite size was determined.Reference Rodriguez-Carvajal, Roisnel, Andersson, Mittemeijer and Welzel32
For analyzing the high-temperature behavior of agglomerated bismuth oxide nanoparticles in the solid state, high-temperature x-ray diffraction (HT-XRD), as well as differential thermal analysis with combined thermogravimetry (DTA-TG) and differential scanning calorimetry (DSC) measurements were performed in different atmospheres. HT-XRD measurements were carried out with a Bruker D8 diffractometer (Bruker Corporation, Billerica, MA) in Bragg–Brentano geometry with an Anton–Paar HTK 1200N high-temperature chamber (Anton Paar GmbH, Graz, Austria). The powder was shed onto a platinum foil, slightly compacted and aligned on the sample stage. Two cycles of a temperature ramp of 10 K/min from RT up to 1153 K and back were performed for every sample. A 11° 2Θ window from 25 to 36° was recorded every 15 K with a Super Speed VÅNTEC-1 detector (Bruker Corporation, Billerica, MA). The measurements were performed in air without gas flow, inert gas (He) at 0.03 std L/min, and technical vacuum (approx. 1 Pa). Rietveld refinement of the patterns was done with the program FullProf.Reference Rodriguez-Carvajal, Roisnel, Andersson, Mittemeijer and Welzel32
DTA-TG-MS and DSC were measured with different calorimeters. DTA-TG at 300 mL/min gas flow of inert gas (Ar) and air in alumina crucibles as well as one experiment in Ar with a reductive graphite crucible was performed in a Netzsch STA 449 C Jupiter machine (Netzsch GmbH, Selb, Germany). The device had an attached mass spectrometer (MS) for analysis of volatile species. DSC was performed under inert gas (Ar) with a gas flow of 20 mL/min in a Netzsch Pegasus 404F. The specific heat values were calculated by comparing the signal with the one of a known mass of sapphire which was heated with identical parameters. The samples were weighed before and after the measurements. All measurements were performed with 10 K/min heating and cooling rates up to 1183 K and usual alumina crucibles were used.
III. RESULTS
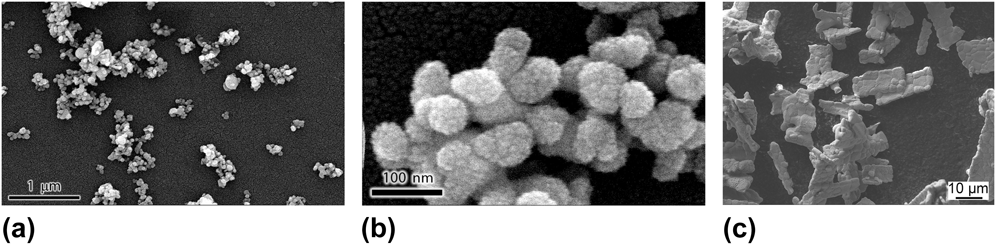
As shown in Fig. 2, the nanopowder is composed of hard and soft agglomerated primary particles with a mean size of approx. 50 ± 7 nm. This average size was confirmed from line broadening of the diffraction patterns presented in Fig. 3 (50 nm). A β-Bi2O3 phase was found with a = b = 0.7737 nm and c = 0.5635 nm as lattice parameters. A few weak reflexes indicated small amounts of another phase which is not α-, β-, γ-, δ-, or any other reported Bi2O3 polymorph but bismuth hydroxide Bi(OH)3. The micrometer powder consists of elongated sintered agglomerates (of at least 10 µm in length) for which the grain size is about 1–3 µm.
SEM micrographs of the commercial Bi2O3 powders. Nanopowder: (a) In the overview the agglomerates are visible. (b) The HR image shows the primary particles. The rough surface is caused by the sputtered AuPd film. Micrometer-size powder (c) composed of dense sintered agglomerates.
X-ray diffractograms and Rietveld refinements measured at PETRA III, beamline P02.1 (λ = 0.207309 Å) in air. The structure of the commercial nanopowder is β-Bi2O3. The stars indicate reflexes of bismuth hydroxide which is a result of aging under ambient conditions.
A. DSC and DTA-TG
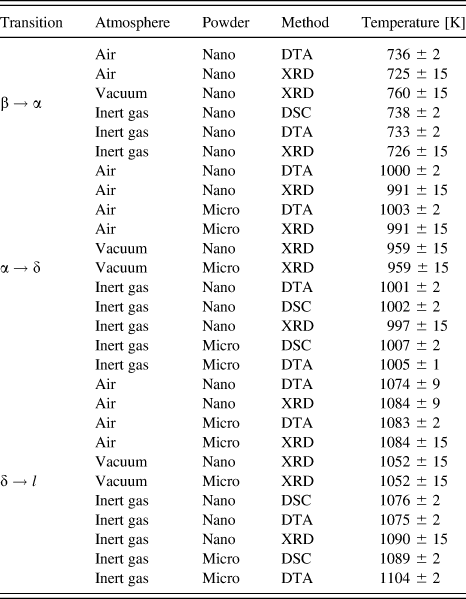
The endo- and exothermic processes in the samples were measured and compared with DSC. Figure 4(a) shows the first heating cycle of both nano- and micrometer-powder. The latter shows the two expected endothermic peaks of the α → δ transition at 1007 K and melting at 1089 K, whereas the nanopowder undergoes two further exothermic peaks and an endothermic rise in between. Furthermore the melting peak is broadened and the maximum is lower. The ΔmH (integrated area) of the nanopowder has 15.2 ± 4 kJ/mol and the one of the micrometer-powder has 14.2 ± 1 kJ/mol. Both values lie within the known, broad scattering range.Reference Risold, Hallstedt, Gauckler, Lukas and Fries33 In the second heating cycle the nanopowder lacks the additional peaks and shows the common bulk behavior. It should be mentioned that the reactive melt (always bulk) apparently attacks the alumina crucible and slowly changes the composition of the sample. This can be seen in the second and third heating cycles which are not shown here. All transformation temperatures are listed in Table I. Additionally DTA-TG measurements were performed with the same experimental parameters. But two different atmospheres were used: air and inert gas. Yet, no significant differences could be observed between the chosen atmospheres. Additional information comes from the gravimetric curve and the mass spectroscopy [Fig. 4(b)]. They show that up to the transition around 733–739 K the sample lost 1.6% of its mass. The detectable main gas species have masses of m = 12, 16, 30, 32, and 44 which can be attributed to C, O, C2H6/CH2O, O2, and CO2, respectively. The small transition at 584 K is accompanied by a peak in m = 12, 30, and 44 and the larger transition at 733 K correlates with peaks in m = 16, 30, and 32. Beyond 750 K no mass loss occurs anymore. Possible heavy species like Bi(g) (m = 209) could not be measured by the spectrometer.
(a) DSC measurement of Bi2O3 nano- and micrometer-powder in argon at ambient pressure. Nanopowder: Minimum at 588 K and exothermic event at 738.6 K, endothermic α → δ phase transition at 1002.3 K and melting at approximately 1076 K. Micrometer-powder: The powder resides in the α-phase at RT and no exothermic events occur below 1002 K. (b) DTA-TG and MS measurement of the nanopowder between 300 and 820 K. The gravimetric curve (black) is plotted on the left and the MS signal on the right ordinate. The same transitions could be observed up to 750 K. The sample looses −1.6% of weight until 750 K and mass spectroscopy measures increased amounts of gas species. For example m = 30, 32, and 44 are shown. After the transition around 733 K mass loss and evaporation stop abruptly. The heat signal and dashed lines are just for orientation.
Temperatures for β → α, α → δ, and δ → l transitions measured with different methods and in varying atmospheres. The commercial Bi2O3 nanopowder (nano) and an ultra pure micrometer powder (micro) were measured.
B. HT XRD
As complementary method high-temperature XRD was performed, which gave structural information, as well as insight into the evolution of the mean particle size. Additionally the XRD could also be performed in actively pumping vacuum (∼1 Pa), not only in air but also in inert gas. The same previously characterized commercial nanopowder and also the same heating rate was used so that the transition temperatures could be compared, even if kinetic processes played a role. The 12° window recorded every 15 K (e.g., Fig. 5) was evaluated to observe structural changes. In this way it was confirmed that the transitions around 1000 K and around 1075 K highlighted by DSC are indeed the α → δ and the δ → l (melting) transitions. As the nanopowder resided in the metastable β-phase at RT, an additional transformation from the β- to the α-phase was measured at 725 ± 15 K. This coincides with the exothermic transition in DSC and DTA. The evolution of the average, volume weighted, crystallite size was traced by analyzing the line profile broadening which gave insights into the sintering of the particles. Figure 6 shows the particle growth in the different atmospheres at increasing temperatures. Starting at an initial size of 50 nm growth set in at around 630 K. From there on the size rapidly increased up to the β → α transformation. In vacuum the transformation temperature was higher and the crystallites grew larger.
A 12° window with the major Bi2O3 reflexes during heating at 10 K/min captured in temperature steps of 15 K in (a) inert gas and (b) pumped to ∼1 Pa from ambient air. The β → α transition of the commercial Bi2O3 nanopowder took place between 717–733 K in air and inert gas and between 749–767 K in vacuum. First the (−111) and (112) reflexes of α-Bi2O3 around 29° formed and in the next step also the other reflexes had changed from the β- to the α-structure.
Average, isotropic crystallite sizes calculated from reflex broadening of commercial β-Bi2O3 for the patterns shown in Fig. 5. It indicates grain growth started around 630 K. The crystallites grew until the temperature for the β → α transition was reached (dashed lines). In vacuum the particles were bigger and the transition occurred later. For illustration: A change from 50 to 70 nm would correspond to a doubling in volume (e.g., coalescence of two 50 nm particles).
A summary of all transition temperatures is given in Table I. Several facts are remarkable: The β → α transition was approx. 35 ± 5 K higher in vacuum compared to the transitions at ambient pressure. On the other hand, the α → δ transition was roughly 30 K lower in vacuum. The shape of the melting peak in the calorimetric curves was much broader and lower for the nanopowder than for the micrometer-powder and the onset temperatures tended to be lower. Generally the scattering of the melting temperature and enthalpy of melting are large for Bi2O3. Still the melting point seemed to be shifted by approx. −30 K in vacuum- independent of nano- or micrometer-powder size.
IV. DISCUSSION
The discussion intends to combine the results from size and shape determination, RT characterization, and high-temperature investigation to explain the size-, temperature-, and atmosphere-dependent behavior of bismuth oxide nanoparticles in the solid-state regime.
A. Room temperature
The stable structure of bismuth oxide nanoparticles at RT under oxidizing, inert, and slightly reducing (vacuum) conditions is the tetragonal β-structure, which is metastable in the bulk. Interestingly, Jovalekić et al.Reference Cedomir, Zdujic, Poleti, Karanovic and Mitric14 while mainly describing the stabilization of β-Bi2O3 at RT by additions of ZrO2 mention that the Bi–O had to be in a very fine-grained, nanocrystalline state. Moreover quenching, which has been reported as process to stabilize the β-phase,Reference Levin and Roth34 tends to produce very fine-grained microstructures. These are possible hints that also in polycrystalline bulk the size of the crystallites plays a role in stabilizing this phase. Generally, size-stabilization is a common process in oxide materials and has been reported for, e.g., alumina, zirconia, and titania by Navrotsky et al.Reference Navrotsky5 Due to the surface contribution the total free energy of the material is altered at the nanoscale; if the contribution gets strong enough high-temperature or metastable phases with lower γsv can become favorable at RT. So it can be assumed that the surface energy of β-Bi2O3 is considerably lower than the one of the α-phase. But the hypothesis is hard to verify: Only theoretical values of γsv for different planes of the bulk RT structure (α-Bi2O3) are known from density functional theory (DFT) calculationsReference Lei and Chen35: between 0.25 and 0.8 J/m2. An approximate value of 0.3 J/m2 for the surface energy of β-bismuth oxide nanoparticles was given in another recent publication.Reference Guenther, Theissmann and Guillon36 This lack of precision does not allow a definite final statement. Apart from that only values for the melt were reported.Reference Guenther, Theissmann and Guillon36,Reference Fujino, Hwang and Morinaga37
Moreover, surfaces with their oxygen vacancies or unsatisfied bonds tend to adsorb water and bind hydroxyls, carbonates and/or oxygen to reduce their surface energy and further stabilize the system. This also seems to be true for bismuth oxide: Under heating in DTA-TG-MS O, O2, C, CO2, and some other species are released into the gas phase. Different oxidation states in the O1s peak, an overstoichiometric amount of oxygen and a C1s line in x-ray photoelectron spectroscopy (XPS) of synthesized nanoparticles also indicate the presence of carbon and oxygen containing groups – presumably on the surface.Reference Guenther, Kruis and Guillon38 The spectroscopic study by Barreca et al.Reference Barreca, Morazzoni, Rizzi, Scotti and Tondello39 discovered a carbonated surface at RT. This is typical for oxides which can form carbonates (e.g., bismutite, Bi2O2CO3).Reference Huang, Li, Yan, Zheng and Li40 Even on α-Bi2O3 surfaces layers of the β form were found after surface-carbonate decomposition. In this context the ordered oxygen vacancies in β-Bi2O3 play an important role.Reference Chen and Eysel13,Reference Barreca, Morazzoni, Rizzi, Scotti and Tondello39 The other way round β-Bi2O3 is the phase that forms from decomposition of Bi2O2CO3. So carbonated bismuth oxide and the β-structure seem to be linked on the surface as well as in the bulk. This makes the β-phase even more favorable for nanomaterials with their large surface area.
On the other hand, hydroxylation by aging at RT in humid air is also possible. This can be seen in the diffractogram of the commercial nanopowder (Fig. 3). The same powder could also easily be hydroxylized by ultrasonic treatment in water within minutes. Already in 1964 Levin et al.Reference Levin and Roth34 reported the formation of a bismuth carbonate (bismutite) and an unknown, not described phase as aging effect for micrometer-powder. But bismutite could not be observed for the nanopowder.
While the exact processes are not clear one can nevertheless conclude that bismuth oxide has a carbonated surface and is reactive under atmospheric conditions. It should be sealed for storage to avoid compositional changes.
B. Solid state transitions
When discussing the heating experiments, it is important to recall that compacted, agglomerated powders and no separated particles were used. Hence, the particles have two kinds of interfaces: Surfaces in contact with the surrounding gas and sintering necks (grain boundaries) between neighboring particles. This alters the total surface/interface energy compared to free particles. By heating such samples, sintering will begin prior to melting and when reaching the melting point a densified, coarse-grained bulk will have formed. Such experiments are not helpful for investigating the melting and evaporation behavior of nanoparticles (as shown in ref. Reference Guenther, Theissmann and Guillon36 and Reference Guenther, Kruis and Guillon38). One can only learn about solid-state properties of agglomerated nanopowders, like in this paper. By combining the findings from the calorimetric measurements and the diffraction measurements one gets a consistent picture of the phase transitions of agglomerated bismuth oxide nanopowder, in particular the β → α transition.
Two unexplained peaks exist in the caloric curve of Fig. 4(a). Both of them are considerably lower than any observed melting temperature.Reference Guenther, Theissmann and Guillon36 Therefore, a melting and solidification process as described by Schierning et al.Reference Schierning, Theissmann, Wiggers, Sudfeld, Ebbers, Franke, Witusiewicz and Apel41 cannot be the explanation for the alternating exo- and endothermic events. The first minimum is at 588 K. No structural changes were observed but the mass decreased strongly in this region, accompanied by a rise of the C, CO2, and C2H6/CH2O concentrations. A lowered sample mass corresponds to a smaller signal in DSC. So a sudden mass loss leads to a falling signal, which could erroneously be interpreted as exothermic process. The following region of a steadily rising DSC signal includes the region of particle growth (Fig. 6) which is usually preceded by neck formation and densification. These first sintering stages could not be detected by XRD. Hence, the observed rise is due to sintering of the sample. It is accompanied by further evaporation of more strongly bound oxygen and carbon containing species which is also an endothermic process. It leads to an elevated signal, too. Ergo, the rising signal between 588 K and 738 K probably comes from the combination of sintering particles and evaporating surface species.
At T tr = 738 K the phase transformation from the β-phase of the nanoparticles to the bulk α-phase takes place. This transition can only occur in the nanopowder and its summarized features are:
(1) The peak has the typical shape of an exothermic phase transformation [Fig. 4(a)].
(2) The crystallite growth increases rapidly up to the point of phase transition, yet different sizes and temperatures were measured in different atmospheres (Fig. 6).
(3) β-Bi2O3 remains stable up to the melting point in free nanoparticles between 7 and 50 nm.Reference Guenther, Theissmann and Guillon36
(4) Along with mass loss O, O2, and C2H6/CH2O (deduced from MS) reach their maximum concentration and vanish abruptly after the sample has fully transformed [Fig. 4(b)].
(5) Between 663 and 763 K bulk bismutite switches from decomposition to β-Bi2O3 to decomposition to α-Bi2O3Reference Levin and Roth34,Reference Levin and Roth42 and in the same temperature region surface carbonate conversion to pure Bi2O3 surfaces takes place.Reference Barreca, Morazzoni, Rizzi, Scotti and Tondello39
This set of information together with the preceding findings is interpreted in the following paragraph and a graphical explanation is given in Fig. 7. The following equation describes the total free energy G of a spherical nanoparticle:
 $$G_{P,T,n} = {1 \over 6}\pi D^3 {\mu \over {v_{\rm{m}} }} + \pi D^2 \gamma {\rm{\quad.}}$$
Scheme of the postulated stability diagram at constant T in attempt to explain the β → α transformation. No units and values are given as it is a qualitative illustration. A phase transformation occurs at G(α) = G(β) which depends on the slope of the curves. This in turn depends on the surface energy of the phase. As carbonization decreases γsv, the critical size is larger for carbonated than for decarbonated β-Bi2O3. In region (a) α-Bi2O3 is always the stable form. In the intermediate region (b) β-Bi2O3 is stable below and α-Bi2O3 above the temperature for decarbonization (∼735 K). Region (c) is the absolute stability region of β-Bi2O3. The scheme is valid for a moment of constant temperature. In reality particles will grow and change at T > 500 K. Also the partial pressures of gas species (which affect the equilibria of the decomposition reactions of the carbonate surface) are considered to be constant.
where μ is the chemical potential. In Fig. 7 the total free energy of different Bi2O3 phases (including different surfaces) is plotted over the reciprocal diameter. This renders a straight line that is proportional to the interface/surface energy γ. The reciprocal size is representative of the specific surface energy (second half of Eq. (3)) contributing to the total free energy of the system as an excess energy (for bulk samples it can be neglected). It thus changes the phase boundaries with increasing amount of surface. This is a typical way of displaying size-dependent phenomena in nanomaterials and the lines can be understood as phase boundaries, just like in a traditional phase diagram.Reference Guenther, Theissmann and Guillon36,Reference Kaptay43 In analogy to traditional phase diagrams the intersections between two lines also mark phase transitions. In this 2D-plot the other state variables (P, T) are kept constant (the amount of mater n is always constant in an isolated particle-system). For explaining the proposed model this is a valid simplification. The interrelation with the other state variables will be discussed afterward.
β-Bi2O3 nanoparticles are stabilized in this phase because of a presumably low-surface energy making the total free energy lower than the one of α-phase nanoparticles of the same size. The size-dependent chemical potentials change with 1/D [Eq. (1)]. At a certain, critical size (D c(T)) where G(β) = G(α) the β → α transition can occur (blue square). Below this size β-Bi2O3 is always stable. The ability of β-Bi2O3 to bind carbonate groups further lowers the surface energy and acts stabilizing. Therefore the critical size (D c,c(T)) for G(βcarbonated) = G(α) should be larger (orange square). According to literatureReference Levin and Roth34 particles larger than 100 nm can be stable with a carbonated surface. But ultimately also a carbonated β-Bi2O3 particle should transform to α. Above that critical size α-Bi2O3 is always stable. When the nanopowder is heated the particles grow by sintering and enter region (b) of Fig. 7, where they are only stable because of their carbonated surface. At the temperature which corresponds to the measured transition temperature (independent of their size, as long it is in region (b)), 735 K, they loose their carbonate layer, which increases their surface energy γsv. Thus at the given set of T and D they move from the orange to the blue line (orange–blue arrow) and suddenly D > D c. Consequently, the transformation to the α-phase (blue–black arrow) occurs together with the vaporization of the carbon and oxygen containing species on the surface. It also makes plausible how different sizes can all transform around the same temperature (735 K). Separate particles in the transmission electron microscopy (TEM) which are not able to grow remain below D c and rest in the β-phase until they melt.Reference Guenther, Theissmann and Guillon36 Apparently, this model is able to explain all observed phenomena but ought to be put on a sounder basis by a systematic, size-dependent/heating-rate-dependent study which also includes control of the relevant partial pressures (pO2 and pCO2).
While this model is able to describe the observed phenomena, it has some simplifications concerning the state variables T and P, which will be discussed now: Fig. 7 is a two-dimensional diagram. Thus it shows the total free energy in dependence of just one state variable: size (representative for the surface area) while T and P are considered to be constant.
Firstly, G is a function of temperature which differs from phase to phase. So the points of phase transitions (intersections in Fig. 7) will differ from temperature to temperature. The only hint in this unknown field is that small, separated Bi2O3 nanoparticles between 6 and 50 nm (region (c)) did not undergo any solid-state phase transformation until reaching the melting point (in vacuum).Reference Guenther, Theissmann and Guillon36 This is a clue that the relative temperature-dependent changes between G(β) and G(α) do not change the basic scheme outlined in Fig. 7.
Secondly, G rises with increasing pressure P. But in solid-state transitions P usually has a very small influence in the ambient pressure regime. Yet, another aspect is the partial pressure of different gas species. They are important for chemical reactions where a condensed phase reacts with an ambient gas. This is the case for the decomposition of the postulated surface carbonates which stabilize the nanoparticles at larger sizes (region (b) at T > 735 K) according to the model. For the decomposition of carbonates the partial pressures of the common ambient gases oxygen (pO2) and carbon-dioxide (pCO2) are relevant. Usually a solid educt and the gases (O2 and/or CO2) react to a gaseous product in such decomposition reactions. Different reactions are conceivable. As the exact surface structure and stoichiometry are unknown, the reactions and the equilibrium including its dependence of the partial pressures cannot be calculated.Reference Lamoreaux and Hildebrand44,Reference Eriksson45 If for example the surface was bismutite, the reaction would simply be
 $${\rm{Bi}}_2 {\rm{O}}_2 {\rm{CO}}_3 ({\rm{s}})\;\rightleftharpoons\;{\rm{Bi}}_2 {\rm{O}}_3 ({\rm{s}}) + {\rm{CO}}_2 ({\rm{g}}){\rm{\quad.}}$$
Despite the many unknowns a general statement is true: p(CO2) will increase by the reactions (reaction product) and thus a higher p(CO2) would stabilize the carbonate-surface up to higher temperatures. The partial pressures of O2 and CO2 were not actively controlled in any experiment. Yet, the different experiments in inert gas and in air show that the large differences in p(O2) and the small ones in p(CO2) (pure Ar has p(CO2) = 0 and air has p(CO2) ≈ 400 ppm) did not have any influence on the transition temperatures (see Table I).
The transition temperature in vacuum is higher than in the other two atmospheres. As only HT XRD measurements could be performed in that atmosphere, the information is limited. An explanation could be that the lack of heat conduction through the gas causes the actual temperature in the sample to be lower than the measured temperature of the heating stage. In that case the powder would also experience a slower heating rate which could explain the larger size in Fig. 6 as well. Apart from the measurement technique the reason could also lie in the material itself: As already explained in the introduction the atmosphere influences the oxygen deficiency on the surface and inside the oxide material and consequently its physical properties (including γ).Reference Zav’yalova and Imamov16,Reference Klinkova, Nikolaichik, Barkovskii and Fedotov17,Reference Deng, Hao, Xu and Wang46–Reference Godinho, Walsh and Watson52 This can even reduce an oxide to a metal.Reference Guenther, Schierning, Theissmann, Kruk, Schmechel, Baehtz and Prodi-Schwab53 Surely the high-oxygen mobility in the anionic conductor Bi2O3Reference Boyapati, Wachsman and Jiang54,Reference Hull, Norberg, Tucker, Eriksson and Mohn55 supports such behavior since it facilitates the creation of vacancies on the surface and in the core. Molten Bi2O3 in vacuum can even lead to a reduction to metallic bismuth.Reference Guenther, Theissmann and Guillon36 In any case it is not clear how far the proposed model can be transferred from ambient pressure to vacuum-conditions – For the least, the slopes will change due to different surface energies.
The critical size at RT is an interesting value. According to Eq. (1) the correct critical size at RT is smaller than the measured critical size at 738 K, just like the T m(r) becomes lower for smaller sizes. For a qualitative statement the parameters in Eq. (1) would have to be known.
After this size-dependent nanophase to bulk-phase transformation the initial nanopowder behaves like Bi2O3 micrometer-powder with the regular transition temperatures.
V. CONCLUSION
In this work several complementary methods such as DSC, DTA-TG-MS, and HT XRD were used to investigate the phase transitions of milligram amounts of bismuth oxide nanoparticles. A nanophase (β) → bulk-phase (α) transition was observed which was preceded by crystal growth and evaporation of O and C containing species. An interpretation was proposed that successfully explains all observations: A sudden destabilization takes place due to the loss of the stabilizing, carbonized surface, but only above a critical size. Scattered nanoparticles without the possibility of growth stayed below that size and thus remained in the β-structure up to their melting point.
Bismuth oxide itself has a nontrivial behavior which depends on the atmosphere. A better understanding and calculation of the multiphase equilibrium would be helpful for any high-temperature application and vacuum process. Furthermore surfaces play a decisive role for evaporation and for properties of nanomaterials. Since they are responsible for most changes at the nanoscale a better understanding of surface structures, or at least knowledge of the average surface energy from independent methods would be important. Adsorbates, atmosphere, and temperature have a decisive impact on these properties and should be considered, too. Such knowledge would allow a better assessment of models and the size-dependent properties could be determined much more accurately.
Acknowledgment
We acknowledge financial support of the Deutsche Forschungsgemeinschaft (DFG) within the frame of the Emmy Noether program (GU 993/1-1), as well as experimental support at synchrotron (M. Hinterstein), DTA operated by Claudia Fasel and DSC by Katharina Klinski-Wetzel.