Introduction
Mineral inclusions are recognized as essential carriers of geological and petrogenetic information, such as palaeomagnetic transformations and metamorphic events experienced by the host minerals. The properties and chemical composition of inclusions are closely associated with the rock history and, in some cases, can be used to infer the pressure-temperature conditions during the host mineral formation (Ashley et al., Reference Ashley, Darling, Bodnar and Law2015). Shape-preferred orientated inclusions are commonly observed, often presenting as needle or lamella shapes elongated parallel to one or several crystallographic directions of the host crystal. Various shape-orientated inclusion-host pairs have been studied, such as orientated rutile inclusions in corundum (Palke and Breeding, Reference Palke and Breeding2017) or garnet (Hwang et al., Reference Hwang, Shen, Chu, Yui and Iizuka2015); orientated iron oxides in feldspar (Jin et al., Reference Jin, Sun and Palke2022) and pyroxene (Feinberg et al., Reference Feinberg, Wenk, Renne and Scott2004); and orientated ilmenite in magnetite (Tan et al., Reference Tan, He, Wang, Dong, Liang and Zhu2016) and amphibole (Xu et al., Reference Xu, Zhao, Zhou, He and Xu2020).
Although most inclusion studies focus on geological implications, shape-orientated inclusions can also contribute to the aesthetic of gemstones. Rough crystals containing abundant shape-orientated inclusions or parallel fine channels can display distinct optical effects, such as chatoyancy and asterism, after directional polishing. Numerous gemstones are known to exhibit these effects, ranging from commonly studied varieties such as corundum, chrysoberyl and garnet, to rarer minerals including beryl, tourmaline and quartz (Schmetzer et al., Reference Schmetzer, Bernhardt and Kiefert2002; Schmetzer et al., Reference Schmetzer, Kiefert and Hänni2004; Schmetzer et al., Reference Schmetzer, Bernhardt and Gilg2016; Yu et al., Reference Yu, He and Lu2019). The arrangement and orientation of inclusions determine whether the gemstone exhibits asterism or chatoyancy. Therefore, research into orientated inclusions holds value in mineralogical, geological and gemmological contexts.
The potential growth mechanisms of orientated inclusions are inherently complex, involving not only the distinct chemical compositions of host and inclusion phases but also their crystal structures and mutual crystallographic relationships. Geochemical data from inclusions can reflect the composition and evolution of the crystallizing fluid, while crystallographic relationships provide constraints on the space and time of inclusion formation. For example, the formation of orientated monazite inclusions in apatite, which consumed rare earth elements (REEs) from the host apatite, has been interpreted as a product of fluid-assisted dissolution-reprecipitation replacement reactions (Harlov et al., Reference Harlov, Andersson, Förster, Nyström, Dulski and Broman2002; Harlov et al., Reference Harlov, Wirth and Förster2005). Information about inclusion shape, spatial distribution, and the orientation relationships such as shape orientations relationships (SORs) and CORs, are widely recognized as fundamental to understanding inclusion formation mechanisms (Habler and Griffiths, Reference Habler, Griffiths, Heinrich and Abart2017). When inclusions of a single phase present within a host exhibit consistent SORs, a unified SPO is typically observed. CORs, which describe systematic misorientations between neighbouring crystals, can provide insight into whether inclusions formed via two-dimensional (2D) interface controlled nucleation on a single surface of the host or under three-dimensional (3D) volumetric control, involving nucleation within the host and orientation control by simultaneous interaction of multiple sets of planes (Habler and Griffiths, Reference Habler, Griffiths, Heinrich and Abart2017; Kohn et al., Reference Kohn, Griffiths, Alifirova, Daneu, Ageeva, Abart and Habler2024). However, CORs alone are often insufficient to definitively determine contact geometry or inclusion origin. Detailed interpretation generally requires large spatially resolved datasets that capture variation in multiple parameters across microstructural domains (e.g. Kohn et al., Reference Kohn, Griffiths, Alifirova, Daneu, Ageeva, Abart and Habler2024).
In some cases, inclusions of a single phase occur with multiple crystallographic orientations relative to the host, leading to a variety of CORs. However, not all these relationships reflect specific, fixed lattice alignments. Alternatively, some inclusions may exhibit statistical CORs (also termed non-specific CORs), characterized by a certain freedom of misorientation between the inclusion and host lattices (Griffiths et al., Reference Griffiths, Habler and Abart2016). To distinguish between specific and statistical CORs, and to assess their representativeness within a given system, a sufficiently large and representative number of inclusions must be analysed. Using EBSD, large COR datasets can be acquired. When combined with transmission electron microscopy (TEM), detailed analysis of angular misorientations and interface structures of a specific host-inclusion pair become possible. Together, these analytical methods are widely applied to investigate inclusion growth mechanisms and their relation to rock-forming conditions (Feinberg et al., Reference Feinberg, Wenk, Renne and Scott2004; Proyer et al., Reference Proyer, Habler, Abart, Wirth, Krenn and Hoinkes2013; Britton et al., Reference Britton, Jiang, Guo, Vilalta-Clemente, Wallis, Hansen, Winkelmann and Wilkinson2016; Griffiths et al., Reference Griffiths, Habler and Abart2016; Habler and Griffiths, Reference Habler, Griffiths, Heinrich and Abart2017; Keller and Ague, Reference Keller and Ague2019; Griffiths et al., Reference Griffiths, Habler and Abart2020; Ageeva et al., Reference Ageeva, Habler, Gilder, Schuster, Pertsev, Pilipenko, Bian and Abart2022; Kohn et al., Reference Kohn, Griffiths, Alifirova, Daneu, Ageeva, Abart and Habler2024).
Recently, some interesting apatite specimens with shape-preferred orientated inclusions have been found in a secondary deposit in Madagascar, exhibiting a pronounced chatoyancy following directional cutting and polishing. In hand specimen, the apatite appears greyish-yellow and contains abundant, lath-shaped inclusions that display metallic lustre under reflected light. Apatite frequently exhibits chatoyancy, and some African countries, such as Madagascar, Tanzania, Kenya, and Namibia, are notable sources of chatoyant and asteriated apatite (Barot et al., Reference Barot, Graziani, Gübelin and Rettighieri1995; Johnson, Reference Johnson2014). India, Myanmar, and Sri Lanka also reported occurrences of similar materials (Mauthner and Ottaway, Reference Mauthner and Ottaway2015). The chatoyant effect in apatite is generally attributed to inclusions with shape-preferred orientation, previously identified as goethite or Fe-bearing inclusions from the Taita Mountains in Kenya (Barot et al., Reference Barot, Graziani, Gübelin and Rettighieri1995), and the Darren mine located near Ambilobé in the Vohemar District of northern Madagascar (Rakovan and Laurs, Reference Rakovan and Laurs2016), parallel growth tubes (Kammerling et al., Reference Kammerling, Koivula, Johnson and Fritsch1995), or short, fibrous white inclusions from Madagascar (Kammerling and Koivula, Reference Kammerling and Koivula1990; Barot et al., Reference Barot, Graziani, Gübelin and Rettighieri1995; Kammerling et al., Reference Kammerling, Koivula, Johnson and Fritsch1995; Rakovan and Laurs, Reference Rakovan and Laurs2016). Moreover, monazite, dolomite, hematite, magnetite, pyrrhotite and triphylite inclusions elongated along the c-axis of the host have also been reported in apatite (Zhang and Liou, Reference Zhang and Liou1999; Harlov et al., Reference Harlov, Andersson, Förster, Nyström, Dulski and Broman2002; Sun et al., Reference Sun, Tang, Sun, Xu, Zhai, Liang, Liang, Shen, Zhang and Zhou2007; Broska et al., Reference Broska, Krogh Ravna, Vojtko, Janák, Konečný, Pentrák, Bačík, Luptáková and Kullerud2014; Kurylo et al., Reference Kurylo, Broska and Reto2025).
While previous studies have focussed on the phase, compositions, and P-T formation conditions of inclusions in apatite (Broska et al., Reference Broska, Krogh Ravna, Vojtko, Janák, Konečný, Pentrák, Bačík, Luptáková and Kullerud2014; Rakovan and Laurs, Reference Rakovan and Laurs2016), relatively little literature exists regarding either the crystallographic orientation relationships between inclusions and the apatite host, or their potential to document the crystallization history of either phase. In this study, these unusual apatite specimens from Madagascar are analysed using EBSD to determine crystallographic relationships between inclusions and host. Additionally, EPMA and EDS mapping are used to investigate the chemical composition, and Raman spectroscopy used to identify the phases. These results contribute to understanding the growth mechanisms of orientated inclusions in apatite and provide some insights relevant to other gemstones exhibiting similar optical features.
Materials and methods
Euhedral apatite samples have been collected from a mineral dealer, who claimed they were sourced from the secondary deposit in Madagascar. Photos of apatite samples were taken by a Nikon D810 camera and Leica DFC 550-M205-A microphotographic system at the Gemmological Institute of China University of Geoscience (Wuhan).
Two thin sections were sliced from apatite A1 and A2 and named TS-1 and TS-2, respectively. TS-1 is cut nearly parallel to the visible basal pinacoid of sample A1, and TS-2 is cut nearly parallel to one of the visible hexagonal prism facets of sample A2. The sections were polished for EPMA, EDS, and EBSD analysis. First, a series of diamond powders with decreasing grain-sizes from 1 μm, 0.5 μm, 0.25 μm to 0.05 μm were used for preliminary polishing, each step was for ~20 minutes; later, they were polished in a vibratory polisher for approximately eight hours with 0.05 μm silica polishing solution to remove defects more effectively. Optical observation and microphotography were conducted on a Zeiss Axioscope A1 polarizing microscope at the Advanced Microscope Laboratory of the School of Earth Science, China University of Geosciences (Wuhan).
Major element compositions of the apatite were conducted at Wuhan Sample Solution Analytical Technology Co., Ltd., Wuhan, China, using a JEOL JXA-8230 EPMA. The analysis was performed with an accelerating voltage of 15 kV, an electron probe current of 10 nA, and a defocussed beam of 5 μm. The peak counting time was 10 seconds on element peaks and 5 seconds on background for each element. The following mineral standards were used: quartz (Si); olivine (Mg); magnetite (Fe); rhodonite (Mn); apatite (Ca); jadeite (Na); apatite (P); celestite (Sr); baryte (S); monazite (Nd, Ce and La); tugtupite (Cl); apatite (F). These elements were measured by the WDS crystals: PETJ (Ca, La and Ce), TAP (Na, Mg, Si, and Sr), LIFH (Nd, Mn, and Fe), PETH (Cl, S, and P) and LDE1 for F. The detection limits for each element were approximately: 221.13 ppm for Ca, 598.13 ppm for La, 582.00 ppm for Ce, 200.38 ppm for Na, 139.75 ppm for Mg, 196.38 ppm for Si, 334.00 ppm for Sr, 451.50 ppm for Nd, 253.13 ppm for Mn, 271.38 ppm for Fe, 530.25 ppm for F, 76.25 ppm for Cl, 183.00 ppm for S, 213.75 ppm for P, and 384.13 ppm for Y.
The Raman spectra of inclusions within apatite were acquired on sample TS-2 using a Jasco NRS7500 Raman spectrometer at the Gemmological Institute of China University of Geosciences (Wuhan), with the following parameters: 457 nm excitation wavelength, a 12.7 mW laser power, and 1800 grooves/mm grating. The wavenumber was calibrated by testing a silicon single-crystal wafer before conducting all measurements. All spectra were obtained at room temperature.
Back-scattered electron (BSE) imaging and EDS analysis were carried out on a Thermo Fisher Helios G4 double-beam scanning electron microscope (SEM) equipped with Oxford Instruments EDS detector with UltimMax 100 (100 mm2 sensor size) in the State Key Laboratory of Geological Process and Mineral Resources, in China University of Geosciences (Wuhan). The accelerating voltage, working distance and beam current were set to 15 kV, 10 mm and 1.6 nA, respectively. The samples were coated before the analysis to avoid charging in the SEM. EDS analysis were conducted in mapping mode to investigate the two-dimensional distributions of Ca, P, O, Fe, Mg, Al and Ti.
EBSD analysis was carried out on a Zeiss Sigma 300VP SEM equipped with an Oxford Instruments Aztec Symmetry EBSD detector at the SEM-EBSD laboratory, School of Earth Sciences, China University of Geosciences (Wuhan). Working conditions were as follows: 70° sample tilt angle, 20 kV accelerating voltage, 19.5 mm working distance, 120 μm aperture size and low-vacuum mode. The thin sections were uncoated. Since the SEM used a fixed aperture and did not display the beam current, the beam current was ~15 nA. To acquire the whole orientation imaging data for each chosen exposed section of inclusion, the mapping mode was used for the EBSD analysis. Diffraction patterns were collected with the map size of 622×512 pixels and the step size of 0.3–0.5 μm.
The electron back-scatter diffraction patterns (EBSP) of apatite were indexed by using the crystal structure with space group P63/m, a = 9.4052 Å and c = 6.9125 Å (Hughes et al., Reference Hughes, Cameron and Mariano1991). The EBSP of magnetite were indexed by using the crystal structure with space group F  $\bar 3$dm, a = 8.3958 Å (Wechsler et al., Reference Wechsler, Lindsley and Prewitt1984). The Oxford Instruments AztecCrystal software was used for data processing and producing pole figures of indexed crystals. All pole figures are plotted as upper-hemisphere stereographic projections. To ensure data quality, only those measurements with mean angular deviation (MAD) values below 1° were accepted for analysis. Data points mis-orientated by more than 5° were removed based on comparisons with all eight neighbouring measurements. During orientation map reconstruction, non-indexed points were replaced with the most common orientation among their neighbours to minimize artefacts.
Results
The features of apatite host and inclusions
The natural colour of the apatite studied is light greenish-yellow, the translucent and greyish appearance results from the presence of numerous dark inclusions (Fig. 1a). The two apatite samples studied are euhedral crystals that exhibit relatively similar internal features (Fig. 1b). Sample A1 consists of a combination of basal pinacoid, hexagonal prism and hexagonal bipyramid. The fragmentary sample A2 preserves only unbroken hexagonal prism facets and a small hexagonal bipyramid facet. Owing to the moderate Mohs hardness of apatite, the crystal edges were worn to different degrees.
(a) Dark shape-orientated inclusions cross-cut with each other observed through the basal pinacoid of euhedral apatite. (b) Two euhedral apatite samples appear densely striped, due to the presence of evenly distributed, long and straight lath-shaped inclusions.

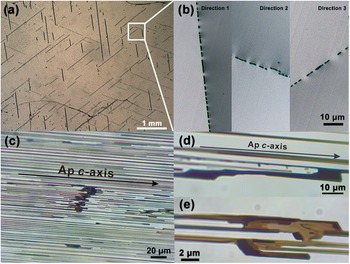
As observed through the basal pinacoid of apatite sample A1, dark inclusion trails are regularly orientated in three directions, parallel to the traces of the hexagonal prism facets of apatite (Fig. 1a). In thin section TS-1, these trails of the inclusions are observed to intersect at angles of 60° and 120° (Fig. 2a). High-magnification optical images reveal that each trail comprises numerous thin, discontinuous lamellae (Fig. 2b), ranging from 5 to several hundred μm in length and 2–10 μm in width. In thin section TS-2, inclusions are observed to be strongly elongated parallel to the c-axis of apatite, indicating well-developed shape-preferred orientation related to the host crystal (Fig. 2c). On the basis of observations from both thin sections, lath-shaped inclusions that form three distinct shape preferred orientations groups. Each SPO group is characterized by elongated directions that are simultaneously parallel to the apatite c-axis and parallel to one of the <11 $\bar 2$0> crystallographic directions. This dual alignment indicates a systematic relationship between inclusion morphology and host crystal lattice geometry.
Photomicrographs of the inclusions under transmitted light. (a) In thin section nearly parallel to the basal pinacoid of apatite A1 (TS-1), inclusion trails show three preferred orientations. (b) Magnification of the white square of (a), showing trail composed of several discontinuous lamellae. (c) Thin section nearly parallel to the hexagonal prism facets of apatite TS-2. The c-axis direction of apatite is marked on (c) (and is the same for parts d and e). (d, e) Magnified observation showing dark inclusions not completely separated. The darkened and smooth edges observed in (d) may indicate that the inclusions were being dissolved.

In addition to the dark lath-shaped inclusions, several other types of inclusions exist within the apatite. Prism-shaped crystal inclusions extending along the c-axis of apatite were observed (Fig. 3a, e). Multiple gas-liquid two-phase inclusions with different sizes extended along the c-axis of apatite are observed, most of them display a necking-down appearance. (Fig. 3b, c). Some faceted crystal inclusions without clear shape-preferred orientation were also found (Fig. 3d).
Typical inclusions observed within thin section sample TS-2. (a) Prism-shaped crystal inclusions are crystallographically aligned to the apatite host. (b) Tubular inclusion composed of gas and liquid phases. (c) Abundant gas–liquid two-phase inclusions elongated along the apatite c-axis, some of them showing distinct necking-down effects. (d) Faceted crystal inclusion. (e) Another prism-shaped crystal inclusions elongated along the c-axis of the apatite host.

Chemical compositions
The major element composition of the apatite is measured along core-to-rim profiles using EPMA (Table 1). These results indicate a homogeneous overall composition of apatite. The main components are CaO (54.83∼55.64 wt.%) and P2O5 (41.37∼42.57 wt.%). The content of F ranges from 1.62 to 2.20 wt.%, consistent with the characteristic F concentrations of igneous apatite (Belousova et al., Reference Belousova, Griffin, O’Reilly and Fisher2002). Using the dominant constituent principle (Pasero et al., Reference Pasero, Kampf, Ferraris, Pekov, Rakovan and White2010), sample A1 contains slightly more F than OH and is therefore best classified as fluorapatite, whereas sample A2 contains slightly more OH than F and corresponds to hydroxylapatite. In this study, the term ‘apatite’ is used to refer collectively to both compositions.
EPMA results for the chemical composition from core to the rim of apatite

Table 1 Long description
Electron microprobe results report apatite chemistry from core to rim for two samples, A1 and A2, with multiple spot analyses per zone. Major components are consistent across all analyses: CaO is about 54.8 to 55.6 weight percent and P2O5 is about 41.4 to 42.6 weight percent, while totals are near 99 to 100 weight percent. Minor oxides are low: SiO2 is about 0.07 to 0.14 weight percent; FeO, MnO, and MgO are each roughly 0.01 to 0.17 weight percent; SrO and Na2O are at or below about 0.11 and 0.09 weight percent, respectively; SO3 is about 0.02 to 0.06 weight percent. Rare earth oxides are small, with Nd2O3, Ce2O3, and La2O3 generally at or below about 0.20 weight percent, and some La2O3 entries reported below detection. Halogens show the clearest variation: fluorine is about 2.07 to 2.20 weight percent in A1 but lower in A2 rims at about 1.53 to 1.80, while chlorine stays near 0.15 to 0.20 weight percent. The calculated atom proportions based on a fixed anion basis mirror the oxide data, with calcium near 9.4 to 9.6 and phosphorus near 2.83 to 2.90, and only small changes from core to rim. Overall, the table indicates chemically uniform apatite with subtle zoning mainly expressed by fluorine and the corresponding hydroxyl component.
b.d.l: below the detection limit.
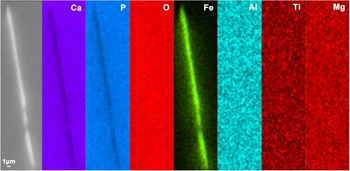
Due to their tiny size, the lath-shaped inclusions cannot be analysed quantitatively by EPMA. However, the element distribution in the apatite host and inclusions can be assessed through SEM-EDS mapping. The exposed inclusion areas are mainly composed of Fe and O, suggesting the inclusions are iron oxides or iron hydroxides (Fig. 4). Additional EDS mapping for Al, Ti, and Mg did not show significant enrichment within the inclusion regions, suggesting that these elements are either absent or below the detection limit in the inclusions.
BSE image and EDS mapping of Ca, P, O, Fe, Al, Ti and Mg of an exposed inclusion area from thin section A1 showing that the inclusion is mainly composed of Fe and O.

Phase identification of inclusions
According to SEM-EDS analysis, the inclusions were identified as iron oxide or iron hydroxides. To further characterize the phase, Raman spectra were obtained from both the host and exposed inclusion regions (Fig. 5). The strongest band at 960 cm–1 corresponds to the ν 1 PO4 stretching mode; the ν 2 PO4 mode appears at 430 and 448 cm–1, and the ν 4 PO4 mode is observed at 579, 589 and 605 cm–1; weak bands at 1037, 1046 and 1074 cm–1 may correspond to the ν 3 PO4 mode or potentially the ν 1 CO3 mode, while the band at 1156 cm–1 is attributed to either the ν 1 CO3 mode or REEs emission within apatite (Antonakos et al., Reference Antonakos, Liarokapis and Leventouri2007).
Raman spectra of host apatite and iron oxide inclusions. The green-line is the standard Raman spectrum of apatite, and the red-line spectrum is the standard Raman spectrum of magnetite from the RRUFF database (R050340 for fluorapatite and R060222 for magnetite, https://rruff.info/).

The Raman spectrum of iron oxide inclusions displays three additional bands at approximately 662, 528 and 304 cm–1, in addition to those observed for the host apatite. These bands are consistent with the characteristic vibrational modes of magnetite, with the band at 662 cm–1 assigned to the A 1g mode of magnetite, and those at 528 cm–1 and 304 cm–1 correspond to the T 2g and Eg modes, respectively (Shebanova and Lazor, Reference Shebanova and Lazor2003). For further identification, these vibration bands were compared with other Fe oxides and hydroxides. Though iron oxides exist stably at room temperature, hematite generally shows strong vibrational modes at about 226, 299, 410 and 611 cm–1, and maghemite exhibits bands around 350, 500, 660 and 700 cm–1 (De Faria et al., Reference De Faria, Venâncio Silva and de Oliveira1997). Iron hydroxides, including goethite and lepidocrocite, show main vibrational bands at 299, 479, 550, and 685 cm–1 for goethite, and 245, 373, 522 and 650 cm–1 for lepidocrocite (De Faria et al., Reference De Faria, Venâncio Silva and de Oliveira1997). None of these phases match the precise positions of the observed inclusion spectra in this research. In addition, EDS mapping of the inclusion exposed region reveals only Fe and O, with no detectable signals for other possible relevant elements, such as Al, Mg and Ti, which effectively rules out Fe-Al spinels or Fe-Ti oxides (Fig. 4).
Inclusions other than iron oxides are also identified by Raman spectroscopy. The gaseous phase exhibits characteristic CO2 vibration modes at 1286 and 1388 cm–1, along with the N2 vibration mode at 2329 cm–1 (Fig. 6a). Compared to the apatite host, the liquid inclusions have Raman bands associated with carbonate (Fig. 6a), with bands observed at 1042, 684 and 145 cm–1, assigned to the ν 1, ν 4 and the translational mode of the carbonate ion, respectively; additional bands at 1435 and 1458 cm–1 are attributed to the carbonate ν 3 mode, and the 1622 cm–1 band might be related to the carbonate ion within the apatite channel site (Antonakos et al., Reference Antonakos, Liarokapis and Leventouri2007; Buzgar and Apopei, Reference Buzgar and Apopei2009; Murphy et al., Reference Murphy, Jakubek, Steele, Fries and Glamoclija2021). Raman spectra of the prism-like inclusions (as seen in Fig. 3e) show a carbonate vibration mode, which identified the inclusion as calcite (Fig. 6b).
Raman spectra of (a) gas-liquid two-phase inclusions and (b) prismatic inclusions in apatite. The standard Raman spectrum of calcite is from the RRUFF database (R050307, https://rruff.info/).

Crystallographic and shape orientation relationships
The crystallographic orientation relationship between the host apatite and magnetite inclusions was determined by EBSD analysis, conducted on the exposed areas of inclusion within thin section samples. To improve accuracy, multiple single cross-sectional areas in three different trace directions in the thin section TS-1 were selected for EBSD measurement. Figure 7 presents BSE imaging of thin section A1, showing cross-sections of inclusions in three different shape-preferred orientations, along with EBSP of both apatite and inclusions (Fig. 7). Since similar EBSD pole figures were obtained from samples TS-1 and TS-2, only data from sample TS-1 are presented here to represent the COR and SOR (as Fig. 8).
(a) BSE image of sample TS-1, showing the apatite host and magnetite inclusions in directions 1 and 2. The smaller figure on the right is the Kikuchi pattern of apatite. (b) Magnetite inclusions in direction 3 on the same thin section. The smaller figure on the right is the Kikuchi pattern of magnetite. All descriptions of magnetite directions correspond to those shown in Fig. 2b.

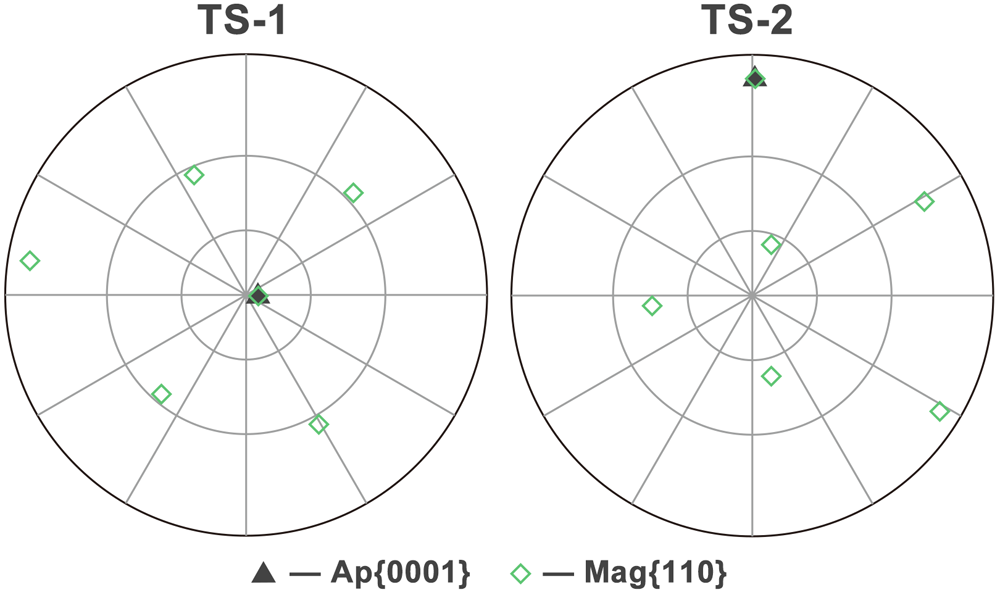
The pole figures of TS-1 and TS-2, including apatite {0001} and magnetite {110}, indicate that the magnetite inclusions and apatite host have consistent axial relationships in two different samples.

Optical microscopy and pole figures demonstrate the SPO of elongated inclusions aligned parallel to <11 $\bar 2$0> directions of apatite host (Fig. 9). The crystallographic orientations of apatite and magnetite inclusions were analysed by using EBSD and plotted as pole figures (Fig. 9a, 9b). In the pole figure of apatite (Fig. 9a), three low-index planes {0001}, {10
 $\bar 1$0}, and {11
 $\bar 2$0} are projected, showing a consistent host orientation across all mapped areas. Regarding the projection poles of magnetite, we found that the crystallographic orientation of inclusions with the same elongation direction was generally consistent. Inclusions are divided into three SPO directions based on their elongation orientations in TS-1. All magnetite inclusions, regardless of SPO direction, display a common axial orientation relationship of <0001>Ap//<110>Mag, as evidenced by the overlap of apatite {0001} and magnetite {110} pole. In addition to the axial relationship <0001>Ap//<110>Mag, distinct planar orientation relationships are observed, which defined two specific CORs. COR-1: one of the {11
 $\bar 2$0}Ap planes is parallel to one of the {411}Mag planes, and one of the {10
 $\bar 1$0}Ap planes is parallel to one of the {211}Mag planes. COR-2: one of the {11
 $\bar 2$0}Ap planes is parallel to one of the {211}Mag planes, and one of the {10
 $\bar 1$0}Ap planes is parallel to one of the {411}Mag planes. Direction 3 shows the same set of relationship with direction 1, but as a symmetrically equivalent variant, representing the second variant of COR-1 (Fig. 9b). The inverse pole figure (IPF) colour maps show that all inclusions share the same colour in the Z0 direction (parallel to the apatite c-axis), while in-plane orientations vary between the three directions (Fig. 9c). Direction 1 shows a different IPF colour compared with Directions 2 and 3, which exhibit similar colours, indicating similar crystallographic orientations within their respective inclusion groups. For magnetite inclusions in three directions, the poles of directions 2 and 3 have similar but not identical positions (misorientation ca. 5 degrees about the shared <0001>Ap//<110>Mag axis pair), while the poles of direction 1 are rotated ~60 degrees clockwise about the shared <0001>Ap//<110>Mag axis pair relative to the other two directions (Fig. 9b).
Shape and crystallographic orientation relationships between magnetite inclusions and apatite host. (a) Pole figure of host apatite, showing the three low-index planes {0001}, {10 $\bar 1$0}, and {11
 $\bar 2$0}. (b) Pole figures of magnetite inclusions in three directions. The index symbols are marked to indicate the main crystallographic orientations of the two phases. The black lines represent the extension of the inclusions in each direction. (c) Optical microphotographs and IPF colours of chosen magnetite inclusions in three directions in the thin section TS-1. The IPFs do not represent the actual sizes of the cross section of inclusions. All directional descriptions of magnetite correspond to those shown in Fig. 2b and Fig. 7.

Discussion and Conclusions
SOR and COR between magnetite and apatite
The formation mechanism of shape-preferred mineral inclusions has received extensive attention, and numerous models have been proposed to explain their genesis. To date several studies have provided the following hypotheses (Proyer et al., Reference Proyer, Habler, Abart, Wirth, Krenn and Hoinkes2013; Axler and Ague, Reference Axler and Ague2015b; Keller and Ague, Reference Keller and Ague2019): (1) overgrowth of pre-crystallized, preferentially orientated minerals that are trapped by later-grown minerals (Spiess et al., Reference Spiess, Groppo and Compagnoni2007); (2) heterogeneous nucleation and co-growth of host and inclusion phases (Hwang et al., Reference Hwang, Shen, Chu, Yui and Iizuka2015; Palke and Breeding, Reference Palke and Breeding2017; Griffiths et al., Reference Griffiths, Habler and Abart2020; Kohn et al., Reference Kohn, Griffiths, Alifirova, Daneu, Ageeva, Abart and Habler2024); (3) exsolution (Axler and Ague, Reference Axler and Ague2015a; Keller and Ague, Reference Keller and Ague2022); (4) open-system precipitation (OSP) (Proyer et al., Reference Proyer, Krenn and Hoinkes2009; Proyer et al., Reference Proyer, Habler, Abart, Wirth, Krenn and Hoinkes2013); (5) inclusions crystallized along cleavage planes or fractures within the host crystal (Hwang et al., Reference Hwang, Shen, Yui and Chu2007a; Hwang et al., Reference Hwang, Yui, Chu, Shen, Schertl, Zhang and Liou2007b; Hwang et al., Reference Hwang, Shen, Chu, Yui and Iizuka2013); (6) fluid-assisted dissolution-reprecipitation (Harlov et al., Reference Harlov, Andersson, Förster, Nyström, Dulski and Broman2002; Harlov et al., Reference Harlov, Wirth and Förster2005; Harlov, Reference Harlov2011; Hwang et al., Reference Hwang, Shen, Chu, Yui, Iizuka and Schertl2019); (7) recrystallization of pre-existing inclusions (Ageeva et al., Reference Ageeva, Habler, Topa, Waitz, Li, Pertsev, Griffiths, Zhilicheva and Abart2016; Bian et al., Reference Bian, Ageeva, Roddatis, Habler, Schreiber and Abart2023), etc. However, it is worth noting that in natural geological environments, multiple mechanisms may operate simultaneously during inclusion formation.
When CORs and SORs are observed, they can help to constrain the possible formation processes, although not every mechanism can produce them. CORs are generated from interactions between host and inclusion lattices, reflecting the formation of low energy interfaces, typically resulting in correlations between specific crystallographic directions or planes (Habler and Griffiths, Reference Habler, Griffiths, Heinrich and Abart2017; Griffiths et al., Reference Griffiths, Habler and Abart2020). The nucleation mode of inclusions determines the nature of lattice matching mode between neighbouring phases. In three-dimensional lattice matching mode, inclusions nucleate under complete crystallographic control by the host, rather than being confined to a pre-existing interface, and the resulting CORs and SORs are expected to be determined by the alignment of multiple (typically low-index) planes in both phases at interfaces, to minimize the total lattice strain and interfacial energy of the inclusions. In this process, there is no reason to prefer any single symmetrical equivalent variant of a given COR or SOR, so all symmetric equivalents are expected to be equally frequently represented. One representative process is exsolution, in which a supersaturated host undergoes phase separation under sub-solidus conditions due to temperature or pressure changes, without introducing or removing chemical components. For instance, trigonal ilmenite (Ilm) is commonly exsolved from magnetite, and their combination is based on close-packed oxygen atoms, characterized by CORs featuring <110>Mag//<10 $\bar 1$0>Ilm and (111)Mag//(0001) Ilm (Tan et al., Reference Tan, He, Wang, Dong, Liang and Zhu2016).
By contrast, in a two-dimensional lattice matching mode, nucleation occurs on a pre-existing fixed substrate, such as a specific host facet during heterogeneous nucleation. In this scenario, the growth orientation of the new phase is constrained by the surface structure of the substrate, making the resulting SORs and CORs directly dependent on its crystallography (Griffiths et al., Reference Griffiths, Habler and Abart2020). Because energy minimization is confined to this single interface, the overall symmetry of the host-inclusion system is broken. This creates the potential for the selection of specific, symmetrically equivalent variants of a given COR and/or SOR (Kohn et al., Reference Kohn, Griffiths, Alifirova, Daneu, Ageeva, Abart and Habler2024). In these cases of nucleation on a substrate, SPO may develop either simultaneously with host growth or due to post-crystallization re-equilibration of inclusion shape. For instance, Kohn et al. (Reference Kohn, Griffiths, Alifirova, Daneu, Ageeva, Abart and Habler2024) report a rare SPO pattern in rutile needles within meta-pegmatitic garnet from the Bohemian Massif, attributed to nucleation on the garnet {112} facets. Rutile needles with an SPO following the specific <111> garnet direction lying in the {112} growth facet plane are absent, emphasizing the role of substrate orientation in defining SORs and CORs. In addition, as demonstrated by Hwang et al. (Reference Hwang, Shen, Chu, Yui and Iizuka2013), even regularly orientated inclusions with apparent SPO and CORs may form through interface-controlled or metasomatic processes such as cleavage-controlled precipitation, rather than being directly inherited from co-crystallization with the host (Hwang et al., Reference Hwang, Shen, Chu, Yui and Iizuka2013). In the present study, lamellar magnetite inclusions within apatite are observed to occur in trails parallel to (10 $\bar 1$0) facets of apatite and exhibit a consistent set of three SPOs, each being aligned parallel to the <0001> axis of apatite and elongated along one of the three <11
 $\bar 2$0> directions of apatite, specifically the one (sub)parallel to the elongation direction of the inclusion trail. This structural configuration already suggests that magnetite nucleation was governed by an interface-controlled mechanism, where inclusion growth was influenced by the crystallographic orientation of the host substrate, rather than by a fully three-dimensional lattice match, otherwise all three SPOs might be expected to occur simultaneously in one trail. However, COR information is required to completely rule out exsolution, as the minor possibility remains that all inclusions in each trail are interconnected (although it should be noted that exsolution does not usually form ‘skeletal’ lamellae).
For host-inclusion phases belonging to different crystal systems with disparate lattice parameters, such as apatite and magnetite, growth may proceed along a pair of partially fitting directions to minimize interfacial energy, even when ideal lattice matching cannot be achieved. According to the pole figures (Fig. 9b), a fundamental alignment may be established that allows magnetite to nucleate stably on the apatite substrate in the initial stage of nucleation. Pole figure analysis also indicates that one of the magnetite close-packed planes {111} is sub-parallel to one of the principal prism planes of apatite, suggesting these close-packed planes provide a reference framework for the primary alignment. A subsequent, secondary stage of rotational adjustment can refine this relationship to reduce lattice misfit, producing the specific CORs observed. The form of that refinement depends on the SPO: in directions 1 and 3, the initial alignment is a {111}Mag sub-parallel to a {10 $\bar 1$0}Ap and evolves into COR-1 (with variants), whereas in direction 2, the alignment of {111}Mag sub-parallel to a {11
 $\bar 2$0}Ap leads to COR-2. In a fully 3D volume-controlled nucleation, symmetrically equivalent COR variants would be expected to appear with similar frequencies, as orientation would be constrained by minimizing energy across all interfaces bounding the inclusion. However, in our samples, SPO in direction 1 and 3 consistently yield two symmetrically related variants of COR-1, whereas direction 2 exhibits a distinct and unrelated COR-2. This SPO-dependent selection of CORs is difficult to reconcile with a simple 3D volume-controlled nucleation model and instead indicates variant selection by 2D interface-control.
Another noteworthy observation concerns the relationship between the CORs and the actual phase-boundary traces. The planar CORs we identify involve relatively high-index magnetite planes {411} and {211}, paired with low-index prism planes of apatite. Inspection of inclusion cross-section traces (Fig. 7b) shows subtle deviations from exact parallelism with low-index host planes, consistent with the presence of apparently ‘irrational’ interface planes that achieve the interfacial energy minimization. The study by Fleet et al. on orientated magnetite in pyroxene provides a classic model (Fleet et al., Reference Fleet, Bilcox and Barnett1980), which demonstrated that while the COR is rational, the inclusion boundaries themselves are seemingly irrational orientations to form an optimal phase boundary that minimizes lattice strain. While such interfaces are clear evidence of energy minimization, they can arise by various mechanisms, including both 2D interface-controlled and 3D volume-controlled nucleation modes (Peres et al., Reference Peres, Griffiths, Colle, Iannini Lelarge, Masotta, Pontesilli, Mancini and Abart2024). The critical evidence for interface-control in our samples comes from the patterned selection of COR variants according to SPO, together with the axial alignment and the observed boundary-trace mismatches. These features indicate that the system minimized energy at specific nucleation interfaces in a manner controlled by the local substrate geometry. Such a pattern is not expected for a 3D volume-controlled mechanism, which would impose a single averaged COR. On this basis, we infer that the magnetite inclusions formed predominantly through 2D interface-controlled nucleation on specific apatite substrate facets, while acknowledging that mixed or alternative mechanisms cannot be entirely excluded.
Formation of magnetite inclusions in apatite
Magnetite micro-inclusions exhibiting SPO are commonly observed in plagioclase and clinopyroxene, as described in several studies (Fleet et al., Reference Fleet, Bilcox and Barnett1980; Feinberg et al., Reference Feinberg, Wenk, Renne and Scott2004; Wenk et al., Reference Wenk, Chen and Smith2011; Ageeva et al., Reference Ageeva, Habler, Topa, Waitz, Li, Pertsev, Griffiths, Zhilicheva and Abart2016; Ageeva et al., Reference Ageeva, Habler, Gilder, Schuster, Pertsev, Pilipenko, Bian and Abart2022; Jin et al., Reference Jin, Sun and Palke2022; Bian et al., Reference Bian, Ageeva, Roddatis, Habler, Schreiber and Abart2023). The genesis of these inclusions is complex; multiple generations can coexist within a single host crystal, ranging from needle-like inclusions formed by early-stage exsolution to lath-shaped or discontinuous inclusions resulting from coarsening and dissolution during late-stage hydrothermal processes (Ageeva et al., Reference Ageeva, Habler, Topa, Waitz, Li, Pertsev, Griffiths, Zhilicheva and Abart2016; Ageeva et al., Reference Ageeva, Habler, Pertsev and Abart2017; Bian et al., Reference Bian, Ageeva, Roddatis, Habler, Schreiber and Abart2023). In most mechanisms, the constituent elements of the inclusions are derived from the host mineral itself, such as through exsolution and OSP, including the needle-shaped magnetite inclusions with specific CORs in plagioclase or clinopyroxene mentioned above. However, in this present study, Fe is less likely to be stored in the apatite host before the formation of magnetite inclusions. The cation sites in apatite have a low capacity to accommodate Fe ions and only a small amount can substitute for calcium ions (Pan and Fleet, Reference Pan and Fleet2002). According to EPMA data, the range of FeO is 0.07∼0.17%, indicating a low Fe content in the apatite structure. The observed SPO and CORs of the host-inclusion system also suggest that Fe is not exsolved from the apatite lattice. In contrast, these observations suggest that the Fe was introduced from an external source, either during the crystallization of apatite from melt or fluid, or possibly through fluid infiltration after the apatite had formed.
When excluding the possibility of Fe exsolved from the apatite lattice, we propose an alternative mechanism in which Fe diffuses into the apatite structure and subsequently nucleate into magnetite at favourable sites. The apatite crystal structure presents nano-channels parallel to the c-axis, typically occupied by F⁻, Cl⁻, or OH⁻ anions, which may facilitate such diffusion pathways. Meanwhile, anions with different valence states, certain transition metal ions, and vacancies can exist in the channel as additional substituents (Pan and Fleet, Reference Pan and Fleet2002). With the assistance of aqueous fluid with a certain salinity, cations can diffuse into apatite through these nano-channels, which provide sites for nucleation and growth (Harlov et al., Reference Harlov, Wirth and Förster2005). This mechanism allows a significant amount of Fe to diffuse into the host.
A similar mechanism has been proposed for the formation of orientated magnetite inclusions in plagioclase. The Si-Al-O tetrahedral framework of plagioclase forms channels parallel to [001], which are thought to accommodate the diffusion of Fe-bearing species. Within these structural pathways, iron may be incorporated and subsequently form FeO₆ octahedra (Wenk et al., Reference Wenk, Chen and Smith2011; Ageeva et al., Reference Ageeva, Bian, Habler, Pertsev and Abart2020). Orientated pyrrhotite and triphylite in apatite have been attributed to this mechanism (Broska et al., Reference Broska, Krogh Ravna, Vojtko, Janák, Konečný, Pentrák, Bačík, Luptáková and Kullerud2014; Kurylo et al., Reference Kurylo, Broska and Reto2025). In a laboratory setting, Fe-containing apatite-type solid solutions have been synthesized by diffusing Fe into the channel sites of apatite (Kato et al., Reference Kato, Ikeda, Saito and Ogasawara2018). However, inclusions in the above cases are only elongated along the c-axis of apatite and do not exhibit any SPO parallel to <11 $\bar 2$0> directions. Therefore, other possible situations should be considered as well.
Apatite is commonly dissolved by fluids in the natural environment, with dissolution surfaces controlled by the crystallographic structure of apatite itself, resulting in the formation of etch pits on external crystal facets. Generally, hexagonal etch pits with (10 $\bar 1$0) walls can be observed on the basal pinacoid of apatite (Fig. 10) (Rakovan, Reference Rakovan2002). In acid solutions (especially at pH<3), hexagonal etch pits also form linear etch grooves extending along the <11
 $\bar 2$0> directions of apatite, suggesting that this is a weakly bonded orientation in the apatite crystal structure (Rakovan and Reeder, Reference Rakovan and Reeder1994; Tseng et al., Reference Tseng, Lin, Shen and Shen2006). Thirioux et al. observed that, in an acid environment, apatite also presents trapezoidal etch pits on (10
 $\bar 1$0), which anisotropically expand along <0001> as dissolution continues, to form etch grooves (Fig. 10a) (Thirioux et al., Reference Thirioux, Baillif, Touray and Ildefonse1990). In addition, hillocks can be observed on the (0001) basal pinacoid of natural apatite and growth spirals are frequently observed on (10
 $\bar 1$0) prism facets (Thirioux et al., Reference Thirioux, Baillif, Touray and Ildefonse1990). These features, developing on crystal structure defects such as dislocations, can serve as seeds for crystal growth and promote growth on smooth interfaces (Amelinckx, Reference Amelinckx1952; Rakovan, Reference Rakovan2002). Free elements can also be preferentially adsorbed at crystal defects such as dislocations or surface microstructures generated by dissolution and may subsequently diffuse to energetically favourable sites for nucleation.
(a) Typical dissolution features on crystal facets of apatite. After Thirioux et al. (Reference Thirioux, Baillif, Touray and Ildefonse1990). (b) Continuous etching pits observed on the basal pinacoid of euhedral sample A1. (c) Further magnified observation shows the hexagonal shape of a single pit, and the sides of the hexagon are parallel to the {10 $\bar 1$0} prism facets of apatite. The etching pits are arranged continuously along the <11
 $\bar 2$0> directions of apatite.

On the basal pinacoid of the euhedral sample A1 in this study, abundant hexagonal etch pits were observed, with some larger pits aligned along the <11 $\bar 2$0> direction of apatite (Fig. 10b and 10c). These etch pits exhibit the same orientation as the magnetite inclusion trails observed in thin section TS-1, which was cut parallel to the basal pinacoid. The spatial correspondence suggests that the formation of magnetite inclusions may be linked to the hexagonal etch pits. Based on the crystal structure of apatite and optical microscopy observations, we propose that Fe-bearing fluids entered the crystal through etch pits, where they interacted with channels extending along the [0001] direction on {10
 $\bar 1$0} facets. These structural features may serve as preferential nucleation sites, promoting interface-controlled nucleation of magnetite inclusions with a shape-preferred orientation aligned with [0001] of apatite. Correspondingly, the inclusions exhibit trapezoidal shapes parallel to (10
 $\bar 1$0), matching the geometry of etch pits observed on this facet (Fig. 2e). The alignment of inclusion trails along <11
 $\bar 2$0> suggests it is one of the preferred directions for dissolution, potentially facilitated by the acidity of the fluid. In addition, the basal pinacoid facets may also act as initiation sites, generating dissolution channels elongated parallel to <0001> of apatite at the same time. While the inclusions appear discontinuous in cross-section, EBSD mapping shows that inclusions within a single trail consistently share the same crystallographic orientation, indicating that they are either structurally connected or derived from a common orientation variant, established through interfacial crystallographic control during nucleation. One possibility is that inclusions nucleated independently at different points along each channel but adopted a uniform orientation due to strong crystallographic control at the interface. In this case, the discontinuous appearance of magnetite in section TS-1 could reflect the initial presence of small, isolated inclusions nucleated within discrete etch pits. As the solution front advanced and the affected zone widened, these inclusions may have coarsened and become structurally connected, as suggested by observations in Fig. 2c and 2e. Alternatively, they may represent a single, continuous lamella that grew progressively during apatite dissolution. Or, these discrete inclusions may have been formed by fluid erosion of a thin sheet, but because they were originally a single entity, the elongated inclusions retain a consistent crystal orientation.
In the natural environment, apatite is distributed widely and generally undergoes a complex history of hydrothermal overprint and metasomatic alteration. The abundant gas-liquid inclusions in the analysed samples indicate a history of fluid infiltration, while the coexistence of CO2 and N2 in the gaseous phase, along with carbonate ions in the liquid phase, suggests the involvement of volatile-rich, mildly acidic fluids. A lot of them also display a necking-down appearance, implying the host apatite crystal had gone through a dissolution-recrystallization process. Under extensive metasomatic alteration, compositional zoning is commonly observed in apatite, as shown in natural and experimental cases involving orientated monazite inclusions that withdraw REEs from the apatite lattice (Harlov et al., Reference Harlov, Wirth and Förster2005). In F-Cl-SO2-P-rich fluids, P and REEs tend to be leached from apatite (Harlov et al., Reference Harlov, Andersson, Förster, Nyström, Dulski and Broman2002), whereas in CO2-K-Cl-rich fluids, the mobility of these elements is significantly reduced (Bonyadi et al., Reference Bonyadi, Davidson, Mehrabi, Meffre and Ghazban2011). In our apatite samples, however, EPMA data reveals a relatively homogeneous chemical composition, and BSE imaging shows no contrast differences around magnetite inclusions, indicating an absence of compositional zoning. Therefore, the altering fluid is inferred to correspond to the characteristics of a Fe-CO2-rich aqueous fluid, with no clear evidence for the presence of other significant elemental components.
Previous studies on carbonatite-related apatite have documented orientated Fe-rich inclusions, primarily pyrrhotite, indicating a carbonate-sulfate-dominated fluid environment (Broska et al., Reference Broska, Krogh Ravna, Vojtko, Janák, Konečný, Pentrák, Bačík, Luptáková and Kullerud2014; Hurai et al., Reference Hurai, Paquette, Huraiová, Slobodník, Hvožďara, Siegfried, Gajdošová and Milovská2017). In contrast, the Fe-related inclusions in our samples are exclusively oxides, and the sulfur content in the host apatite is limited. This implies low sulfur activity in the fluid system, potentially distinguishing these apatites from typical carbonatite-associated deposits.
In conclusion, this study provides new insights on the chemical composition and the inclusion phase content within the studied apatite, as well as the CORs between host apatite and magnetite inclusions. However, several questions remain unresolved. As the samples are found from a secondary deposit, and both apatite and magnetite can crystallize over a broad temperature range, it is difficult to constrain the origin of Fe on the basis of its original geological context. Apatite samples with surrounding minerals are needed for further analysis.
Acknowledgements
We would like to thank Gerlinde Habler, Thomas Griffiths and two anonymous reviewers for their constructive and helpful comments, which significantly improved this paper.
Funding statement
This research was fully funded by the Natural Science Foundation of Hubei Province 2024AFD390 and Young Scientists Fund of the National Natural Science Foundation of China, No. 41802042. Experimental Technology Research Program of China University of Geosciences (Wuhan) (No. SJ - 202501)
Competing interests
The authors declare that they have no known competing financial interests or personal relationships that could have appeared to influence the work reported in this paper.