Introduction
Domestic goats (Capra hircus) are important and adaptable domesticated animals. They are found in all types of environments and in the whole range of production systems (Peacock, Reference Peacock2005; Tibbo, Philipsson and Ayalew, Reference Tibbo, Philipsson and Ayalew2006; Devendra, Reference Devendra2007; Madsen, Nielsen and Henriksen, Reference Madsen, Nielsen and Henriksen2007; Abdul-Aziz, Reference Abdul-Aziz2010). Goat production over the years is one of the major means of improving the livelihoods of poor livestock keepers, reducing poverty and attaining sustainable agriculture and universal food security due to their nature to produce in harsh climates with low quality roughages (Peacock, Reference Peacock2005; Madsen, Nielsen and Henriksen, Reference Madsen, Nielsen and Henriksen2007; Abdul-Aziz, Reference Abdul-Aziz2010).
Goat genetic resources play an important socio-economic role in many rural parts of the world (Ogola and Kosgey, Reference Ogola and Kosgey2012). The increasing frequency of droughts, together with long-term environmental degradation, is causing many pastoralists to move away from keeping cattle to keeping goats. There is a marked trend towards keeping more small ruminants as a proportion of livestock holdings than large ruminants (Peacock, Reference Peacock2005). However, goats are an under-used and poorly understood resource as compared to cattle and sheep (Banerjee, Animut and Ermias, Reference Banerjee, Animut, Ermias, Merkel, Abebe and Goetsch2000; Abdul-Aziz, Reference Abdul-Aziz2010). Moreover, little attention has been paid to their development in Ethiopia (FARM Africa, 1996; IBC, 2004; Umeta et al., Reference Umeta, Hundesa, Duguma and Muleta2011).
Goats are among the most important livestock species in Ethiopia. The population of goats in the country is estimated to be 22.78 million (CSA, 2011). Based on physical characteristics, four families and 13 breeds of goats have been identified in Ethiopia (FARM Africa, 1996; DAGRIS, Reference Kemp, Mamo, Asrat and Dessie2007). While, using microsatellite markers the goat populations showed only eight distinctively different types (Tucho, Reference Tucho2004). These wide range of breeds that have evolved in various environments represent unique sets of genetic resources.
Bench Maji zone of south western Ethiopia is known for the inhabiting diversified ethnic groups, varying agro climatic conditions, different production systems and a variety of livestock genetic resources. However, little was known regarding the phenotypic variability of goat genetic resources in the area. Therefore, the study was undertaken to identify and characterize the phenotype of indigenous goat genetic resources.
Materials and methods
Description of the study area
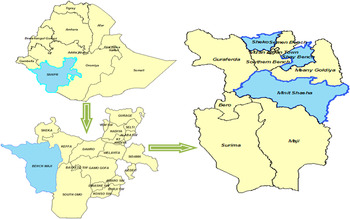
The study area was Bench Maji Zone of south western Ethiopia found at 34°45′ to 36°10′E longitude and 5°40′ to 7°40′N latitude. The altitude ranges from 500 to 3 000 m above sea level. The annual average temperature ranges from 15.1 to 27.5 °C, while the annual rainfall ranges from 400 to 2 000 mm (BMZFED, 2012). The study area consisted of three districts namely Sheko, Shei Bench and Meanit Shasha as shown in Figure 1. About 67 percent of the land area of Sheko and 80 percent of Meanit Shasha are lowland while 99 percent of Shey Bench is mid altitude. Mixed agriculture is the type of production system in Sheko and Shey Bench districts while pastoralism is common in Meanit Shasha.
Map of the study area

Data collection
The study was conducted from December 2011 to August, 2012. Focus group discussions with key informants and elders constituting 7–12 members were held along with a developmental agent per peasant association. To identify the history of development of the goat population and any possible classification of the existing population, breed names, origins of breeds, qualities of breed and peculiar characteristics of the breed, past and present utility pattern of the breed, and its current status and major constraints to the maintenance of the breed have been assessed.
The number of goats sampled for phenotypic characterization was 631, of which 442 were female and 189 were male. District-wise 216, 211 and 204 goats were sampled form Sheko, Meanit Shasha and Shay Bench. Qualitative traits for physical description of the population were taken including the presence or absence of beard, ruff, wattles and horn, facial (head) profile, coat colour type and pattern, hair coat type, ear orientation, horn shape and orientation. Linear body measurements including body length, heart girth, pelvic width, ear length and horn length were taken using measuring tape while wither height was measured using a 1 m ruler. Body weight (kg) was taken through weighing in a spring balance (100 kg capacity and 500 gm graduation). The linear body measurements and the qualitative traits collected were adapted from goat breed descriptor lists of FARM Africa (1996) and FAO (2011).
Data analysis
The qualitative and quantitative traits were coded and entered into a computer using Microsoft Office Excel 2007. Prior to data analysis for the quantitative traits normality of data was tested using SAS (SAS 9.0, 2002). Descriptive statistics and chi-square tests were employed to analyse the qualitative data. In addition, multiple mean comparisons were made for qualitative variables using Bonferroni's correction using Statistical Analysis System (SAS 9.0, 2002).
Quantitative traits for body measurements were analysed using the general linear model (GLM) procedures of the Statistical Analysis System (SAS 9.0, 2002). The model was fitted to main effects of district and age on body weight and linear body measurements for male and female separately. Least square means were separated using Tukey-Kramers. The model for both sex to analyse body weight and other linear body measurements are presented below. Besides, two-step cluster analysis was used to analyse the quantitative data of both sexes using SPSS (SPSS V.17.0, 2008).
 $$Y_{ijk}=\mu+a_i+b_j+e_{ijk}.$$
Where: Y ijk = the recorded k (body weight and linear body measurements) in the ith district and jth age group; μ = overall mean; a i = the effect of ith district (i = 1, 2 and 3; 1 = Sheko, 2 = Meanit Shasha and 3 = Shay Bench); b j = the effect of jth age group (j = 1, 2, 3 and 4; 1 = 1PPI (1 Pairs of Permanent Incisors), 2 = 2PPI (2 Pairs of Permanent Incisors), 3 = 3PPI (3 Pairs of Permanent Incisors), 4 = 4PPI (4 Pairs of Permanent Incisors); e ijk = random residual error.
Results
Characterization of qualitative variation
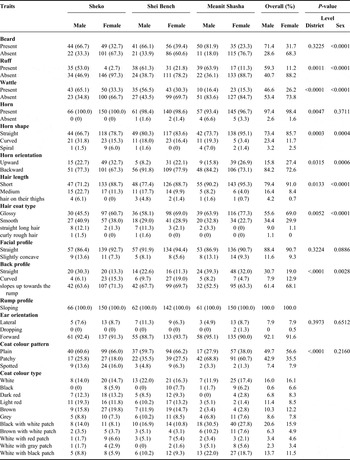
The distribution of the various qualitative traits in the sampled goat population is presented in Table 1. Majority of females have straight (90.7 percent) facial profile. Horns were found in 98.4 percent of the goats. In most cases (85.7 percent) horns were straight with backward direction in 72.6 percent of the goats. Ruffs, wattles and beards were absent in 88.2, 73.8 and 68.3 percent of the female goats. Majority of them have the ear oriented forward (91.6 percent). The coat colour pattern was a plain coat colour in 56.6 percent of the goats, with 35.5 percent patchy and 7.9 percent spotted. The coat colour was 16.1 percent white, 12.2 percent brown, 8.5 percent light red, 15.9 percent black with white, 11.5 percent white with black and 35.6 percent other colours.
Summary of the qualitative traits. Absolute and relative frequency of trait category by breed and sex.

On the other hand, majority of males (88.4 percent) have a straight facial profile. Horns were found on 97.4 percent and the remainders (2.6 percent) were polled. Horns were straight (73.4 percent), which were directed backwards (84.2 percent). Ruffs were present on 59.3 percent, wattles on 46.6 percent and beards on 71.4 percent of males. Majority of them have ear oriented forward (92.1 percent). They have a plain coat colour 49.7 percent, with 42.9 percent patchy and 7.4 percent spotted. The dominant coat colour types were 16.0 percent white, 11.4 percent light red, 10.3 percent, brown, 20.6 percent black with white and 13.7 percent white with black.
The chi-square test showed that ruff, wattles, horn shape, coat colour pattern and back profile were highly significantly different (P < 0.01) across districts while horn orientation was also significant (P < 0.05) difference. There were no significant differences across districts in head profile and beards. On the other hand, sex showed highly significant (P < 0.01) differences in presence of beard, ruff and wattle, horn shape, hair length and back profile. Coat colour pattern variations were not significantly different between males and females.
Characterization of quantitative variation
Live body weight and linear measurements
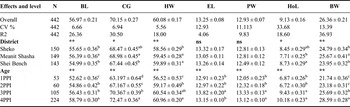
Site effect: The least squares means and standard errors of body weight and other body measurements for female and male goats in the various districts and age groups are presented in Tables 2 and 3, respectively. In female goats, site had significantly larger (P < 0.01) influence on body length, height at wither and body weight while chest girth and horn length were found to be significantly (P < 0.05) influenced by site. No significant (P > 0.05) differences were observed across site for pelvic width and ear length.
Least square means (LSM) and standard error ( ± SE) of body weight (kg) and linear body measurements (cm) for effects of district and age of female goats.

a,b,cmeans on the same column with different superscripts within the specified district and dentition group are significantly different (P < 0.05); ns = Non significant (P > 0.05); *P < 0.05; **P < 0.01; BL = Body Length; CG = Chest Girth; HW = Height at Wither; EL = Ear Length; PW = Pelvic Width; HoL = Horn Length; BW = Body weight; 1PPI = 1 Pair of Permanent Incisors; 2 PPI = 2Pairs of Permanent Incisors; 3PPI = 3Pairs of Permanent Incisors; 4PPI = 4Pairs of Permanent Incisors.
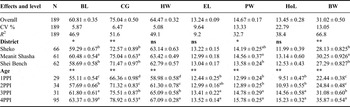
Least square means (LSM) and standard error (±SE) of body weight (kg) and linear body measurements (cm) for effects of district and age of male goats.

a,b,c,dmeans on the same column with different superscripts within the specified district and dentition group are significantly different (P < 0.05); ns = Non significant (P > 0.05); *P < 0.05; **P < 0.01; BL = Body Length; CG = Chest Girth; HW = Height at Wither; EL = Ear Length; PW = Pelvic Width; HoL = Horn Length; BW = Body weight; 1PPI = 1 Pair of Permanent Incisors; 2 PPI = 2Pairs of Permanent Incisors; 3PPI = 3Pairs of Permanent Incisors; 4PPI = 4Pairs of Permanent Incisors.
In male goats, site had a significantly larger (P < 0.01) influence on chest girth and body weight while body length and pelvic width were found significantly (P < 0.05) influenced by site. Height at withers, ear length and horn length were not significantly (P > 0.05) influenced by site.
Age effect: Live body weight and the other body measurements were significantly (P < 0.01) affected by age group in female goats as indicated in Table 2. In female goats at dentition four (4 Pairs of permanent incisors), body length, chest girth and body weight had significantly higher (P < 0.01) values from the preceding age groups and this may imply body length, chest girth and body weight reached maximum at oldest age group. In contrast, the younger female goats (1 pairs of permanent incisors), body length, chest girth, pelvic width, horn length and body weight had significantly lower (P < 0.01) values than the elder age groups except pelvic width, horn length and body weight which were found to be the same with the values at 2 pairs of permanent incisors age groups. Moreover, pelvic width and horn length at 3pairs of permanent incisors had larger (P < 0.01) values than the youngest age groups (1 pairs of permanent incisors and 2 pairs of permanent incisors) but the values were also the same with the oldest age group (4 pairs of permanent incisors) implied that these measurements attain their maximum at 3 pairs of permanent incisors age group. On the contrary, height at withers had significantly lower (P < 0.01) values at 1 pairs of permanent incisors but the difference in values of this parameter were non-significant for 2 pairs of permanent incisors and 3 pairs of permanent incisors, and 3 pairs of permanent incisors and 4 pairs of permanent incisors age groups. Similarly, as age advanced, the influence on the difference in ear length between consecutive age groups was diminishing.
In males, live body weight and all other body measurements were significantly (P < 0.01) influenced by age as presented in Table 3. At dentition group four (4 pairs of permanent incisors), chest girth, height at withers and body weight had significantly higher (P < 0.01) values than in the preceding age groups. The nature of difference in the other variables as result age is similar to that of females.
Cluster analysis
Two-step clustering
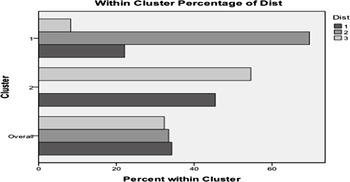
The cluster distribution shows the number of cases in each cluster. Two clusters were found having 48 percent (303) and 52 percent (328) of goat population under cluster 1 and 2, respectively. The descriptive statistics for the three districts shows all goats at Meanit Shasha plus 31.0 and 12.3 percent goats at Sheko and Shey Bench were grouped at cluster 1 whereas 69.0 and 87.7 percent of goat at Sheko and Shey Bench at cluster 2. In Figure 2, the within cluster percentage plots showed the percentage of goats from each district, was distributed within each cluster.
The weight (percentage) of each district in each cluster

Identified goat ecotypes
Besides the statistical output from the chi-square tests, the GLM and cluster analysis, focus group discussions were also employed to identify goat genetic resources distributed in the area. The goat population were characterized and classified in to two ecotypes named as Meanit and Sheko goat ecotypes. The identifying features of the ecotypes are discussed below.
Meanit goat ecotype
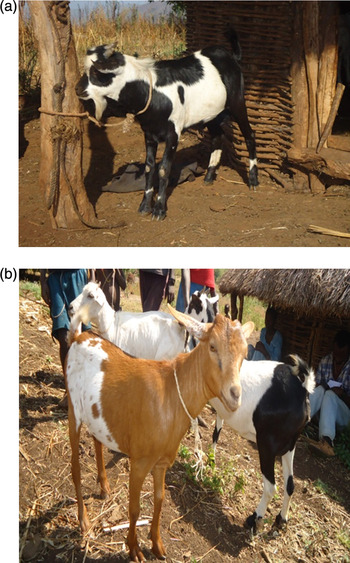
The Meanit goat derives its name from the ethnic group that maintains it. During focus group discussions no one was found to have any knowledge on the history and origin of the ecotype. Key identifying features of this ecotype are the coat colour patterns which are mainly patchy (60.7 percent of female and 68.8 percent of males). Black with white patches was observed in 27.8 percent of females and 30.5 percent of males while, white with black patches was observed in18.7 percent of females and 22 percent of males, In terms of size goats of Meanit ecotype have larger dimension than Sheko as shown by larger linear body measurements. Typical male and female goats from Meanit ecotype are presented in Figure 3a and 3b, respectively.
Meanit goat ecotype; Male(a) and Female(b)

Sheko goat ecotype
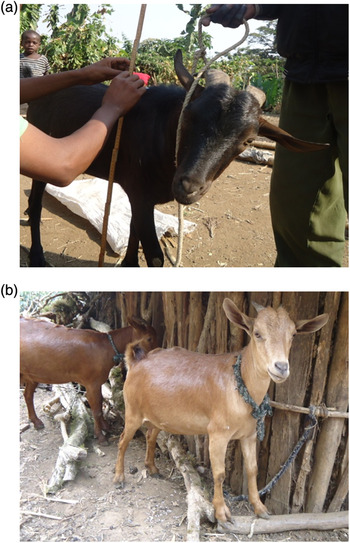
Sheko goat ecotype derives its name from both the ethnic group and the geographic location. Key identifying features are the coat colour patterns which are mainly plain brown, white and red colours. This goat ecotype has smaller linear body measurements than Meanit. Typical male and female Sheko goat ecotypes are presented in Figure 4a and 4b, respectively.
Sheko goat ecotype: Male(a) and Female(b)

Discussion
In the univariate analyses each variable was analysed separately, causing substantial overlapping of results and observations were not showing the variation between goat populations clearly. In multivariate statistical techniques, all variables were considered simultaneously in the differentiation of population. This approach resulted in a more powerful comparison of population that cannot be achieved with univariate analysis (Ogah, Momoh and Dim, Reference Ogah, Momoh and Dim2011). Two clusters were obtained having the goat populations that were distributed more or less equally under each cluster. Thus, the goat population at Sheko and Shey Bench showed more similarities than the Meanit Shasha. As a result Sheko and Meanit ecotypes were identified. This result supports the chi-square and the GLM analyses. Moreover, the cluster analysis clearly showed the variation between the goat populations.
Sheko and Meanit goat ecotypes are closely related to each other. Moreover, the phenotypic characteristics of these ecotypes showed that they have close relationship with that of Keffa and Western Lowland goat types of Ethiopia (FARM Africa, 1996). This finding agreed with reports of Tucho (Reference Tucho2004) and Hassen et al. (Reference Hassen, Lababidi, Rischkowsky, Baum and Tibbo2012) who indicated that all the Ethiopian goat populations are very closely related to each other. Even though the ecotypes are closely related to each other, they have developed adaptive traits to their specific environments and should be used to their full potential to benefit goat production in their respective areas. In agreement to Hassen et al. (Reference Hassen, Lababidi, Rischkowsky, Baum and Tibbo2012) report from the result of the current study also suggested that the close relatedness of the goat ecotypes, which might have happened due to the existence of uncontrolled animal breeding strategies resulting from uncontrolled movement of animals through various market routes, agricultural extension systems and geographic environment proximity.
Goat production serves different purposes mainly as a source of income and meat. However, in this study no respondent has reported use of the goats for milk. This is in agreement with the report of FARM Africa (1996) that goats were not milked in parts of Gojam, Wellega, Keffa and Wolayta. However, results from studies on short eared Somali goat (FARM Africa, 1996; Gebreyesus, Reference Gebreyesus2010) showed that goats are milked in other parts of the country.
Higher twinning rate was obtained in this study (twinning rate of 60.6 percent of litter size of 1.6) from the goat ecotypes. However, the twinning rate computed for the goat populations in the current study are higher than rates reported by FARM Africa (1996) and Gebreyesus (Reference Gebreyesus2010). This result showed that these goat populations are relatively prolific. The Western Lowland, Western Highland, Keffa and Woyto-Guji goats have clearly been selected for prolificacy by societies for whom milk is not so important (FARM Africa, 1996). This result suggests that the higher preference for twinning by goat owners in this study area.
Even though different traits were considered in selecting breeding animals it appears high twinning ability with best kid growth, good mothering character and large body size in females and large body size, good family history and fast growth in males were the most preferred traits (unpublished data). Therefore, goat breeding objectives of the community are to improve growth and increased number of kid crops of goat thereby improving meat production potential of the goats and increased income.
Conclusions
This study has identified and characterized goat genetic resources distributed in the study area. Goat populations at Meanit Shasha have shown differences, in some of their qualitative traits, with goats from the two other sites (Sheko and Shey Bench); whereas from Sheko and Shey Bench have comparatively more similarity in their qualitative traits. Therefore, the goats were categorized into two ecotypes, which are named as Meanit and Sheko goat ecotypes. Meanit goat ecotype was homogenous in their phenotypic characteristics and relatively larger than that of Sheko goat ecotype. In addition to that Meanit goat ecotype has larger proportion of patchy coat colour pattern than the Sheko ecotypes. Further work is required to quantify the productive performance of the ecotypes through monitoring. In addition to that advanced molecular characterization may need to be done to ascertain if there is sufficient difference at genotypic level and to help in identification of genes with potential for use as genetic markers. Large sexual dimorphism has been observed in both ecotypes, and that can be exploited to develop a smaller reproducing generation (female) and a relatively larger slaughter generation (male).
Acknowledgements
Our heartfelt thanks and appreciation goes to all households who actively participated in this study. Our acknowledgement also extends to all the local development agents and experts, who assisted and cooperated very positively for the success of this study. We further express our gratitude to the Bench Maji zone, and Sheko, Shey Bench and Meanit Shasha Districts Agriculture and Rural Development Offices for their positive collaboration while conducting the study.