Introduction
Why do some governments adopt far-reaching policy reforms, while others settle for only minor adjustments or avoid reforms altogether? Scholars of comparative politics generally believe that reform choices reflect either the partisan preferences of governing parties or the extent of political constraints presented by veto players. I argue that these theories should be complemented with insights from the literature on blame avoidance to obtain a more systematic account of how partisan preferences and veto players affect reform outcomes. The main finding of this literature, which has been particularly prominent in research on welfare state reforms (Bonoli, Reference Bonoli2001; Pierson, Reference Pierson2001), is that politicians avoid unpopular reform in contexts in which blame is easily attributed, and pursue such reforms when significant power sharing makes it difficult to hold any one party directly responsible. I maintain that the applicability of this argument depends on government partisanship. In contrast to the blame avoidance literature, I contend that reforms are not equally unpopular for all political parties.Footnote 1 Because parties cater primarily to their core voters, they will resort to blame avoidance strategies only when reforms adversely affect their core constituency. Left and right parties thus pursue different strategies depending on the type of reform (liberalizing vs. regulatory) and the number of veto players (few vs. many). A few predictions follow from this proposition, but the key one relates to reforms that reduce entitlements provided by social and employment policies. Left parties will pursue such reforms primarily when the number of veto players is sufficiently large to help avoid direct responsibility. In contrast, right parties will not shy away from taking responsibility, but are less likely to be successful in pushing the reform through in the context of many veto players. The central implication of this argument, therefore, is that veto players can have either an enabling or constraining effect on reforms depending on the partisan orientation of a government.
This paper tests this argument by focusing on reforms of employment protection, a body of legislation that governs the employment relationship and constrains employers’ ability to hire and fire at will. Employment protection has been subject to considerable reform over the past two decades. While some reforms have entailed significant liberalization, others have strengthened the regulation of particular aspects of the employment relationship. The scope of reforms has also differed. Some reforms were structural, addressing the overall design of the existing systems, while others focused on issues that affect only particular groups (such as fixed-term employees).
Under what conditions do governments adopt different types of employment protection reforms? Taken separately, neither veto player nor partisanship accounts can explain the likelihood of different types of employment protection reforms. While the former focuses on explaining the occurrence of reform in general, the latter is concerned primarily with the direction of reforms. This paper presents a model that explains the likelihood of different types of reform as an effect of different constellations of government partisanship and veto players. Two general assumptions underpin this model. The first is the standard assumption that politicians want to stay in power or secure electoral gains. The second assumption is that deteriorating economic circumstances over the last two decades have made both left and right parties in Europe increasingly inclined to perceive labor market liberalization as a potential solution to underlying economic problems.Footnote 2 If these assumptions are correct, left and right parties should respond differently to constraints and opportunities offered by veto players. Overall, the ‘blame avoidance’ logic should be particularly relevant for left parties in power, while the ‘veto players’ logic should pertain to parties of the right. Liberalization is therefore most likely to be undertaken either by left parties in contexts with a high degree of power sharing or by right parties facing few veto players. Right parties are also expected to pursue liberalization in contexts with a high number of veto players, but they are less likely to be successful in this scenario since their efforts to pass liberalization measures are likely to be blocked by veto players from the left who try to appeal to their core constituencies. As the number of veto players increases even further, right parties may even end up adopting marginal regulation if they are facing strong external pressures, such as the requirement to implement European Union (EU) legislation (and such reforms are unlikely to be blocked by veto players from the left). Put simply, in such cases the outcome is not the reforms that right parties want, but the reforms they cannot avoid. Regulatory reforms, however, should be most likely in contexts where left governments enjoy strong power concentration. These predictions are tested with data on employment protection reforms in a panel of 24 EU countries during 1990–2007. The empirical results show that the proposed model offers a better explanation of reform outcomes than either the standard veto player model or the partisanship model. The results support the view that veto players affect reform strategies differently for left and right governments, and that the type of reforms corresponds to particular constellations of these two factors.
The paper is organized as follows: The first section introduces the subsequent analysis by providing a brief summary of reform activity in Europe since 1990. Seeking to explain variation in reform outcomes, the second section proposes a synthesis of the veto players and partisanship models and outlines the central argument in more detail. The third section discusses the data and methods used to test the outlined predictions. The fourth section presents a discussion of empirical results, and the fifth section concludes.
A brief summary of reform activity in Europe, 1990–2007
European countries have witnessed substantial reform activity in the area of employment protection legislation (EPL) over the past two decades. To address sluggish labor markets and respond to increasing competitive pressures, many reforms have sought to increase flexibility and relax the rules that govern hiring and firing practices. Yet, despite the popular view that most, if not all, reforms during this period have been liberal, data show that regulatory reforms have been almost equally likely. During 1990–2007, a total of exactly 200 EPL reforms were passed in Europe.Footnote 3 Only 105 of those were liberal, while the rest were regulatory. While a large portion of regulatory reforms can be attributed to the adoption of EU legislative directives addressing issues such as fixed-term contracts, temporary work agencies, and collective dismissals, a considerable number of regulatory reforms was driven entirely by domestic factors. In some cases, these reforms implied new regulation, in others a reversal of previous liberalization.
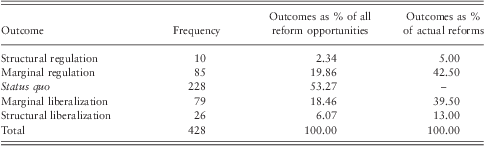
Regardless of the direction, however, the majority of EPL reforms have been marginal, entailing few major changes for regular, full-time employees. This confirms previous findings of studies of reforms of employment protection in Western Europe (see Esping-Andersen and Regini, Reference Esping-Andersen and Regini2000). The overwhelming proportion of marginal reforms reflect a high degree of risk aversion on the part of politicians or the power of different veto blocks. Yet, contrary to the view that regardless of whether far-reaching reforms are attempted, the result is primarily marginal adjustments (Saint-Paul, Reference Saint-Paul1996), Table 1 shows that almost a fifth of reforms were structural, implying significant changes in employment protection affecting all or a majority of employees.
Employment protection reforms in Europe, 1990–2007
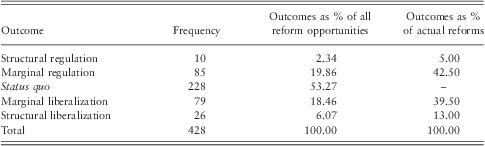
Source: Data for Western Europe are from the FRdB Social Reforms Database. Data for Central and Eastern Europe countries collected by the author (see Avdagic, Reference Avdagic2012b).
As is evident, while the number of marginal regulatory and liberal reforms is similar, liberalization is clearly dominant among structural reforms. Nonetheless, almost a third of structural reforms have been regulatory, which further underlines the need to understand not only the conditions under which reforms are possible, but also the conditions for different types of EPL reform.
Veto players and political partisans in labor market reforms
What explains the likelihood of different types of employment protection reforms? Two strands of political science literature provide relevant clues. The first strand emphasizes the role of veto players. These studies usually refer to the structure of the political system and argue that a high number of institutional (and in some cases partisan) veto players is an impediment to reforms (Immergut, Reference Immergut1992; Huber et al., Reference Huber, Ragin and Stephens1993; Kittel and Obinger, Reference Kittel and Obinger2003). A more complex version of this argument emphasizes the need not only to count the number of potential veto players, but also to examine empirically their specific policy preferences (Tsebelis, Reference Tsebelis2002; see also Hallerberg and Basinger, Reference Hallerberg and Basinger1998; Braeuninger, Reference Braeuninger2003). These differences notwithstanding, common to these arguments is the general idea that the higher the number of veto players, the lower the likelihood of reforms. A number of welfare state scholars, however, have turned this argument on its head and maintain that a high number of veto players may actually facilitate reforms. The premise here is that in the era of ‘permanent fiscal austerity’ all parties are under pressure to cut entitlements. The contemporary politics of reforms, so this argument goes, is the ‘politics of blame avoidance’ (Bonoli, Reference Bonoli2001; Pierson, Reference Pierson2001). Since a high number of veto players makes it difficult to easily attribute the blame for liberal reforms to any single political party, reforms should be more likely in contexts dominated by many veto players. The second strand of scholarship emphasizes the role of government partisanship. The argument here is that left parties are interested in protecting their core constituencies from labor market risks, and are therefore likely to expand, or at least oppose cuts in, social protection. Similarly, right parties, whose core supporters are less exposed to labor market risks, are more likely to adopt liberal reforms (Korpi and Palme, Reference Korpi and Palme2003; Allan and Scruggs, Reference Allan and Scruggs2004; Amable et al., Reference Amable, Gatti and Schumacher2006).
Taken separately, however, these two strands of literature do not offer a complete answer to the question of determinants of different types of employment protection reforms. The veto player argument allows us to examine the occurrence of reforms, but it does not have much to say about the direction that a particular reform is likely to take. Its opponent – the blame avoidance argument – suffers from a similar flaw in that it allows us to examine the occurrence of only one type of reforms, namely liberal reforms. While the argument that all contemporary reforms are essentially retrenchment reforms may hold for some policy areas (such as pensions), this is clearly not the case with employment protection reforms, as shown above. Partisanship arguments, on the other hand, make clear predictions about the direction of reforms, but have little to say about the general conditions that make reforms more or less likely. To the extent that they consider political constraints (most often the constitutional structure), these are commonly entered into models as a control, and are rarely found to be significant (see Allan and Scruggs, Reference Allan and Scruggs2004).Footnote 4 An additional problem is that, apart from the blame avoidance arguments, partisanship and veto player approaches tend to consider policy preferences largely in isolation of parties’ electoral strategies.
This paper argues that these strands of scholarship need to be combined to understand the politics of employment protection reforms in Europe during the last two decades. While political parties try to cater to their traditional constituencies, in times of economic difficulties both left and right parties may be inclined to liberalize employment protection.Footnote 5 I maintain that the goal they decide to pursue in a particular instance depends on the number of veto players. A high number of veto players presents different opportunities and constraints for left and right parties in government. Left parties are likely to see this as an opportunity for blame avoidance, which enables them to undertake liberalizing reforms while not being held directly accountable for such reforms by their core constituencies.Footnote 6 In a similar situation right parties will not shy away from pursuing liberal reforms, but their attempts are less likely to be successful since veto players from the left may try to secure future electoral gains by defending employment protection. The outcome in this case is therefore somewhat indeterminate and even marginal regulation may be possible, provided that government is facing simultaneously a high number of veto players and external pressures. The latter may seem surprising given that the right is not usually associated with regulatory reforms. However, the area of employment protection is peculiar in that all EU member states are subject to EU legislative directives that are generally of a regulatory character, albeit marginal. When in opposition, the right has nothing to lose from trying to block the domestic adoption of such EU-induced reforms. This strategy would likely meet the preferences of its core constituencies and is unlikely to be at the receiving end of any infringement procedures the European Commission might start in reaction to such a breach of EU law. While obviously EU legislation has to be passed sooner or later, parties of the right will want to appeal to their core constituencies and try to delay its domestic adoption when they are in opposition. But when in office, these parties will have an incentive to adopt this legislation so as to avoid potential penalties from the EU, and to simultaneously try to appeal to the pool of undecided voters who may favor higher employment protection. In the case of marginal regulation proposed by the right, a high number of veto players is not an impediment to reform, since the left is unlikely to oppose these measures.
The context with few veto players should generate different outcomes. Because a low number of veto players makes it easier to attribute either blame or credit to governing parties, left parties will try to cater to their traditional voters and respond to their calls for more protection by adopting regulatory reforms unless economic conditions are particularly dire, in which case they should prefer the status quo. In contrast, parties of the right will see this situation as an opportunity to pass liberal reforms, which is in line with the preferences of their core constituencies. Figure 1 provides a summary of these predictions. It should be noted that these predictions are based on the assumption that proposal power (see Cameron and McCarty, Reference Cameron and McCarty2004) rests with the cabinet collectively, and that passing a proposal requires a majority vote. Thus, the left (right) governments depicted in Figure 1 are those in which left (right) parties hold more than 50% of cabinet seats.
Predictions about reform outcomes.

The guiding proposition of this paper requires an important qualification. Since employment protection reforms are not an everyday occurrence, the most frequent outcome regardless of partisanship and the number of veto players is the status quo. When the economy is doing generally well and there is no clear need for immediate employment protection reforms, a high number of veto players is likely to impede change. Similarly, in cases with few veto players and an absence of considerable economic problems, most parties are unlikely to pursue liberalization for fear of electoral retribution.Footnote 7 The proposed model, therefore, does not challenge the generally accepted view that institutions are sticky and reforms may be difficult to carry out. What it does instead is to predict what types of EPL reforms are most likely with particular constellations of government partisanship and veto players in times of austerity.
Before we proceed with the analysis we should consider the contribution of this argument to the broader literature on the relationship between the political process and public policies. The general argument that partisanship and veto power influence policy interactively is not as such novel in the political science literature. Studies of fiscal policymaking have demonstrated the importance of this interaction (Alt and Lowry, Reference Alt and Lowry1994, Reference Alt and Lowry2000; Bawn, Reference Bawn1999). The welfare state literature has also considered how the effects of partisanship are mediated by veto players (Kittel and Obinger, Reference Kittel and Obinger2003; Korpi and Palme, Reference Korpi and Palme2003). More recently, within the literature on labor market policies, Becher (Reference Becher2010) has shown that veto players affect the ability of labor ministers to pursue their partisan preferences. In his account, partisanship has an impact on reforms only if the ideological distance between veto players is small. The argument developed here modifies these partisan versions of the veto player framework by incorporating considerations of blame avoidance. Rather than viewing a high number of veto players as a universal obstacle to reforms, this article shows that left and right parties respond differently to constraints and opportunities presented by veto players. Put simply, while this argument shares with these accounts the predictions about policies in contexts of few veto players, the key difference is that in the context of many veto players governments dominated by left parties are more likely to adopt liberalization than the right. In what follows I demonstrate that this modified argument that incorporates considerations of blame avoidance does a better job at explaining labor market reforms in Europe than the conventional partisan and veto player accounts.
Data and methods
To examine governments’ propensity to carry out labor market reforms I employ annual data on employment protection reforms in Europe during 1990–2009. Data for Western Europe come from the fRDB-IZA Social Reforms Database (2010), which provides qualitative data in the form of summaries of reform measures adopted at a particular point in time and an overall classification of reforms according to their direction and scope. The direction of reform indicates whether the reform increases or decreases the flexibility of the labor market. Correspondingly, the terms liberalizing and regulatory reforms are used to capture the direction of reforms. The scope of reforms, on the other hand, indicates whether a reform is marginal or structural. The former typically affect particular segments of the labor force (such as fixed-term employees, women, youth, etc.), while the latter affect all employees and adjust the broader design of the existing systems, rather than their specific features.Footnote 8 The fRDB-IZA database covers EPL reforms up to 2007. Data on reforms for 10 EU member states from CEE from 1990 to 2009 were collected following the same template. The data collection process entailed three steps. In the first step an inventory of reforms was assembled based on an extensive search of national legislation, secondary literature, newspaper sources, and records published in the European Industrial Relations Observatory Online. To verify this information, the preliminary database was sent to teams of national experts who added any missing information and corrected factual mistakes. Finally, any inconsistencies between the originally collected data and experts’ responses were checked against the sources provided by experts, and in some cases alternative experts were consulted to verify the correctness of the information. Since we can think of reforms as a set of possibilities that imply different degrees of labor market flexibility, the records on reforms were then coded on a 1–5 scale so as to capture the extent of employment protection liberalization. Given the classification of reforms, structural reforms that increase the flexibility of the labor market were assigned the highest score, while the lowest score (which implies negative liberalization) was given to structural regulatory reforms. Marginal reforms were assigned scores 2 and 4, while the status quo is coded as 3.Footnote 9
Data for the key independent variables include measures of veto players and government partisanship. Because veto player arguments come in two forms, the veto player model is evaluated by using two alternative indicators for veto players. The first indicator is a measure of the ideological distance between veto players. In line with Tsebelis (Reference Tsebelis2002), all parties in multiparty coalitions are considered to be veto players. In addition, upper chambers and presidents are also veto players if they have constitutional veto power and if these institutions/offices are not dominated by the governing parties. The ideological distance is calculated on the basis of the policy positions of the relevant players as provided by the Comparative Manifesto Project (CMP; Budge et al., Reference Budge, Klingemann, Volkens, Bara and Tanenbaum2001; Klingemann et al., Reference Klingemann, Volkens, Bara, Budge and McDonald2006). Following Becher (Reference Becher2010), I use variable myrl3 from Cusack and Engelhardt's (Reference Cusack and Engelhardt2007) database, which relies on CMP and indicates party positions regarding economic policy. This variable incorporates different measures of party preferences regarding market regulation and welfare distribution. It ranges from −100 (extreme left or interventionist) to +100 (extreme right or market liberal). Since Cusack and Engelhardt's data cover only advanced economies, I followed the same methodology and constructed myrl3 for the 10 CEE countries. The ideological distance is then computed as the difference in policy positions between the most extreme veto player on the left and the most extreme veto player on the right, and rescaled to range from −1 to +1. Because CMP codes policy positions on the basis of election manifestos, the value of this variable changes only at election intervals. The second indicator of veto players captures arguments about reform likelihood that rely primarily on the number of veto players. For this purpose I use variable checks from Beck et al. (Reference Beck, Clarke, Groff, Keefer and Walsh2001). This variable measures the number of veto players accounting for electoral rules, party affiliations, and electoral competitiveness. It ranges from 1 (countries without an effective legislature) to 10. This indicator is preferred to other indicators of constraints on government policy discretion, such as the widely used index of constitutional structure (Huber et al., Reference Huber, Ragin and Stephens1993), because it captures both institutional and partisan veto players, and the latter are particularly important for the central argument. Regarding partisanship, the analysis incorporates the standard indicator of left-party and right-party strength in government: the share of cabinet seats occupied by left and right parties (Armingeon et al., Reference Armingeon, Careja, Engler, Gerber, Leimgruber and Potolidis2009).
All models include the same set of institutional controls. The level of employment protection in the previous year is included since there should be more pressures for liberal reforms in contexts where existing employment laws are strict. The indicator that captures the level of employment protection is an EPL index, which ranges from 0 to 6, with higher values indicating stricter regulation. Proposed originally by the OECD, this index incorporates information on 18 items reflecting the hiring and firing rules for regular workers, temporary contracts, and collective dismissals. Following the OECD methodology, I constructed the EPL index for CEE countries by relying on national legislation, the ILO's Natlex database, secondary literature, and standardized questionnaires completed by teams of national experts (see Avdagic, Reference Avdagic2012a). In contrast to the OECD series, which is interpolated from a few data points, this index captures the strictness of employment legislation in force on a yearly basis. Data on Western Europe were provided by Allard (Reference Allard2010),Footnote 10 whose EPL index is also time varying and based on the same methodology.
In order to account for differences in the influence that organized economic interests may have on EPL reform, two further institutional controls are included. The first is union density, that is net union membership as a proportion of the employed labor force, which serves as a proxy for union strength. Since employment protection is one of the key aims of trade unions, the standard expectation is that strong unions will resist EPL liberalization. The second control that captures the influence of organized interests is wage coordination. Inasmuch as coordinated wage setting is associated with a higher capacity to reach a consensus on labor market reforms, such arrangements may facilitate liberal reforms. Data on both union density and the index of wage coordination are taken from Visser (Reference Visser2009).
Because the underlying premise is that economic problems usually serve as an impetus for reform proposals, the models include a set of economic controls that combine GDP growth, unemployment, and trade openness. GDP growth is included because in economies that experience high growth governments should be generally less likely to embark on liberal reforms. Unemployment and trade openness are included in all models in both levels and first differences so as to capture more completely the impact of these variables on governments’ propensity to reform. The effect of these variables is, however, indeterminate. While high and rising unemployment may increase governments’ determination to liberalize employment protection, liberalization may be politically risky in an environment in which unemployment places increasing pressure on public budgets and unions may organize to defend their entitlements. Similarly, trade openness and its first difference, which captures the effects of globalization and the increasing competition of the world markets, may work both ways and either stimulate liberal reforms or strengthen demands for more protection (Garrett, Reference Garrett1998). Data on economic controls are taken from Heston et al. (Reference Heston, Summers and Aten2009), the IMF World Economic Outlook, and the European Bank for Reconstruction and Development database.
The level of GDP per capita at purchasing power parity (PPP) was included in the initial regressions to control for the level of development. In addition, an indicator of electoral cycle was used as a control since one might expect that governments may be more prone to opt for liberal reforms at the beginning of their term in office, and for regulatory reform at the end of their term. This indicator counts the number of months between the election and the reform, and was constructed on the basis of the election data collected by Armingeon et al. (Reference Armingeon, Careja, Engler, Gerber, Leimgruber and Potolidis2009). Since neither the level of GDP nor the measures of electoral cycle were statistically significant in any specifications, they were discarded from the final analysis.
Estimation strategy
Because the dependent variable consists of discrete ordinal numbers (1–5), an ordered probit model is used to estimate the likelihood of EPL reforms.Footnote 11 Given the panel nature of the data, ideally a fixed-effect model should be estimated to control for unobserved heterogeneity across countries. Unfortunately, there is no readily available formulation of a fixed-effects ordered probit estimator.Footnote 12 One alternative would be to simply insert the individual country dummies, but the estimates may suffer from bias due to the so-called incidental parameters problem (Greene and Hensher, Reference Greene and Hensher2010). Another alternative would be to estimate a random-effects ordered probit model. However, the assumptions of this model that countries are random draws from a population and that country individual effects are uncorrelated with other covariates seem untenable.Footnote 13 Thus, I estimate a pooled ordered probit model using a robust variance-covariance matrix clustered by country. This strategy helps to reduce the potential problem of serial correlation as it allows the errors to be correlated across reforms within the same country while still requiring them to be independent across countries.
As a robustness check I also estimate an ordinary least squares (OLS) pooled regression with the variance-covariance matrix clustered by country, and to control for unobserved heterogeneity a fixed-effects linear model, an OLS model with panel corrected standard errors (OLS-PCSE), and the BUC ordinal logit. The latter stands for ‘Blow-Up and Cluster’, a new procedure, which replaces every observation by K-1 copies of itself and dichotomizes these copies at a different cutoff point. A conditional maximum likelihood logit is then estimated using the entire sample, and relying on standard errors clustered at the country level (Baetschmann et al., Reference Baetschmann, Staub and Winkelmann2011). Although OLS incorporates a problematic assumption that the difference between the discrete rankings of reform types is the same, these linear models nonetheless serve as a useful check of the main results. The BUC estimator is used for the same reason. While this estimator is not ideal for the data at hand, because its dichotomization procedure entails a certain loss of information with respect to the ordinal nature of the dependent variable, the fact that BUC aims to account for unobserved heterogeneity makes it worth exploring. If most estimators yield similar results regarding the key variables, namely the interaction between partisanship and the number of veto players, this should increase our confidence in the ordinal probit estimates.
Empirical results
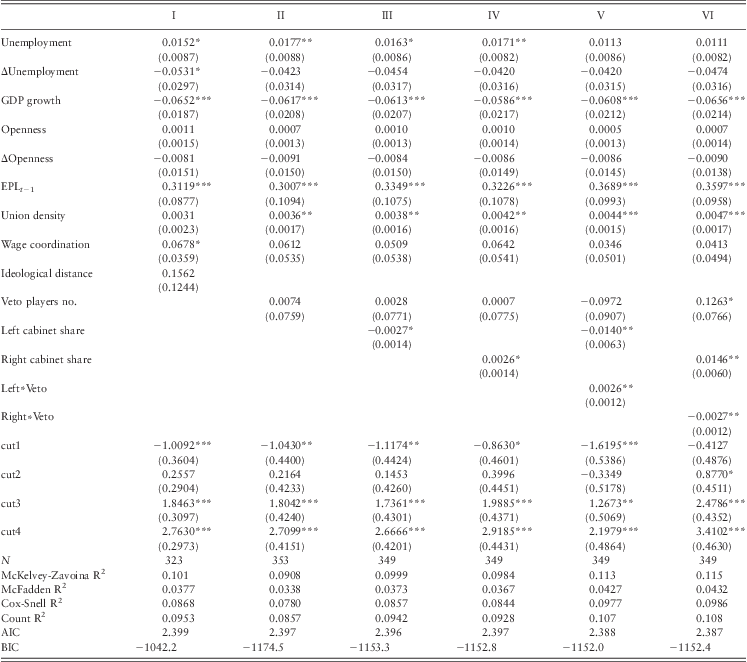
Table 2 shows ordinal probit estimates for the reform of employment protection in 24 EU countries between 1990 and 2007. The sign of coefficients in ordinal probit models provides directional information for the end categories of the dependent variables, but it does not allow us to make inferences about the magnitude and the rate of change for particular categories of the dependent variable. The coefficients in Table 2 therefore indicate the general direction in the likelihood of structural reforms only, such that, a positive coefficient indicates an increased likelihood of far-reaching liberalization. Note that the exact probability of the specific reform outcome is calculated separately in the next section. The first two columns present the results for the standard veto player model. The difference between Models I and II is that they incorporate different measures of veto players. While Model I captures the influence of veto players through the measure of the ideological distance between the most extreme institutional and partisan veto players, Model II focuses primarily on the number of veto players. Models III and IV approximate the standard partisanship model. In line with Allan and Scruggs (Reference Allan and Scruggs2004), this model is estimated alternately with left- and right-party strength variables, while controlling for the impact of the number of veto players. Finally, columns V and VI present the results for the model in which the effect of government partisanship is conditional upon the number of veto players.
Determinants of employment protection reforms, 1990–2007 (ordinal probit estimates)
Note: Robust standard errors clustered by country in parentheses.
*P < 0.10, **P < 0.05, ***P < 0.01.
As is evident, the veto player model alone does not seem to be a suitable framework for explaining the likelihood of employment protection reforms, irrespective of the measure of veto players used. As an additional check, I also estimated the veto players model by using the measure of political constraints (Polcon index) developed by Henisz (Reference Henisz2010), which also failed to reach statistical significance. It should be noted though that since the conventional veto player argument (Tsebelis, Reference Tsebelis2002) is about policy stability, rather than the direction of policy change, Models I and II in Table 2 may not do justice to this argument. Alternative models that focus only on the occurrence of reform (standard probit and logit) or on the degree of policy change (using the EPL index as the dependent variable and relying on a linear fixed-effects model) may be a ‘fairer’ test. The results of these models, however, do not support the standard veto player argument either.Footnote 14 Models III and IV offer some support for the partisanship arguments, with the coefficients for cabinet shares of both left and right parties significant at the 10% level. Because marginal effects in probit models are a function of all other independent variables, the magnitude of these coefficients cannot be directly interpreted as in linear models. However, we can at least see that the coefficients for partisanship variables are signed as expected by the partisanship hypothesis: left governments seem to be associated with a lower likelihood of far-reaching liberal reforms (outcome 5 on the ordinal scale), while right governments are linked to a higher likelihood of such reforms. Also, in line with the findings of Allan and Scruggs (Reference Allan and Scruggs2004), the control for the number of veto players is not significant in these models. Models V and VI augment the partisanship models by adding the interaction between government orientation and the number of veto players. In both versions of the model the interaction effects turn out to be significant at the 5% level, and both coefficients are correctly signed. In comparison to Models III and IV, these results suggest that the effect of government partisanship is estimated more precisely when the interactions with the number of veto players are included. As Table 2 shows, most measures of fit indicate that Models V and VI offer a better explanation for the data at hand.
Turning to the institutional and economic controls, the coefficients for three variables – the strictness of the existing employment legislation, GDP growth, and union density – are also significant in all models. The positive coefficient on union density is somewhat surprising since strong unions are conventionally expected to try to block liberalization. This result, however, may be understood in light of the experience of some broad-based deals between unions, government, and employers trading a reduction in employment protection for core workers for a recalibration of other security measures, such as unemployment benefits, a higher investment in active labor market policy, etc. During the 1990s, trade-offs of this type were made in countries such as Finland and Denmark, both of which have high union density. Several studies argue that such reductions in employment protection were acceptable to strong unions because they were compensated by more generous unemployment benefits (Eichhorst and Konle-Seidl, Reference Eichhorst and Konle-Seidl2005; Boeri et al., Reference Boeri, Ruiz and Galasso2011). Although these coefficients reflect primarily the impact of union density on the end categories of the dependent variable (i.e. structural reforms), one should keep in mind that a large proportion of liberal reforms are marginal reforms, many of which are a result of negotiations with the unions. Inasmuch as unions care first and foremost about their members, they may be willing to accept a certain degree of liberalization as long as their members are not directly affected. Indeed, empirical evidence suggests that most liberalizing reforms endorsed by unions have typically involved an erosion of protection for outsiders, such as fixed-term and temporary agency workers, rather than core workers (Palier and Thelen, Reference Palier and Thelen2010; Eichhorst and Marx, Reference Eichhorst and Marx2011). Fixing all variables at their mean and varying only the levels of union density shows that the predicted probability of marginal liberalization indeed increases with an increase in union density. When union density is set at 70%, the likelihood of marginal regulation and liberalization is roughly 15% and 20%, respectively, while at the mean value of union density (41%), the likelihood of both types of reform is approximately the same. This supports the view that when faced with the need for reforms, relatively strong unions will try to protect their core constituency and accept liberalization at the margins, which primarily affects groups that are not part of the core workforce. It must be noted, however, that marginal effects (not shown here) indicate that the effect of union density is rather small compared with other variables. The coefficients for the other two controls are signed as expected. High levels of existing protection make far-reaching liberal reforms more likely, while higher levels of growth reduce the likelihood of such reforms.
Substantive effects
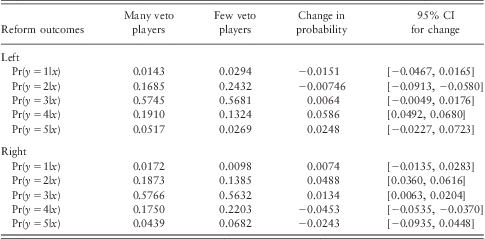
As already mentioned, ordinal probit models preclude a straightforward substantive interpretation of the coefficients. Positive (negative) coefficients generally indicate a higher (lower) probability of outcomes that have a high value on the ordinal scale, but the precise effect on predicted values of y needs to be calculated. In what follows the substantive effects of the key variables are discussed by computing the predicted probabilities for the different reform outcomes. Specifically, I fix the value of government partisanship so as to capture a predominantly left or right government, and calculate the predicted probabilities of reform for a high and low number of veto players. This permits a direct evaluation of the central argument that the effect of government partisanship on reform is conditional on the number of veto players. Table 3 reports such predicted probabilities for both left and right governments. In line with Armingeon et al. (Reference Armingeon, Careja, Engler, Gerber, Leimgruber and Potolidis2009), cabinet shares are set at 66.67% to capture predominantly left or right governments. A high and low number of veto players are approximated by fixing the index of checks to 6 and 2, respectively.Footnote 15
Predicted probabilities of reform outcomes
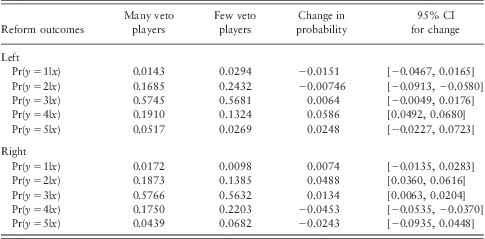
The differences between the left and right are immediately visible and consistent with the central argument. In contexts characterized by many veto players the left shows more propensity to adopt liberal reforms than the right (0.24 vs. 0.21). As expected, the left is also more likely to adopt liberal (0.24) than regulatory reforms (0.18). In contrast, the right in the same scenario is only marginally more likely to adopt liberal (0.21) than regulatory reforms (0.20). Situations with few veto players are exactly the opposite: Here, the right shows considerably more propensity to liberal reforms than the left (0.28 vs. 0.15). Moreover, the right is much more likely to adopt liberal reforms (0.28) than regulatory reforms (0.14) when faced with few veto players. In a comparable scenario, the left is likely to opt for quite a different strategy and try to cater to its core constituencies, as evident from the predicted probability for regulatory vs. liberal reforms (0.27 vs. 0.15). The magnitude of differences between left and right parties evident in Table 3 becomes even larger if we calculate the probabilities on the basis of a higher number of veto players (not shown here). For example, in a somewhat less frequent scenario of 7 rather than 6 veto players the left is significantly more likely to adopt liberal reforms than the right (0.27 vs. 0.20). In this scenario the left is also much more likely to adopt liberal (0.27) than regulatory reforms (0.16). The only difference from findings in Table 3 is that the right is now somewhat more likely to adopt regulatory than liberal reforms (0.22 vs. 0.20), which is in line with the expectation that the propensity of right parties to adopt liberal (regulatory) reforms decreases (increases) as the number of veto players increases. In addition, the predictions from Table 3 remain largely unaffected if the probabilities are calculated on the basis of lower values for partisan shares – the key conclusion that in the context of many veto players the left is more likely to adopt liberalization than the right still holds.
To examine the likelihood of reforms for a larger range of values of the veto players index, Figure 2 plots the predicted probabilities for the four types of reforms. This figure confirms that as the number of veto players increases the likelihood of liberal reforms also increases if the government is dominated by left parties.Footnote 16 But if right parties are in power, the probability of liberal reforms declines with the increase in the number of veto players. The case of regulatory reforms presents a mirror image: For the predominantly left governments, the probability of regulatory reforms decreases with an increase in the number of veto players, while for right governments the likelihood to adopt such reforms increases with a higher number of veto players. These findings support the underlying proposition that the blame avoidance logic is relevant primarily for governments dominated by left parties, while reform strategies of governments of the right are governed by the standard logic of veto players.
Predicted probabilities of different types of reform. Note: The solid lines capture the probability of marginal reforms, while the dashed lines represent the probability of structural reforms. The upper two plots refer to regulatory reforms, the bottom two to liberal reforms. The shaded area represents the 80% confidence interval.
Robustness checks
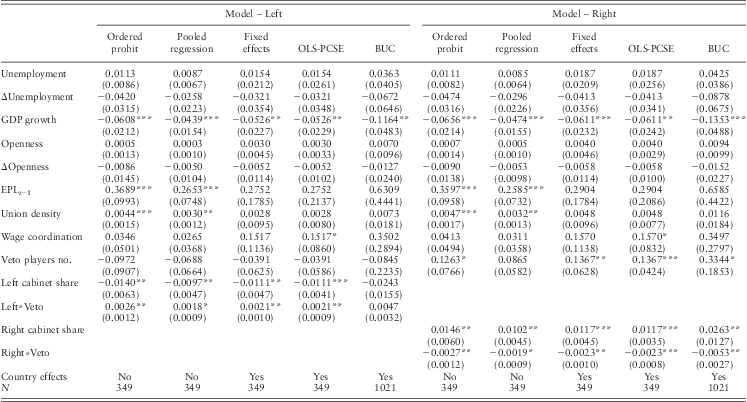
A number of checks were performed to examine the robustness of these results. The first check entailed the use of different estimators. Table 4 reports the results of this exercise for the preferred model that includes the interaction between government composition and the number of veto players. The first column in each of the two versions of the model (left and right) reports the original estimates obtained through the ordered probit procedure. The next three columns present different types of linear models, which assume that the dependent variable is continuous. Finally, the last column reports ordinal logit estimates obtained by using the BUC estimator, which allows us to stay with non-linear models and fixed-effects panel analysis, but carries some risk of not capturing adequately the information provided by the ordinal nature of the dependent variable. As evident, the results of the ordered probit are largely confirmed if we use the other estimators. The coefficient on the interaction between government partisanship and veto players is significant in all cases, save for the BUC model with left governments. In all models, GDP growth remains significant and negatively related to liberal reforms, confirming the underlying intuition that economic difficulties increase the propensity to employment protection liberalization among both right and left parties. Unsurprisingly, the slowly changing variables, namely union density and lagged EPL, lose significance in models that include fixed effects. All models from Table 2 have also been compared across these different estimators. The standard veto players model receives no support with any of these estimators, while the partisanship model (both left and right) is not supported by the fixed effect and BUC estimators. Separate regressions (obtainable upon request) employed an ordinal logit procedure. Apart from the unemployment coefficient, which becomes significant in the preferred model, the results are substantively similar to the ordinal probit estimates. Similarly, the inclusion of time dummies does not appreciably affect the results of the preferred model. The standard partisanship model, on the other hand, seems weaker as the coefficient for right governments loses significance.
Robustness checks across different estimators
OLS-PCSE = ordinary least squares model with panel corrected standard errors; BUC = Blow-Up and Cluster estimator.
Note: For ordered probit and pooled regression robust standard errors are clustered by country. Intercept and cutoff points omitted.
*P < 0.10, **P < 0.05, ***P < 0.01.
Additional robustness checks involved a number of changes in specifications. To check the impact of the individual variables, I first estimated a parsimonious specification, which entails only the measures of partisanship, veto players, and their interaction, and then added all the other predictors to this specification one by one. The results remain unaffected. Taking out non-significant variables does not change the results. Because GDP and unemployment are often correlated (albeit not in this sample), the same models were also run by including only one of these variables each time. The results remained robust. Given that the focus is on reform adoption rather than the implementation of new legislation, all models include present rather than lagged values of the economic variables. Lagging the economic variables, however, makes little difference to the overall results. In addition, as mentioned previously, a measure of the electoral cycle and a proxy for the stage of development was also included. These variables were not significant in any specification and did not change the overall results.Footnote 17 Finally, a Jackknife procedure was used to examine the influence of particular countries on the coefficient estimates. These regressions yielded coefficients on the interaction terms that were always correctly signed and almost always significant at the 10% level or better.Footnote 18 The sign and significance of other variables also hold across the regressions with one exception: dropping France makes unemployment marginally significant.
Conclusion
While the need for reforms that increase the flexibility of labor markets has been more or less a constant part of the political discourse in Europe over the past two decades, the political reality has been a mixture of liberal and regulatory reforms, most of which have primarily entailed adjustments at the margin, rather than far-reaching changes in rules governing employment relationships. By examining the role of veto players and governments’ political orientations, this article has proposed a heuristic model that identifies the conditions that make particular types of reforms most likely. The empirical analysis supports the theoretical argument that the impact of veto players on reforms depends on government partisanship.
Surprisingly, studies examining labor market reforms have not paid much attention to the interaction between partisanship and veto players (but see Becher, Reference Becher2010, as elaborated above). Within the broader welfare state literature Korpi and Palme (Reference Korpi and Palme2003) explicitly address the effects of the interplay between partisanship and veto players on retrenchment in several welfare programs. Focusing on advanced OECD countries during 1975–1995, they show that the highest risks for cuts are found in the contexts dominated by right parties and no constitutional veto points. This finding concurs broadly with the results presented in this paper. Yet, this analysis does not support Korpi and Palme's general proposition that ‘left parties differences in risks for cuts have little relationship to the number of veto points’ (Reference Korpi and Palme2003: 439), and that the left generally pursues retrenchment less than the right. As demonstrated in the case of employment protection, the left's propensity to carry out liberal reforms is strongly influenced by the number of veto players. More importantly, this paper shows that given the most favorable conditions for liberal reforms (i.e. many veto players in the case of left governments, and few veto players in the case of right governments), the left is almost as likely as the right to adopt reforms that reduce the strictness of employment protection.Footnote 19
These findings have several implications for our understanding of contemporary labor market politics. Most significantly, the analysis presented here calls into question the ability of standard accounts that emphasize either the role of veto players or government partisanship to explain outcomes of labor market reforms in times of austerity. In contrast to the standard veto player models, the results indicate that a high number of veto players is not always an obstacle to reforms. At the same time, and contrary to ‘blame avoidance’ arguments, this scenario does not always facilitate liberalization either. Instead, the article shows that the logic of reform politics depends on government partisanship: While the veto player logic applies primarily to parties of the right, the ‘blame avoidance’ logic is pertinent to the left. This explains why given the same number of veto players, we may observe quite different reform outcomes depending on whether the left or the right is in power.
The analysis presented here emphasizes the role of adverse economic conditions and is based on the assumption that both left and right parties may be increasingly inclined to liberalize employment protection. The argument, however, is not that partisan differences are no longer important. Instead, the central claim is that partisan politics continues to matter for labor market reforms, but not in the traditional sense in which left parties are always associated with an expansion and right parties with a reduction of welfare entitlements. Rather the claim here is that how partisanship matters for reform outcomes is conditioned by the impact of veto players. Parties will pursue the preferences of their core constituencies inasmuch as the configuration of the political system allows it, and as long as these preferences do not clash with the immediate economic imperatives. Considering parties as strategic actors who care about both votes and policies helps to understand why labor market reforms often do not reflect the traditional partisan preferences of parties in power.
Finally, the findings presented here cast some doubt on the idea that strong unions necessarily constitute a major impediment to liberal employment protection reforms. The results of the analysis suggest that unions may accept liberalization as long as the brunt of reforms is primarily placed on the shoulders of outsiders. This is broadly in line with accounts that emphasize the dualization of labor markets (Rueda, Reference Rueda2005; Palier and Thelen, Reference Palier and Thelen2010). Reforms at the margin are clearly easier to obtain than structural reforms, which affect unions’ core constituencies. Yet, even structural reforms are not impossible as long as they entail considerable compensatory measures in other areas of labor market policy, such as unemployment benefits. In this light, the fact that the likelihood of structural liberalization increases with union density should not be surprising since only strong unions may be capable of extracting such concessions. Weaker unions, on the other hand, are unlikely to have the capacity to secure a substantial quid pro quo, but may be an impediment to reforms inasmuch as their reactions increase uncertainty, which undermines governments’ determination to pursue far-reaching liberalization.
Acknowledgments
Research for this paper was supported by the ESRC grant RES-061-25-0354. Luna Bellani and Ekaterina Rashkova provided valuable research assistance. An earlier version of this paper was presented at the 18th International Conference of Europeanists (CES) in Barcelona, 20–22 June 2011, and research seminars at the Hanse-Wissenschaftskolleg and the University of Sussex. I would like to thank the Hanse-Wissenschaftskolleg for providing time and an environment conducive to writing this paper. I am particularly grateful to David Rueda, Lee Savage, Uli Sedelmeier, and the anonymous reviewers for detailed and constructive comments on an earlier version of this paper.