


I. INTRODUCTION
As technology continues to permeate the basic fabric of our lives, the vision of an interconnected internet-of-things (IoT) moves closer and closer to reality. From agricultural monitoring to smart home appliances capable of detecting the clothing or groceries around them, the anticipated benefits of realizing an IoT cannot be denied. For such a system to be successfully implemented, several requirements must be met. First, devices must be wireless and have long ranges so as not to require base station nodes in close proximity. Wires limit the flexibility of sensor networks and increase the complexity of installation. Second, IoT devices must be battery free. The maintenance, cost, and ecological impact of a battery-powered IoT would prohibit use in all but the smallest of applications. Finally, a device must be low-cost. A true IoT would require billions or trillions of sensors deployed across a wide range of applications. If these devices cost more than a few cents, the economics would quickly become prohibitive. Radio-frequency identification (RFID) technology has largely become synonymous with an IoT because it is the ideal technology to fit these criteria. Passive, backscatter communication along with efficient wireless power transfer is the technological solution for realizing a true IoT.
RFID is an ultra-low-power IoT-enabler that typically has ranges greater than 10 m for commercial, passive systems operating at 900 MHz [Reference Dobkin1]. Removing the need for complicated, RF electronics means that these systems can operate with powers lower than −23 dBm [Reference Valenta and Durgin2] with data efficiencies down to 4 pJ/bit [Reference Thomas, Harrison, Leonardo and Reynolds3]. With these power requirements, batteries are no longer required and energy can be harvested from the RF base stations already used for communication. The simple electronic design implemented in standard complementary metal-oxide semiconductor (CMOS) processes also reduces the costs of such devices to less than a few cents.
Although the typical, maximum range of 10 m for passive, 900 MHz RFID systems is promising, additional costs could be reduced and more applications enabled if this range could be increased. While there are multiple methods of increasing this range both on the device itself and on the base station (see [Reference Valenta and Durgin2, Reference Valenta, Morys and Durgin4] for a detailed list), one such method is increasing the RF-to-DC conversion efficiency of the energy-harvesting circuitry. This possibility can be accomplished by adjusting the harvesting circuit parameters (which are eventually limited by semiconductor physics) [Reference Valenta and Durgin2] or using a power-optimized waveform (POW) [Reference Valenta and Durgin5]. The remainder of this paper will discuss the following: POWs and their benefits for energy-harvesting circuitry, a method for measuring POWs' impact on energy-harvesting circuitry, and laboratory measurements validated by theoretical analysis and computer simulations which demonstrate the highest reported efficiency for a 5.8 GHz energy-harvesting circuit operating at low powers when using a POW excitation signal.
II. POWS
A POW is a multi-carrier waveform whose high peak-to-average power ratio (PAPR) assists in overcoming diode losses (dominated by turn-on voltage at low-input powers) in energy-harvesting circuits. A high PAPR delivers a voltage spike when subcarriers combine in-phase and increases harvester efficiencies at low powers (typically less than 0 dBm) at the expense of bandwidth and decreased efficiency at high powers (typically greater than 0 dBm). Figure 1 shows an example POW and an equal power, single-frequency excitation imposed on a diode I–V curve. Note that in the figure, the high PAPR contains sufficient voltage levels to drive the energy-harvesting circuit at its maximum DC level of V br/2. Conversely, the continuous waveform (CW) peak voltage is insufficient so its DC level would decrease.
A POW can cause a larger DC bias across a diode for a lower average power than a single frequency CW. This figure shows an equal power POW and a CW for a set DC bias level. Note that since the CW does not have sufficient voltage to turn-on the diode, its DC bias level would decrease.

While some modulations, such as orthogonal frequency-division multiplexing (OFDM) have been shown to increase energy-harvester efficiency because of their naturally large PAPR [Reference Collado and Georgiadis6], the majority of research has focused on designing a waveform with a specific PAPR driven by energy-harvester efficiency improvement instead of communication quality. Multi-sine excitations [Reference Boaventura and Carvalho7–Reference Fernandes, Boaventura, Carvalho and Matos10], chaotic waveforms [Reference Collado and Georgiadis11], intermittent transmission [Reference Matsumoto and Takei12], and POWs [Reference Valenta and Durgin5, Reference Trotter, Griffin and Durgin13] are all examples of waveforms with high PAPRs whose goal is to increase the range of passive sensors.
A) Definitions
POWs are characterized by the number, amplitude, phase, and spacing of subcarriers, which affect their PAPR and root-mean-square (RMS) bandwidth. These parameters are typically expressed in the time domain in (1) as
 $${\rm POW}(t) = \sum\limits_{k = - \infty} ^\infty {a_k \cos (2\pi (f_c - k\Delta f)t + \Phi _k ).} $$
If cases are restricted to symmetrical spectra, (1) can be expressed as (2)
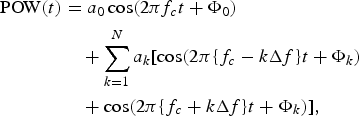 $$\eqalign{{\rm POW}(t) & = a_0 \cos (2\pi f_c t + \Phi _0 ) \cr & \quad + \sum\limits_{k = 1}^N {a_k [\cos (2\pi \{ f_c - k\Delta f\} t + \Phi _k )} \cr & \quad + \cos (2\pi \{ f_c + k\Delta f\} t + \Phi _k )],}$$
where a k is the voltage of the k th subcarrier, f c is the carrier frequency, Φk is the phase, Δf is the subcarrier spacing, and N is the number of subcarriers. Alternatively, POWs can be defined as a list of frequencies and amplitudes in the frequency domain by taking the Fourier transform of (1)
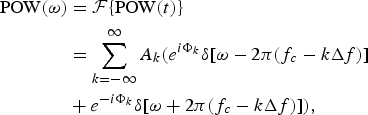 $$\eqalign{{\rm POW}(\omega ) & = {\rm \cal F}\{ {\rm POW}(t)\} \cr & = \sum\limits_{k = - \infty} ^\infty {A_k ({e^{i\Phi _k} \delta [\omega - 2\pi (f_c - k\Delta f)]}} \cr & + e^{ - i\Phi _k} \delta [\omega + 2\pi (f_c - k\Delta f)]),}$$
where A k is the power of the kth subcarrier – or more simply stated as a list of amplitudes and discrete frequencies
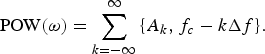 $${\rm POW}(\omega ) = \sum\limits_{k = - \infty} ^\infty {\{ A_k, f_c - k\Delta f\}.}$$
This form is often easier to implement and simply take the inverse Fourier transform to obtain the time-domain waveform.
POW gain G POW is an important metric which POWs are evaluated and is defined in (5) as
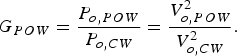 $$G_{POW} = \displaystyle{{P_{o,POW}} \over {P_{o,CW}}} = \displaystyle{{V_{o,POW}^2} \over {V_{o,CW}^2}}. $$
In this definition, P o,POW and V o,POW are the time-averaged output power and voltage, respectively, when under a POW excitation POW(t) in (1). Likewise, P o,CW and V o,CW are the time-averaged output power and voltage, respectively, when under CW excitation. This gain gives the improvement of the designed POW over a CW waveform.
Different “types” of POWs can be created by varying the number, amplitude, and spacing of the different carriers in the waveform. These variations, in turn, affect the RMS bandwidth and PAPR. These parameters can be calculated for any POW shape and have been explicitly defined for POW shapes named “M-POW,” “Gaussian POW,” and “Square POW,” for their respective shapes in the time or frequency domain as shown in Fig. 2. Additional details and equations for these POWs are discussed in [Reference Trotter, Griffin and Durgin13, Reference Trotter and Durgin14].
Three examples of POW and their parameters: From top to bottom, M-POW, Square POW, and Gaussian POW. Notice the different PAPR of each waveform along with the frequency content and shape of their respective spectra.
The design of the POW encompasses the selection of the number of subcarriers, each subcarrier amplitude and phase, and the subcarrier spacing. As the number of subcarriers increases, the PAPR also increases. This increase in PAPR has been theoretically and computationally confirmed to increase the efficiency at low powers in [Reference Valenta, Morys and Durgin4, Reference Valenta and Durgin5]. Furthermore, Valenta et al. [Reference Valenta, Morys and Durgin4] demonstrate the optimal PAPR (or number of subcarriers) when considering the reduction in maximum efficiency at high powers and the increase in sensitivity at low powers. However, in practice, the maximum number of subcarriers will be limited by the architecture of the POW transmitter. A POW provides the best increase in performance at low powers when all subcarriers arrive in-phase at the rectifier. However, the RF channel can distort subcarrier amplitudes and phases and cause the resultant POW to arrive in a non-ideal state. Channel equalization techniques, such as those presented in [Reference Arnitz and Reynolds15], can help to mitigate these problems. The question of the subcarrier spacing has been studied in [Reference Valenta and Durgin5]. The subcarrier spacing is inversely proportional to the POW duty cycle. As the subcarriers move close and close to one another in the frequency domain, the time between POW “pulses” in the time domain increases. This time increase may or may not be a problem depending on the output capacitor leakage current and load requirements. Ultimately, the total POW bandwidth should fit within the regulatory limits, and subcarrier spacing should be of the order of the output low-pass filter cutoff frequency.
III. LABORATORY MEASUREMENTS
A) Schottky diode
The Avago HSMS-2860 is a commercial off-the-shelf Schottky detector diode often used to build energy-harvesting circuits. It is readily available, low-cost, and has acceptable parameters [16] for 5.8 GHz energy-harvesting circuits. To verify the accuracy of the Avago HSMS-2860, a model complete with its SOT-23 package parasitics [17] (one diode exists in the package) was created in Agilent's Advanced Design System (ADS) 2011.10. The diode I–V curve was measured against several different batches of diodes and compared with the simulated model and data sheet supplied model as shown in Fig. 3.
Log plot of the measured, simulated, and data sheet supplied I–V curves from an Avago HSMS-2682 series diode in a SOT-23 package. This plot shows relatively good agreement between the data sheet, ADS model, and laboratory measurements around the threshold voltage, but disagreements at voltages far above, and below the threshold. Furthermore, diodes from the same batch perform similarly while diodes from different batches greatly vary.
Three main points can be discerned from the graph. First, the ADS simulation matches the diode data sheet. Second, while the diode curves agree relatively well around the turn on voltage, notable differences exist for higher and lower powers. At higher powers, parasitic resistances of the order of a couple ohms lead to a reduction in the slope of the curves. Finally, manufacturing variations between batches of diodes are apparent in these plots. While differences between each batch of diodes are evident, diodes from the same batch are relatively the same. Thus, while the ADS simulation will be used for charge-pump design, one can expect a variation in performance due to the variation in the fabrication process. Moreover, the observed difference is conducted at DC. Variations between batches at microwave frequencies will most likely be more severe.
B) POW measurement setup
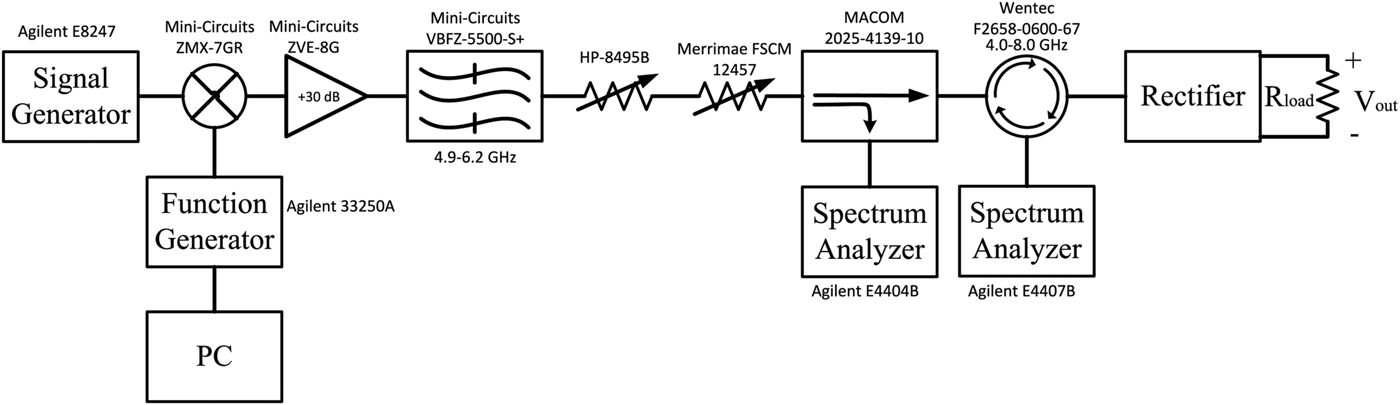
Figure 4 shows a block diagram of the constructed system to characterize circuit performance when excited by a POW. The same measurement setup was also used to verify the theoretical model in [Reference Valenta, Morys and Durgin4]. On a PC, MATLAB was used to create a baseband POW and then program an Agilent 33250A function generator with the waveform via general-purpose interface bus (GPIB). The function generator then outputted this signal to a Mini-Circuits ZMX-7GR mixer (3.7–7.0 GHz) where the POW was upconverted to 5.8 GHz before being amplified. This signal passed into a Mini-Circuits ZVE-8 G power amplifier with a gain of 30 dB. To suppress any out-of-band noise or harmonics generated by the amplifier, a Mini-Circuits VBFZ-5500-S+ bandpass filter (4.9–6.2 GHz) followed the amplifier before the signal passed through two different variable attenuators. These two attenuators allowed the measurement system to operate at a fixed, linear point on the amplifier gain curve. The first attenuator, an HP-8495B, was a step attenuator that provided 0–70 dB of attenuation in 10 dB increments. The second attenuator, a Merrimae FSCM 12457, was a rotary attenuator that provided continuous attenuation from 0 to 40 dB.
Block diagram of the system used to generate POWs and characterize their performance with energy harvesters. This system requires additional attention to ensure the signals are linear so as to not distort the POW. A similar setup was also used in [Reference Valenta, Morys and Durgin4].
To measure the true input power into the energy-harvesting circuit, an M/A-COM 2025-4139-10 coupler was used immediately after the variable attenuators. Following this, a Wentec F2658-0600-67 circulator (4.0–8.0 GHz) was placed between the coupler and the circuit under test. An Agilent E4404B spectrum analyzer was placed at the coupler −10 dB port to measure the reference signal. Reflected signals from the circuit (fundamental and harmonics) were then passed back through the circulator where they were measured by an Agilent E4407B spectrum analyzer. Finally, an Agilent DSO614A digital oscilloscope measured the signal across the load.
For POWs, it is especially important at the coupler output to verify the POW shape and signal levels as the amplifier non-linearity may cause clipping or other distortion. For this measurement setup, all harmonics and intermodulation products due to the amplification of the POW were measured to be at least 24.9 dB below the fundamental frequencies at the coupler output. Likewise, an oscilloscope is especially important to use to measure the output signal because of the presence of both DC and intermodulation products causing a ripple.
C) Low-power rectifier
A low-power rectifier was designed using a single Avago HSMS-2860 Schottky diode on a 31 mil Rogers 5880 substrate and impedance matched at −10 dBm input power and 5.8 GHz. This Avago diode was chosen because of its availability and its generally accepted characteristics for IoT energy-harvesting applications in the microwave space (appropriate low threshold voltage for low-power operation, low junction capacitance for microwave use, and sufficiently large reverse breakdown voltage for powering IC logic levels). If the goal of the energy harvester design was to focus only on energy-harvesting efficiency, then a different diode would most likely be chosen to have an even smaller threshold voltage.
An SMA provides a port to test the rectifier to allow for specific measurements not affected by antenna parameters. Next, an interdigitated capacitor (IDC) blocks dc current from leaving the rectification stage and also acts as part of a bandpass filter to reject harmonics generated by the rectification that would otherwise radiate into the environment. The remainder of the rectifier (output load, Schottky diode, and microstrip lines) uses harmonically terminated open-circuited stubs to reflect generated harmonics back into the diode to maximize efficiency.
This rectifier was optimized for maximum efficiency under CW excitation using an Agilent ADS 2011.10 momentum-controlled random optimizer using the harmonic balance method with five harmonics and three orders of mixing terms (fewer harmonics and mixing terms resulted in less accurate simulation results). Efficiency defined here is output DC power divided by input RF power. Reflected power is not subtracted from the input power as is sometimes done to describe efficiency. Only the lengths of the microstrip lines after the IDC and the output resistance were allowed to vary. Microstrip line widths were fixed at 94 mil. The IDC was separately optimized using the same simulator and has a return loss of 33.1 dB and insertion loss of 0.51 dB across the 5.8 GHz ISM band.
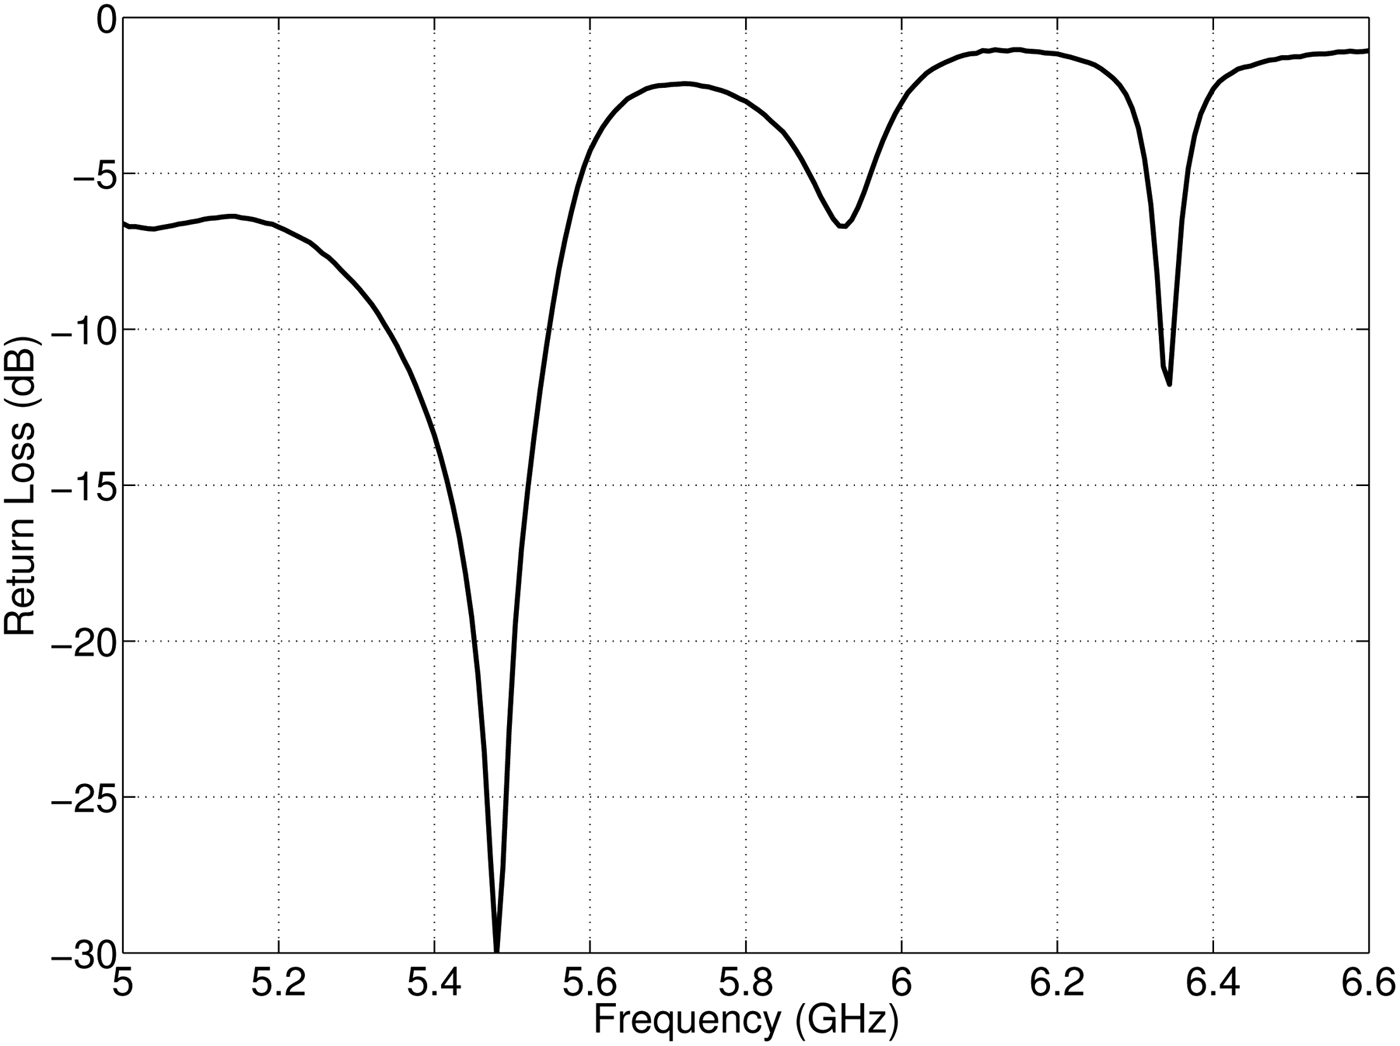
The optimized, fabricated, fully assembled rectifier is shown in Fig. 5 and has a 2200 Ω load. Its return loss is shown in Fig. 6 for an input power of −10 dBm. As shown, the rectifier has a −10 dB bandwidth of over 200 MHz centered at 5.46 GHz. This difference from the targeted 5.8 GHz is primarily attributed to variations in the diode per previous discussions.
Annotated photograph of the low-power rectifier that uses an Avago HSMS-2860 and has a load of 2200 Ω. Note the rectifier was placed on standard engineering graph paper with a grid spacing of 0.25 inch or 6.35 mm.
Measured return loss of the low-power rectifier at a power of −10 dBm. The rectifier has a bandwidth in excess of 200 MHz at a center frequency of 5.46 GHz.
Output voltage and efficiency measurements for the low-power rectifier are shown in Fig. 7 using CW, 1-POW, 2-POW, and 3-POW. M-POWs are discussed in detail in [Reference Trotter, Griffin and Durgin13]. In short, M-POWs have M equally weighted, in-phase subcarriers at RF and the signal PAPR increases with the number of subcarriers. For each of these excitation signals, a subcarrier spacing of 10 MHz was used as it permitted the total POW bandwidth to fit within the 5.8 GHz ISM band and was on the order of the low-pass filter cutoff frequency.
Measured output voltage and energy-harvester efficiency for the fabricated low-power rectifier under CW, 1-POW, 2-POW, and 3-POW excitations with a center frequency of 5.46 GHz and subcarrier spacing of 10 MHz. (a) Output voltage. (b) Efficiency.
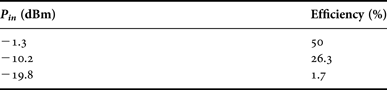
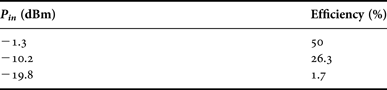
As the power decreases, higher PAPR POWs generate more power and are also more efficient than CWs. This result has also been shown by measurements in [Reference Boaventura and Carvalho7, Reference Boaventura, Collado, Georgiadis and Carvalho8, Reference Fernandes, Boaventura, Carvalho and Matos10]. Additionally, efficiency at higher powers is reduced because of additional impedance mismatch and series resistive losses as expected [Reference Valenta and Durgin5]. Also note that the breakdown voltage occurs for progressively lower powers with increasing PAPRs. Table 1 lists some of the important measured values from the low-power rectifier under 3-POW excitation taken from Fig. 7. This excitation was selected because it yielded the highest efficiencies at the lowest powers.
Summary of low-power rectifier performance under 3-POW excitation from Fig. 7.
Figures 8 and 9 compare the low-power rectifier measurements with ADS simulations and theoretical predictions developed in [Reference Valenta, Morys and Durgin4] for CW and 3-POW excitations, respectively. As stated in [Reference Valenta, Morys and Durgin4], this theoretical model provides an upper bound on energy-harvesting performance and is not intended to accurately model the performance in all cases. The model uses an idealized on/off diode model which conducts no current below the threshold voltage and series resistance-limited current above the threshold. This and other assumptions led to a close-form equation which can much more quickly model the effect of high PAPR excitations on the rectifier when compared with other methods. As a consequence of this simple model, the more complicated, non-linear behavior at low powers is not as accurate. A full discussion of the limitations of this model is included in [Reference Valenta, Morys and Durgin4].
Theoretical, simulated, and measured output voltage and energy-harvester efficiency for the fabricated low-power rectifier under CW excitation with a center frequency of 5.46 GHz. (a) Output voltage. (b) Efficiency.
Theoretical, simulated, and measured output voltage and energy-harvester efficiency for the fabricated low-power rectifier under a 3-POW excitation with a center frequency of 5.46 GHz and subcarrier spacing of 10 MHz. (a) Output voltage. (b) Efficiency.
While the basic trends appear correct in these comparisons, there is a larger difference between measurements and simulations. Additionally, measurements seem to more closely approach the theoretical maximum. This discrepancy can also be attributed to the variation in the diodes from Fig. 3. Specifically, this plot shows that for input voltages below 100 mV, the measured current is much greater than the data sheet or simulation predicts. Consequently, since the data sheet values were used for the theoretical prediction and the simulations (and are lower than the measurements), the measured output voltage and efficiency are better than the simulations. If the correct diode parameters were extracted for this batch of diodes, the theoretical curve would be shifted higher for lower powers. To obtain more accurate simulations, diode characterizations could be done by a simple I–V curve measurement, or a more complex load-pull measurement could be completed as in [Reference Hagerty18]. In this manner, simulations would more accurately predict the measured results. Keep in mind, however, that for IoT applications, cost is the primary driver. While parameter extraction may yield better results, the additional cost of custom tuning a circuit for each diode may be economically infeasible.
D) Comparison to state-of-the-art
While the previous sections have compared the measured results to theoretical limits and to computer simulations, it is useful to know how well the prototyped energy-harvesting circuit stacks up against the current state-of-the-art. To demonstrate this, the energy-harvesting efficiencies from the rectifier under CW and 3-POW were compared with a large number of efficiencies collected across literature [Reference Valenta and Durgin2].
Figure 10 shows the prototyped rectifier falls into the expected range of 5.8 GHz energy harvesters under CW excitation. However, when the rectifier is excited with a 3-POW, its efficiency surpasses the best CW-excited energy-harvesting efficiency at low powers for 5.8 GHz. It should be noted that it is possible that the other circuits in the published literature may also improve under POWs. There is no guarantee that a POW will assist an energy-harvesting circuit as shown by Trotter and Durgin [Reference Trotter and Durgin14], which showed degradation in performance. However, to the authors' knowledge, this is the most efficiency 5.8 GHz rectifying circuit ever reported that uses an excitation signal with a PAPR of 12. As measurements of energy harvesters which utilize high PAPR excitations are limited, it is still difficult to compare this result to others in published literature.
Measurements of the low-power rectifier efficiencies under CW and 3-POW excitation plotted with the state-of-the-art. Original data points are from [Reference Valenta and Durgin2].
IV. CONCLUSION
Improving wireless power transfer technology is pivotal to realizing an economically and ecologically feasible IoTs. POWs are one of many technologies which allow energy-harvesting circuits to have greatly improved efficiencies at low-power levels, extending their range and their reliability by means of a designed excitation signal with high PAPR. This paper has discussed the design and measurement of a low-power, 5.8 GHz rectifier that by using POWs has the highest reported efficiency of 26.3% at −10.2 dBm and 1.7% at −19.8 dBm for any reported microwave energy harvester of its class when using an excitation signal with a PAPR of 12.
ACKNOWLEDGEMENTS
The authors would like to thank Marcin Morys for his discussions leading to the theoretical results presented in this work. This work was funded by internal research and development funds from the Georgia Tech Research Institute, the Space Solar Power Institute, and the Southern Company. There was no conflict of interest.
Christopher R. Valenta received his BSECE and BSOE from the Rose-Hulman Institute of Technology and his MSECE and Ph.D. in ECE from Georgia Institute of Technology. In 2008, he joined “The Propagation Group” where he commercialized the first 5.8 GHz backscatter sensor system for use in high-voltage environments, developed numerous RFID-enabled sensors, and pioneered work in microwave-energy harvesting using power-optimized waveforms. In 2009, he was awarded an ATLANTIS Fellowship and participated in an 18-month research program with the Politecnico di Torino and the Technical University of Munich. Christopher has also spent time as a visiting scholar in the Sampei Laboratory at the University of Osaka. He is currently a research engineer and Shackleford Fellow at the Georgia Tech Research Institute Electro-optical Systems Laboratory where he researches microwave-energy harvesting; backscatter radio communication; RFID; ultra-low power, passive sensors; lidar systems; and software defined radio. He is on the steering committee for the IEEE Council on RFID, a frequent reviewer of journals and conference proceedings, and the winner of the 2015 IEEE Microwave Magazine Best Paper Award.
Gregory D. Durgin joined the Faculty of Georgia Tech's School of Electrical and Computer Engineering in Fall 2003. He received the BSEE (96), MSEE (98), and Ph.D. (00) degrees from Virginia Polytechnic Institute and State University. In 2001, he was awarded the Japanese Society for the Promotion of Science (JSPS) Post-doctoral Fellow and spent 1 year as a visiting researcher at Morinaga Laboratory in Osaka University. In 1998, he received the Stephen O. Rice prize (with coauthors Theodore S. Rappaport and Hao Xu) for best original journal article in the IEEE Transactions on Communications. Professor Durgin also authored Space-Time Wireless Channels, the first textbook in the field of space-time channel modeling. Professor Durgin serves on the IEEE Wave Propagation Standards Committee. He has won several teaching awards as well as the National Science Foundation CAREER research award. He serves regularly as a consultant to industry.