1. Introduction
Shocks are ubiquitous in space, astrophysical and laboratory plasmas and are characteristic of systems in which flow speeds exceed magnetohydrodynamic (MHD) wave speeds (Treumann Reference Treumann2009). In astrophysics, they are often key to understanding the properties and dynamics of a system since shock heating causes changes in the emission of the plasma which is observable remotely. Since the properties of a shock depend on the upstream conditions, observations of shocks also allow plasma parameters to be inferred (Hartigan & Wright Reference Hartigan and Wright2015). In the laboratory, such as in magneto–inertial fusion experiments, shocks naturally arise due to extreme plasma conditions. Accurately modelling these shocks is crucial to understanding the dynamics of the complex integrated systems required for fusion experiments.
In many cases, these shocks include an embedded, dynamically significant magnetic field. During the early development of MHD shock theory (Hoffmann & Teller Reference Hoffmann and Teller1950; Germain Reference Germain1960; Polovin Reference Polovin1961; Anderson Reference Anderson1963), it was established that Ohmic heating can shape shock structures. Since resistivity does not directly dissipate the plasma kinetic energy, there is a critical value of the upstream magnetosonic Mach number, $M_{{\rm MS},{\rm crit}}$ , indicating the maximum strength of MHD shocks shaped by Ohmic heating alone. Subcritical shocks (with $M_{{\rm MS}} < M_{{\rm MS},{\rm crit}}$
 ) have a supersonic, $M_{S,d}> 1$
 , but submagnetosonic, $M_{{\rm MS},d} < 1$
 , downstream flow (Marshall Reference Marshall1955; Coroniti Reference Coroniti1970) and are predicted to have a shock width equal to the resistive diffusion length, $L_{\eta }$
 (the subscript $d$
 refers to a downstream value). The absence of viscous dissipation in subcritical shocks also led to the prediction that hydrodynamic parameters should be continuous across the shock (with no mean free path (m.f.p.) scale jump). Conversely, supercritical shocks (with $M_{{\rm MS}} > M_{{\rm MS},{\rm crit}}$
 ) have a subsonic, $M_{S,d} < 1$
 , and submagnetosonic, $M_{{\rm MS},d} < 1$
 , downstream flow. These are predicted to include a viscous dissipation layer, corresponding to a discontinuous jump in hydrodynamic parameters on the scale of the m.f.p., which may be much smaller than the resistive scale (Marshall Reference Marshall1955; Liberman & Velikovich Reference Liberman and Velikovich1986).
In the astrophysical literature, the distinction between collisional subcritical and supercritical MHD shock in the weakly ionised, low-density interstellar medium (ISM) is made by labelling subcritical shocks ‘continuous’ or ‘C shocks’ and supercritical shocks ‘jump’ or ‘J shocks’ (Draine Reference Draine1980). In this case, heating is caused by ambipolar diffusion, due to a significant neutral population. More recently, in situ measurements of a shock in the very local ISM have shown the presence of a subcritical shock in which the dissipation mechanism is expected to be proton thermal conduction (Mostafavi & Zank Reference Mostafavi and Zank2018). While these dissipation mechanisms are different from Ohmic heating, the critical condition ($M_{S,d} = 1$ ) is the same as in Coroniti (Reference Coroniti1970).
The structure and propagation of magnetised shocks through dense, collisional plasmas has also gained interest in the field of magneto–inertial fusion (Slutz et al. Reference Slutz, Herrmann, Vesey, Sefkow, Sinars, Rovang, Peterson and Cuneo2010; Wurden et al. Reference Wurden, Hsu, Intrator, Grabowski, Degnan, Domonkos, Turchi, Campbell, Sinars and Herrmann2015; Perkins et al. Reference Perkins, Ho, Logan, Zimmerman, Rhodes, Strozzi, Blackfield and Hawkins2017; Gomez et al. Reference Gomez, Slutz, Jennings, Ampleford, Weis, Myers, Yager-Elorriaga, Hahn, Hansen and Harding2020; Sinars et al. Reference Sinars, Sweeney, Alexander, Ampleford, Ao, Apruzese, Aragon, Armstrong, Austin and Awe2020). This has been particularly motivated by recent results showing increased yield and anisotropic shock structure in magnetised inertial confinement fusion (ICF) capsule implosions (Moody et al. Reference Moody, Pollock, Sio, Strozzi, Ho, Walsh, Kemp, Kucheyev, Kozioziemski and Carroll2022a,Reference Moody, Pollock, Sio, Strozzi, Ho, Walsh, Kemp, Lahmann, Kucheyev and Kozioziemskib; Walsh et al. Reference Walsh, O'Neill, Chittenden, Crilly, Appelbe, Strozzi, Ho, Sio, Pollock and Divol2022). Simulations indicate that the criticality of the primary shock will depend on the ablator material for ICF capsule implosions. In magnetised liner inertial fusion (MagLIF) experiments, the preheat laser is expected to launch a weakly supercritical shock. A significant fraction of the entropy increase at weakly supercritical shocks is expected to be provided by non-viscous dissipation and characterising dissipation in MagLIF relevant conditions is an active field of research (Maron et al. Reference Maron, Starobinets, Fisher, Kroupp, Osin, Fisher, Deeney, Coverdale, Lepell and Yu2013; Yu, Velikovich & Maron Reference Yu, Velikovich and Maron2014; Davidovits & Fisch Reference Davidovits and Fisch2016, Reference Davidovits and Fisch2017, Reference Davidovits and Fisch2019; Maron Reference Maron2020). Therefore, modelling both subcritical and weakly supercritical shocks will depend on accurately capturing resistive effects. To date, the structures of MHD shocks in this regime has not been measured experimentally.
In recent years, there have been some experimental investigations of collisionless subcritical shocks (Schaeffer et al. Reference Schaeffer, Everson, Bondarenko, Clark, Constantin, Winske, Gekelman and Niemann2015; Fazzini et al. Reference Fazzini, Yao, Burdonov, Béard, Chen, Ciardi, D'Humières, Diab, Filippov and Kisyov2022). These have involved laser-driven shocks in magnetised ambient media and have focused primarily on studying reflected ions and particle acceleration. Here we take a more basic approach, studying how the plasma parameters change across and within a subcritical shock. The advantage of a collisional plasma for this investigation is that the results can be compared directly with the MHD theory since the physical processes which generate entropy at the shock are well described by collisional transport models (Braginskii Reference Braginskii1965; Epperlein & Haines Reference Epperlein and Haines1986; Davies et al. Reference Davies, Wen, Ji and Held2021; Hamilton & Seyler Reference Hamilton and Seyler2021; Sadler, Walsh & Li Reference Sadler, Walsh and Li2021; Simakov Reference Simakov2022). Furthermore, the diagnostic accessibility of our experiments as well as the ability to reliably fit Thomson scattering (TS) spectra within the shock structure mean $L_{\eta }$ can be calculated from measured parameters and compared directly with the shock width.
This paper presents a laboratory study of subcritical shock structure in a collisional plasma. The $1.4$ MA, $250$
 ns rise time current pulse at the MAGPIE pulsed power facility (Mitchell et al. Reference Mitchell, Bayley, Chittenden, Worley, Dangor, Haines and Choi1996) was used to drive the ablation of an inverse wire array z-pinch (Harvey-Thompson et al. Reference Harvey-Thompson, Lebedev, Bland, Chittenden, Hall, Marocchino, Suzuki-Vidal, Bott, Palmer and Ning2009). This produced a supermagnetosonic ($M_{{\rm MS}} \sim 1.9$
 , $M_{A} \sim 3$
 , $M_{S} \sim 2.5$
 ) plasma outflow with an embedded magnetic field. Shocks were studied by placing stationary, extended cylindrical obstacles into this flow (Burdiak et al. Reference Burdiak, Lebedev, Bland, Clayson, Hare, Suttle, Suzuki-Vidal, Garcia, Chittenden and Bott-Suzuki2017). The obstacles were oriented to produce perpendicular shocks, in which the advected magnetic field was perpendicular to the shock normal.
The experiments were diagnosed using optical self-emission imaging, laser interferometry, Faraday rotation imaging and optical TS. The experiments were analysed by comparing experimental plasma parameter profiles across the shock front and the shock width with theoretical predictions. The MHD simulations were benchmarked against the experimental results and used to perform parameter scans.
For obstacles larger than $L_{\eta }$ , it was shown in Russell et al. (Reference Russell, Burdiak, Carroll-Nellenback, Halliday, Hare, Merlini, Suttle, Valenzuela-Villaseca, Eardley and Fullalove2022) that subcritical shocks were produced by demonstrating that the downstream flow was supersonic (the defining feature of a subcritical shock). We then found agreement with the MHD theory of subcritical shocks by showing that the shock width was equal to the classical (Spitzer) resistive diffusion length (Marshall Reference Marshall1955; Coroniti Reference Coroniti1970; Liberman & Velikovich Reference Liberman and Velikovich1986). Furthermore, detailed measurements of the plasma parameters within the shock structure found the absence of a m.f.p. scale jump in hydrodynamic parameters, consistent with the MHD theory.
The aim of this paper is to investigate how the observed shock structure depends on obstacle scale. Since subcritical shocks are shaped by resistive diffusion, we expect that shock structure should change when the obstacle scale approaches the resistive diffusion length. We compare our experimental results with those in Burdiak et al. (Reference Burdiak, Lebedev, Bland, Clayson, Hare, Suttle, Suzuki-Vidal, Garcia, Chittenden and Bott-Suzuki2017) in which similar but smaller obstacles were placed into the same plasma outflow but no subcritical shocks were observed. With the support of two-dimensional (2-D) resistive MHD simulations, we infer that when the obstacles are smaller than $L_{\eta }$ the magnetic field is minimally perturbed and the plasma behaves like a hydrodynamic fluid. This property has recently been used in Datta et al. (Reference Datta, Russell, Tang, Clayson, Suttle, Chittenden, Lebedev and Hare2022a,Reference Datta, Russell, Tang, Clayson, Suttle, Chittenden, Lebedev and Hareb) to infer upstream plasma conditions from ‘B-dot’ probe measurements in which the probe was smaller than $L_{\eta }$
 but much larger than the collisional m.f.p. of the plasma.
2. Experimental design
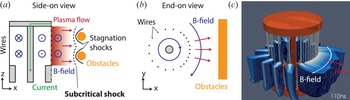
The plasma flow in these experiments was produced by the ablation of a cylindrical inverse wire array z-pinch (Harvey-Thompson et al. Reference Harvey-Thompson, Lebedev, Bland, Chittenden, Hall, Marocchino, Suzuki-Vidal, Bott, Palmer and Ning2009) driven by the MAGPIE pulsed power generator at Imperial College London (1.4 MA peak current, 250 ns rise time) (Mitchell et al. Reference Mitchell, Bayley, Chittenden, Worley, Dangor, Haines and Choi1996), see figure 1. A cylindrical arrangement of 21 aluminium wires (each with a $40\,\mathrm {\mu }{\rm m}$ diameter) surrounded a central cathode such that a $\boldsymbol {J} \times \boldsymbol {B}$
 force acted radially outwards, accelerating the plasma ablated by the wires for $\sim 500$
 ns (Lebedev et al. Reference Lebedev, Suttle, Swadling, Bennett, Bland, Burdiak, Burgess, Chittenden, Ciardi and Clemens2014). Some of the drive current passed through the ablated plasma surrounding each wire so that a dynamically significant fraction of the magnetic field was advected by the flow (Chittenden et al. Reference Chittenden, Lebedev, Oliver, Yu and Cuneo2004b). The array was 21 mm high and 20 mm in diameter. An asymmetric distribution of wires, identical to that described in Russell et al. (Reference Russell, Burdiak, Carroll-Nellenback, Halliday, Hare, Merlini, Suttle, Valenzuela-Villaseca, Eardley and Fullalove2022), was used in order to produce a smooth plasma density profile upstream of the shocks (Burdiak et al. Reference Burdiak, Lebedev, Bland, Clayson, Hare, Suttle, Suzuki-Vidal, Garcia, Chittenden and Bott-Suzuki2017). Inverse wire array z-pinches are routine tools for studying shocks at the MAGPIE facility (Lebedev et al. Reference Lebedev, Suttle, Swadling, Bennett, Bland, Burdiak, Burgess, Chittenden, Ciardi and Clemens2014; Burdiak et al. Reference Burdiak, Lebedev, Bland, Clayson, Hare, Suttle, Suzuki-Vidal, Garcia, Chittenden and Bott-Suzuki2017; Suttle et al. Reference Suttle, Burdiak, Cheung, Clayson, Halliday, Hare, Rusli, Russell, Tubman and Ciardi2020; Russell et al. Reference Russell, Burdiak, Carroll-Nellenback, Halliday, Hare, Merlini, Suttle, Valenzuela-Villaseca, Eardley and Fullalove2022). In these experiments, the plasma was accelerated to ${\sim }50\,{\rm km}\,{\rm s}^{-1}$
 producing a supersonic ($M_{S} = 2.5$
 ), super-Alfvénic ($M_{A} = 3$
 ) flow with a magnetosonic Mach number $M_{{\rm MS}} = 1.9$
 .
Cross-sectional diagram of the wire array and obstacles. (a) Side-on view. The cylindrical obstacles extend into the page. The black curves indicate where the shocks formed in the experiment. (b) End-on view showing the asymmetric azimuthal configuration of wires in the array. (c) Three-dimensional (3-D) Gorgon MHD simulation density slide of an ablating wire array 110 ns after current start.

Two cylindrical obstacles were placed 10 mm from the ablating wires and were oriented with their axes parallel to the advected magnetic field. The obstacles were brass rods and each had a diameter of 4 mm (the magnetic skin depth of the obstacles was significantly smaller than this, $\delta _{s} \sim 0.1\, {\rm mm}$ , so magnetic field advected by the flow could not penetrate into the obstacles). The obstacles had a centre-to-centre separation of 9 mm in the vertical ($z$
 ) direction and were 40 mm in length. The obstacles produced shocks in the plasma flow, which were extended in the $y$
 direction and approximately stationary in the laboratory frame.
The structure and dynamics of the shocks were diagnosed using laser interferometry, optical self-emission imaging, collective optical TS and Faraday rotation imaging (Swadling et al. Reference Swadling, Lebedev, Hall, Patankar, Stewart, Smith, Harvey-Thompson, Burdiak, Grouchy and Skidmore2014). The optical self-emission camera captured 12 images with an interframe separation of 20–40 ns, each with a 5 ns exposure, allowing the temporal evolution of the shock structures to be recorded in a single experiment. Laser interferometry (532 nm, 10 mJ, 0.5 ns full width at half maximum (FWHM)) was used to measure the line integrated electron density ($\int n_{e}\,{\rm d}l$ ), from which a line averaged $n_{e}$
 could be calculated.
Thomson scattering (532 nm, 2 J, 8 ns FWHM) observing the ion acoustic feature provided measurements of the $x$ –$y$
 component of the velocity, $v_{{\rm flow}}$
 , the ion temperature, $T_{i}$
 , and the product of the average ionisation and the electron temperature, $\bar {Z}T_{e}$
 . Two linear arrays of 14 optical fibres collected the scattered spectra from the same set of 14 scattering volumes at two scattering angles in the $x$
 –$y$
 plane. The electron density measured by interferometry was used to constrain spectral fitting.
Faraday rotation imaging measured the rotation angle $\alpha$ of a linearly polarised laser beam (1053 nm, 1 J, 1 ns FWHM) due to the Faraday effect $\alpha (x,z) \propto \int n_{e}(x,y,z)\boldsymbol {B} (x,y,z) \,{\rm d}\boldsymbol {y}$
 . Inline interferometry allowed calculation of the line averaged, electron density weighted magnetic field.
3. Results and discussion
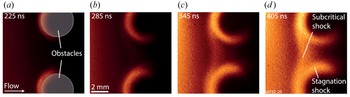
Optical self-emission. Figure 2 shows an optical self-emission time series recorded in a single experiment. The wire array is outside of the field of view on the left-hand side. The first two frames show emission where the plasma collided with the front surface of the obstacles. This interaction formed a shock at each obstacle which we refer to as a stagnation shock. A single subcritical shock formed ${\sim }300$ ns after current start at a distance ${\sim }d_{i}$
 from the obstacles and can be seen at 345 and 405 ns (Lebedev et al. Reference Lebedev, Suttle, Swadling, Bennett, Bland, Burdiak, Burgess, Chittenden, Ciardi and Clemens2014; Burdiak et al. Reference Burdiak, Lebedev, Bland, Clayson, Hare, Suttle, Suzuki-Vidal, Garcia, Chittenden and Bott-Suzuki2017). We note that the subcritical shock did not emerge from a shock reflection geometry as might be expected in this experimental configuration (see simulation results in Hansen et al. (Reference Hansen, Frank, Hartigan and Yirak2015), Hartigan et al. (Reference Hartigan, Foster, Frank, Hansen, Yirak, Liao, Graham, Wilde, Blue and Martinez2016) and Hansen et al. (Reference Hansen, Frank, Hartigan and Lebedev2017)). In the following discussion, we focus on the shock morphology $\sim 400$
 ns after current start, when the subcritical shock is already well formed.
Optical self-emission images. Comparison with interferometry data has shown that self-emission intensity is well correlated with plasma density in this regime.

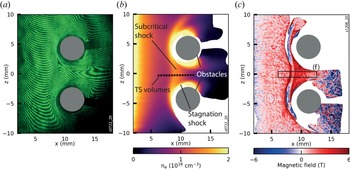
Interferometry. Figure 3 shows interferometry and Faraday rotation data. The interferogram shown in figure 3(a) was recorded 426 ns after current start. Fringe displacement with respect to the background fringes (not shown) is proportional to the line integrated electron density. A typical electron density of $10^{18}\,{\rm cm}^{-3}$ corresponds to a fringe displacement of 10 fringes. The edge of the wire array is at $x = 0\, {\rm mm}$
 . The interferograms were analysed using the method described in Swadling et al. (Reference Swadling, Lebedev, Niasse, Chittenden, Hall, Suzuki-Vidal, Burdiak, Harvey-Thompson, Bland and Grouchy2013) and Hare et al. (Reference Hare, MacDonald, Bland, Dranczewski, Halliday, Lebedev, Suttle, Tubman and Rozmus2019) to produce 2-D images of $\int n_{e}\,{\rm d}l$
 . The extended cylindrical obstacles allowed the assumption $n_{e} \approx \int n_{e} \,{\rm d}l /L$
 to be made and a characteristic value $L$
 (in this case $L = 40\, {\rm mm} =$
 the length of the obstacles) was chosen to calculate $n_{e}$
 . This has been shown to be consistent with end-on (parallel to $z$
 ) interferometry measurements of the same experiments (Russell Reference Russell2021) and represents a good approximation to the electron density close to $y = 0\, {\rm mm}$
 . The choice of $L$
 as a constant neglects the effect of radial divergence of the flow in the $x$
 –$y$
 plane, however, we estimate the error caused by this to be small when comparing density values in the range $x = 6\unicode{x2013}12\, {\rm mm}$
 as is done here.
Experimental data. (a) Raw interferogram recorded $426$ ns after current start. The edge of the wire array was defined as $x = 0\, {\rm mm}$
 . (b) Processed electron density map from (a). (c) Faraday rotation data $397$
 ns after current start in a different shot under nominally identical conditions.

The processed electron density plot is shown in figure 3(b). The electron density was highest close to the wire array on the left-hand side of the image and fell with distance from the array, reaching ${\sim }8.5 \times 10^{17}\,{\rm cm}^{-3}$ directly upstream of the obstacles (see table 1 for characteristic upstream parameters). It is clear from these data that the subcritical shock was separate and different from the stagnation shocks. The subcritical shock was smooth and continuous between the obstacles. The stagnation shocks did not reach each other in the midplane ($z = 0\, {\rm mm}$
 ). They formed close to the obstacles and caused a more abrupt density increase than the subcritical shock. Importantly, they did not propagate upstream to reach the position of the subcritical shock for the entire duration of the experiment.
Characteristic parameters of the aluminium flow directly upstream of the subcritical shock ${\sim }400$ ns after current start. Here $\beta _{{\rm th}} = P_{{\rm th}}/P_{{\rm mag}}$
 and $\beta _{{\rm ram}} = P_{{\rm ram}}/P_{{\rm mag}}$
 . To evaluate the magnetic Reynolds number, a scale length of $10\, {\rm mm}$
 , the distance between the wire array and the obstacles, gave $Re_{M} \sim 10$
 while a distance of $1\, {\rm mm}$
 gave $Re_{M} \sim 1$
 .

Faraday rotation imaging. Magnetic field measurements using Faraday rotation imaging are shown in figure 3(c). The diagnostic is described in Swadling et al. (Reference Swadling, Lebedev, Hall, Patankar, Stewart, Smith, Harvey-Thompson, Burdiak, Grouchy and Skidmore2014) and the analysis in Russell (Reference Russell2021). The measurement is sensitive to the line averaged, electron density weighted $B_{y}$ component of the magnetic field. This was the dominant component in the shock region, however, we expect some curvature of the magnetic field due to the cylindrical structure of the wire array. Therefore, Faraday rotation imaging provides a lower bound for $B_{y}$
 at $y=0\, {\rm mm}$
 (the $y=0$
 plane was defined as the plane which bisects the obstacles). The 3-D MHD simulations using the Gorgon code suggest that Faraday rotation will underestimate $B_{y}$
 by up to a factor 1.3 (Russell et al. Reference Russell, Burdiak, Carroll-Nellenback, Halliday, Hare, Merlini, Suttle, Valenzuela-Villaseca, Eardley and Fullalove2022).
In the region between the obstacles, the magnetic field increased from $1.5\unicode{x2013}2$ T upstream of the subcritical shock to $3\unicode{x2013}4$
 T in the downstream, showing that magnetic field was compressed across this shock. Redistribution of the laser intensity caused by refraction at density gradients (shadowgraphy) lead to an intensity modulation at the subcritical shock ramp so magnetic field cannot be inferred inside the subcritical shock.
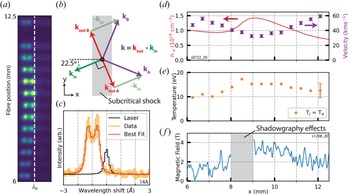
Optical TS. We performed TS measurements of the ion acoustic feature in the collective regime (Swadling et al. Reference Swadling, Lebedev, Hall, Patankar, Stewart, Smith, Harvey-Thompson, Burdiak, Grouchy and Skidmore2014; Suttle et al. Reference Suttle, Hare, Halliday, Merlini, Russell, Tubman, Valenzuela-Villaseca, Rozmus, Bruulsema and Lebedev2021). The laser entered the experimental chamber in the $x$ –$y$
 plane and was focused to a beam waist of ${\sim }200\,\mathrm {\mu }{\rm m}$
 between the two obstacles. The scattered light was imaged onto two separate arrays of 14 optical fibres at ${\pm }90 ^{\circ }$
 to the laser beam in the $x\unicode{x2013}y$
 plane, which recorded the scattered spectra from the same 14 plasma volumes shown approximately to scale in figure 3(b). The spacing and location of the 14 scattering volumes was chosen so that data were collected upstream and downstream of the subcritical shock in a single shot and multiple volumes lay within the shock transition. The resulting scattering vector diagram is shown in figure 4(b). The electron density measured by interferometry was used to constrain fitting. Then $\bar {Z}$
 and $T_{e}$
 were determined from the experimentally measured $\bar {Z}T_{e}$
 using the non-local thermodynamic equilibrium atomic code SpK (Niasse Reference Niasse2011; Hare Reference Hare2017; Crilly et al. Reference Crilly, Niasse, Fraser, Chapman, McLean, Rose and Chittenden2023). Figure 4(c) shows an example spectrum collected in the upstream plasma by a single fibre.
The TS data and plasma parameter profiles. (a) Raw spectrogram showing the scattered light collected by one of the two arrays of 14 optical fibres. (b) Thomson scattering vector diagram. $k_{{\rm in}}$ denotes the incoming laser and the scattered spectra were collected at $k_{{\rm out}\, A,B}$
 giving resultant scattering vectors $k_{A}$
 and $k_{B}$
 . (c) Example upstream spectrum. The data are shown in orange and the best fit in red. The response of the spectrometer to the unscattered laser is shown in black. (d) Flow velocity profile at $416$
 ns with electron density lineout. (e) Temperature at $416$
 ns. (f) Magnetic field profile sampled from box (f) in figure 3(c).

The flow velocity (obtained from the Doppler shift of the scattered spectra) and ion and electron temperatures obtained from the 14 TS volumes shown in figure 3(b) are shown in figure 4(d,e). The flow velocity decreased across the subcritical shock and was approximately proportional to the inverse of the electron density profile (red, obtained from interferometry across the same spatial range) so that $[\rho v] = 0$ across this spatial range. The ion and electron temperatures were equal across the shock and changed by less than 10 eV ($T = T_{e} = T_{i}$
 is presented in figure 4e).
3.1. Parameters of the upstream flow
The structure of a shock depends on the upstream flow parameters and the obstacle/flow which causes the shock. We therefore characterised the upstream flow in order to understand the shock structure. By combined analysis of interferometry, Faraday rotation and TS data, we used a characteristic set of upstream parameters to calculate relevant dimensionless numbers. These were evaluated in the reference frame of the subcritical shock, which had a constant velocity of $-3.7 \pm 1.9\,{\rm km}\,{\rm s}^{-1}$ along $x$
 (measured using optical self-emission images).
Characteristic parameters and dimensionless numbers are presented in table 1. The thermal and magnetic pressures differ only slightly, while the ram pressure is substantially larger. The flow is supersonic, super-Alfvénic and supermagnetosonic so would be expected to form a shock when colliding with stationary obstacles. The critical Mach number (which depends on $\beta _{{\rm th}}$ and the shock angle) for these upstream parameters is $M_{{\rm MS},{\rm crit}} \sim 1.4$
 (figure 4 in Edmiston & Kennel (Reference Edmiston and Kennel1984)). Here $M_{{\rm MS}} \sim 1.9 > 1.4$
 suggests that the flow is supercritical. However, we note that only a small increase in magnetic field, to $2.2$
 T, would result in $\beta _{{\rm th}} = 1$
 and $M_{{\rm MS}} \sim M_{{\rm MS},{\rm crit}} \sim 1.7$
 . Since $2.2$
 T lies within the range that could be accounted for by curvature of magnetic field lines ($1.3 \times 1.75$
 T), we do not have the experimental precision to predict the criticality of the resulting shock. The large Reynolds number means viscous dissipation will occur on scales much smaller than the system size. However, the modest value of $Re_{M}$
 shows that while magnetic field is expected to be advected in the upstream, magnetic diffusion will become important on the spatial scale of the shocks.
3.2. Subcritical shock
We first show that the subcritical shock is (a) a shock and (b) subcritical. This can be done by comparing the flow velocity with the MHD wave speeds in the reference frame of the shock. A defining feature of a fast magnetosonic shock is that the flow transitions from supermagnetosonic to submagnetosonic across the shock. The defining feature of a subcritical shock is that the flow remains supersonic. Figure 5 shows that both criteria are met in this experiment. Behind the subcritical shock, the flow expands into the vacuum and becomes supermagnetosonic again.
The flow velocity compared with the sound speed, Alfvén speed and fast-magnetosonic speed across the subcritical shock. Values which depend on $B$ are excluded for $x = 8\unicode{x2013}9\, {\rm mm}$
 since the Faraday rotation measurements were affected by shadowgraphy. The flow becomes submagnetosonic but remains supersonic across the subcritical shock.

The compression ratio, $R$ , at the subcritical shock was estimated using electron density measurements. The peak compressed density ($x = 9\, {\rm mm}$
 in figure 4c) was compared with the density at the same $x$
 location in an experiment without obstacles (null shot). Averaged over six shots this gave $R = 2.7 \pm 0.8$
 . This can be compared with the compression ratio derived from the Rankine–Hugoniot (RH) relations (equation (6) in Hartigan (Reference Hartigan2003)). However, for partially ionised aluminium, determining the effective adiabatic index $\gamma$
 which should be used is difficult since energy may be used to further ionise rather than heat the plasma (Swadling et al. Reference Swadling, Lebedev, Niasse, Chittenden, Hall, Suzuki-Vidal, Burdiak, Harvey-Thompson, Bland and Grouchy2013; Burdiak et al. Reference Burdiak, Lebedev, Bland, Clayson, Hare, Suttle, Suzuki-Vidal, Garcia, Chittenden and Bott-Suzuki2017; Drake Reference Drake2018). Figure 6 shows that $R$
 is a poor metric for comparing the experiment with the RH relations since agreement can be found for a large range of parameters. This analysis method is more applicable for fully ionised, high-$\beta$
 , high Mach number flows where a shock compression $R = 4$
 is expected (e.g. Fiuza et al. Reference Fiuza, Swadling, Grassi, Rinderknecht, Higginson, Ryutov, Bruulsema, Drake, Funk and Glenzer2020).
The ideal MHD compression ratio, $R$ , for the characteristic upstream values of $n_{e}$
 and $T$
 as a function of upstream $B$
 for a range of $\gamma$
 . The Alfvénic Mach number and $\beta _{{\rm th}}$
 are also shown. The grey box indicates the measured range of parameters.

The shock width was defined as the distance between $10\,\%$ and $90\,\%$
 of the density jump at the subcritical shock and was evaluated using electron density measurements as $\varDelta _{{\rm shock}} = 0.87 \pm 0.08\, {\rm mm}$
 . Analysis of the shock width and internal structure goes beyond the RH relations. The RH relations treat a shock as a discontinuity and can only be applied on scales much larger than the largest dissipative scale. Shock theory states that the width of a shock is determined by the dissipative and/or dispersive processes which increase entropy and transport energy at the shock front (Kennel, Edmiston & Hada Reference Kennel, Edmiston and Hada1985). Table 2 shows a comparison of the measured shock width with relevant characteristic length scales of the upstream plasma (evaluated using table 1).
Comparison of the measured shock width with characteristic plasma scale lengths (Russell et al. Reference Russell, Burdiak, Carroll-Nellenback, Halliday, Hare, Merlini, Suttle, Valenzuela-Villaseca, Eardley and Fullalove2022).

The ion–ion mean free path, the characteristic length scale for viscous dissipation, is ${\sim }4$ orders of magnitude smaller than $\varDelta _{{\rm shock}}$
 . This is substantially smaller than our diagnostic resolution, $\sim 0.05\, {\rm mm}$
 . However, since the shock width was well resolved, we conclude that viscous dissipation did not shape the shock. This is consistent with theory, and experimentally confirms the absence of a m.f.p. scale jump in hydrodynamic parameters at a subcritical shock for the first time.
The ion gyroradius is comparable to the shock width. However, the ions were unmagnetised in these experiments ($\omega _{i}\tau \sim 10^{-4}$ ) so we do not expect this to be a relevant parameter. This leaves three lengths scales which are comparable to $\varDelta _{{\rm shock}}$
 . These are the characteristic length scales for Ohmic heating ($L_{\eta }$
 ), electron heat conduction ($L_{\chi }$
 ) and the formation of a cross shock potential due to two-fluid effects ($d_{i}$
 ).
The two dissipative scales are $L_{\eta }$ and $L_{\chi }$
 . The contribution of electron heat conduction to shock shaping will be less than that of Ohmic dissipation since $L_{\eta } \sim 5 \times L_{\chi }$
 in the upstream and $L_{\eta } > L_{\chi }$
 across the entire subcritical shock. Furthermore, since $L_{\eta } \sim \varDelta _{{\rm shock}}$
 , the shock structure can be described by classical (Spitzer) resistive MHD only. This is supported by MHD simulations, see § 4, in which turning off thermal conduction did not affect the shock structure. Two-fluid effects may also contribute to shock structure since $d_{i}$
 is also approximately equal to the shock width. The formation of a cross-shock potential due to two-fluid separation is common in collisionless plasmas (Treumann Reference Treumann2009; Burgess & Scholer Reference Burgess and Scholer2015). This is a dispersive process and does not dissipate kinetic energy. Rather, it excites waves which carry energy away from the shock front. Since the dispersive scale, $d_{i}$
 , is approximately equal to the largest dissipative scale, $L_{\eta }$
 , this energy will be quickly dissipated and will not result in oscillations typical of collisionless shock structures. This suggests that Ohmic dissipation plays the most significant role in shock shaping. This experiment is the first to confirm the theoretically predicted equality between the shock width and $L_{\eta }$
 in the laboratory.
Given the large separation between the shock width and the viscous dissipation scale, it is not surprising that there was little heating across the shock. The compression is slow and smooth on the collisional scale. We estimate the heating due to adiabatic compression by calculating $T_{2} = T_{1} \times R^{\gamma -1} = 23 \pm 3\, {\rm eV}$ for $\gamma = 5/3$
 . Ohmic heating will also increase the temperature and the heating power per unit volume can be estimated by

where $\eta$ is the Spitzer resistivity and $\boldsymbol {\nabla } \times B \approx \Delta B_{y}/\Delta x \approx 2\, {\rm T}/1\, {\rm mm}$
 . This gives an increase in electron temperature of ${\sim }20$
 eV at the subcritical shock (assuming a velocity of $40\,{\rm km}\,{\rm s}^{-1}$
 ). However, the radiative cooling time for these plasma parameters (${\sim }10$
 ns) is less than the time the plasma took to cross the shock (${\sim }25$
 ns) so radiative cooling will substantially reduce the observed temperature change. The radiative cooling time is given by

where $\varLambda (n_{i}, T_{e})$ is the normalised cooling rate (Sutherland & Dopita Reference Sutherland and Dopita1993; Ryutov et al. Reference Ryutov, Drake, Kane, Liang, Remington and Wood-Vasey1999). The atomic code ABAKO/RAPCAL has been used to calculate $\varLambda (n_{i}, T_{e})$
 for aluminium under conditions relevant for these experiments (Espinosa et al. Reference Espinosa, Gil, Rodriguez, Rubiano, Mendoza, Martel, Minguez, Suzuki-Vidal, Lebedev and Swadling2015; Suzuki-Vidal et al. Reference Suzuki-Vidal, Lebedev, Ciardi, Pickworth, Rodriguez, Gil, Espinosa, Hartigan, Swadling and Skidmore2015). We use the same cooling rates here to estimate the cooling time for these experiments. The estimated heating rate due to compression and Ohmic heating is ${\sim }40\,{\rm eV}/25\,{\rm ns} = 1.6\,{\rm eV}\,{\rm ns}^{-1}$
 . Balancing this against $\varLambda (n_{i}, T_{e})$
 requires an electron temperature of ${\sim }15$
 eV, in good agreement with the experimental results.
3.3. Stagnation shocks
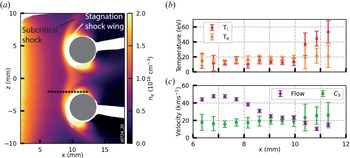
The stagnation shock wings formed downstream of the subcritical shock and remained approximately stationary for the duration of the experiment, causing a more sudden electron density change than the subcritical shock. To study the stagnation shocks in more detail, further TS data were collected closer to one of the obstacles so that the collection volumes crossed both the subcritical and the stagnation shocks. The locations of the 14 scattering volumes are shown in figure 7(a) and the size of the markers is approximately to scale.
The TS measurements at $z = -2\, {\rm mm}$ . (a) Electron density map with the locations of the scattering volumes superimposed. (b) The measured ion and electron temperatures. (c) The measured flow velocity and sound speed ($V_{A}$
 and $V_{{\rm MS}}$
 are not included since we do not have magnetic field measurements in this region).

Figure 7(b,c) show the measured temperature and velocity. Upstream of the stagnation shock, the data are consistent with the measurement made at $z = 0\, {\rm mm}$ . However, at the stagnation shock the ion temperature increases substantially and the flow becomes subsonic. This is characteristic of shocks in which viscous dissipation dominates, such as shocks in hydrodynamic fluids, since viscous dissipation converts directed kinetic energy into ion thermal energy. For hydrodynamic shocks the shock width is expected to be $\lambda _{i,i}$
 . This is below the resolution of the interferometer but is consistent with the measurements which are resolution limited.
The observation that the stagnation shocks remained downstream of the subcritical shock also indicates that the stagnation shocks are hydrodynamic-like. The relevant Mach number for hydrodynamic shocks is $M_{S}$ , which remains larger than unity across the subcritical shock. Therefore, hydrodynamic shocks should remain downstream of a subcritical shock since hydrodynamic pressure waves cannot reach a subcritical shock from the downstream. In the one-dimensional (1-D) case, we expect the gap between a subcritical shock and a hydrodynamic shock to grow with time since the subcritical shock should travel faster than the hydrodynamic shock. However, in this quasi-2-D experiment the shocks are bow shocks, each having a fixed stand-off distance from the obstacles, since plasma can flow around the obstacles. The observation of hydrodynamic shocks in the downstream of a subcritical shock is novel and was not discussed in the theory. We are, as yet, unsure if this is unique to collisional plasmas, in which $\lambda _{i,i} \ll L_{\eta }$
 , or whether similar phenomena may also occur in collisionless plasmas.
Absorption of the Faraday rotation probe laser prevented measurement of the magnetic field behind the stagnation shocks. Since we infer that the density at the stagnation shocks increases on the viscous scale, we expect the magnetic field to decouple and remain constant across the stagnation shocks. This is because the resistive diffusion length is substantially larger than the viscous scale ($L_{\eta } \sim 1\, {\rm mm}$ in the stagnation shock wings). Figure 8 shows a diagram of the inferred current paths in this shock system. Current must flow through the subcritical shock in order to produce the observed increase in magnetic field and provide the Ohmic dissipation required to sustain the shock. Current must also flow inside the obstacles to prevent the magnetic field from penetrating. The direction of current in the stagnation shocks is unclear. However, the total current in the stagnation shock layers will be small compared with that in the subcritical shocks and obstacles because we infer that they are much narrower.
The observed shock structure and inferred current paths through the subcritical shocks and obstacles.

3.4. Scale dependence
The dependence of the observed shock structure on obstacle size was studied by comparing the above experiments with results from Burdiak et al. (Reference Burdiak, Lebedev, Bland, Clayson, Hare, Suttle, Suzuki-Vidal, Garcia, Chittenden and Bott-Suzuki2017) in which smaller obstacles were used. These experiments were also carried out at the MAGPIE facility using the same wire array but the obstacles were $0.5\, {\rm mm}$ diameter cylinders.
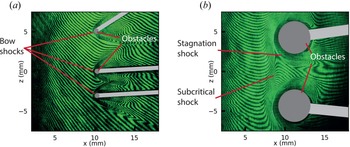
Figure 9 shows a comparison of $0.5\, {\rm mm}$ and $4\, {\rm mm}$
 diameter obstacles in the same plasma outflow. Bow shocks formed around each obstacle. In the small obstacle case, these corresponded to abrupt density jumps and had a stand-off distance $\leq 0.5\, {\rm mm}$
 . This is consistent with the morphology of the stagnation shocks in the large obstacles experiment. This suggests that for the smaller obstacles, the stagnation shocks are present but the subcritical shock is not.
Comparison of (a) 0.5 mm and (b) 4 mm diameter conductive obstacles in the same plasma flow. Raw interferograms are compared since the sharp density gradients in (a) prevent density measurements. In both images, the 40 mm long obstacles are extended into the page. The obstacle supports (light grey) are positioned at $y = \pm 20\, {\rm mm}$ where they block the side on view but do not disturb the plasma.

This can be explained by comparing the obstacle diameter with $L_{\eta } \sim 0.75\, {\rm mm}$ . At spatial scales larger than $L_{\eta }$
 the plasma is primarily advective since $Re_{M} > 1$
 . This is the case for the large obstacles and the subcritical shock forms to direct the fluid and field around the obstacles. Below $L_{\eta }$
 diffusion dominates. Therefore, the collisional fluid forms a hydrodynamic-like shock around the obstacles while the magnetic field remains minimally perturbed. The implications of this finding have already been published in Datta et al. (Reference Datta, Russell, Tang, Clayson, Suttle, Chittenden, Lebedev and Hare2022a,Reference Datta, Russell, Tang, Clayson, Suttle, Chittenden, Lebedev and Hareb) for the use of small inductive probes in a collisional plasma.
4. Numerical Simulations
Two-dimensional resistive MHD simulations were carried out to further investigate the shaping of subcritical shocks and test our interpretations of the experimental results. Firstly, the Gorgon code (Chittenden et al. Reference Chittenden, Lebedev, Jennings, Bland and Ciardi2004a; Ciardi et al. Reference Ciardi, Lebedev, Frank, Blackman, Chittenden, Jennings, Ampleford, Bland, Bott and Rapley2007) was used to carry out matched simulations of the experimental set-up. Then, a simplified model using the AstroBEAR code (Cunningham et al. Reference Cunningham, Frank, Varnière, Mitran and Jones2009; Carroll-Nellenback et al. Reference Carroll-Nellenback, Shroyer, Frank and Ding2013) was used to investigate the experimentally observed scale dependence presented in § 3.4.
4.1. Gorgon simulations
The Gorgon code uses magnetised resistivity and thermal conductivity coefficients based on the Epperlein–Haines model (Epperlein & Haines Reference Epperlein and Haines1986) and implemented an optically thin radiative recombination model. A plasma flow was injected from the left-hand boundary at a rate determined by the ablation rocket model (Lebedev et al. Reference Lebedev, Beg, Bland, Chittenden, Dangor, Haines, Kwek, Pikuz and Shelkovenko2001) and was accelerated by the experimentally measured current waveform. Initially, the ablation velocity used to determine the mass injection rate at the simulation edge was adjusted so that the parameters directly upstream of the shock matched the experiment (i.e. the simulation parameters upstream of the obstacles matched those in table 1). Then, the magnetic field at the injection point was adjusted until the location of the shock at 400 ns matched the experiment.
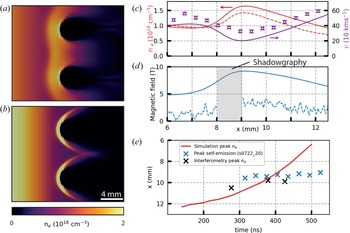
This method produced a subcritical shock structure in which the density and temperature matched the experiment well at 400 ns. Furthermore, the shock width, 1.0 mm, was comparable to $L_{\eta,{\rm sim}} = 0.66\, {\rm mm}$ . However, the magnetic field required to produce this shock structure was 4.8 T directly upstream of the shock. This is significantly larger than that observed in the experiment, even when accounting for the potential underestimation by up to a factor 1.3 of $B_{y}$
 by the Faraday rotation diagnostic discussed in § 3. Figure 10(a) compares the 4.8 T case with figure 10(b) a simulation in which we also match the experimental B field (1.75 T directly upstream of the obstacles). Figure 10(c,d) compare the experimental results with the simulation in figure 10(a). It is clear that the larger field was required to reproduce the experimentally observed morphology (shock width, position at 400 ns and 2-D shape). In the matched B field case, neither the shock structure nor the shock width are reproduced.
Simulation results at 400 ns. (a) Matched shock position with $B_{u} = 4.8$ T; (b) matched $B_{u}$
 . (c,d) Comparison of simulated parameters, in the midplane between the obstacles, at 400 ns (solid lines) with the experimental parameters presented in figure 4 (data points and dashed lines). There is good agreement for $n_{e}$
 , $v$
 and $T_{e,i}$
 (not shown), but not for $B$
 . (e) Position versus time data in the midplane. The maximum electron density in the simulation is compared with the maximum experimental electron density (from different shots) and the peak optical self-emission intensity (from a single shot). Optical self-emission images were recorded with a 30 ns interframe spacing and a 5 ns exposure along the same line of sight as the interferometry.

The simulation magnetic field is inconsistent with the experimental observations, so the discrepancy cannot be explained by a simple error in measuring the magnetic field. In the experiment, the total pressure ($P_{{\rm th}} + P_{{\rm mag}} + P_{{\rm ram}}$ ) is conserved across the shock in the shock frame. This is as expected. However, if in the experimental pressure balance calculation, the value of B is taken from the simulation, pressure is no longer conserved. In the simulation, the total pressure is also balanced in the shock frame but this is because the shock has a much larger velocity in the laboratory frame, see discussion below.
The difference between the simulation and experiment can be understood by considering the time history of the subcritical shock, see figure 10(e). In the experiment, the subcritical shock started to form at approximately $d_{i}$ from the obstacles, 300 ns after current start, and remained approximately stationary (Burdiak et al. Reference Burdiak, Lebedev, Bland, Clayson, Hare, Suttle, Suzuki-Vidal, Garcia, Chittenden and Bott-Suzuki2017). The time varying current in the wire array means that at early time $d_{i} \gg L_{\eta }$
 , with $d_{i} = L_{\eta }$
 occurring approximately when the subcritical shock was first observed and $d_{i} < L_{\eta }$
 thereafter (see figure 10b in Burdiak et al. (Reference Burdiak, Lebedev, Bland, Clayson, Hare, Suttle, Suzuki-Vidal, Garcia, Chittenden and Bott-Suzuki2017)). This suggests that the formation and initial position of the subcritical shock were determined by two-fluid physics.
Two-fluid effects were not included in the MHD simulations, so the shocks formed closer to the obstacles. Including a larger magnetic field in the simulations made the plasma less compressible so the shock moved away from the obstacles and matched the experiment at 400 ns. However, the additional magnetic pressure meant the shock continued to move, with a velocity of $-22.5\,{\rm km}\,{\rm s}^{-1}$ at 400 ns, so that the shock shape and position were only matched at a single time. This can clearly be seen in figure 10(e). The result is that by using an increased magnetic field to account for the absence of two-fluid physics in the simulation, we have been able to match the majority of the experimental parameters at a fixed time, but have been unable to match the evolution of the shock position.
This discrepancy demonstrates a clear limitation of applying MHD simulations to study these experiments. However, we note that when a subcritical shock was formed in the simulations, as in figure 10(a), the shape and morphology were well matched to the experiment. Furthermore, while we believe two-fluid effects were important in establishing the subcritical shock in the experiments, by 400 ns $d_{i} < L_{\eta }$ so we expect the shock to be sustained primarily by Ohmic heating. Since $L_{\eta }$
 does not depend on B, our conclusion that the simulations support our experimental finding that the shock width is approximately equal to $L_{\eta }$
 seems to be robust.
4.2. Investigating scale dependence numerically
We showed in § 3.4 that a subcritical shock was not formed by obstacles smaller than $L_{\eta }$ . Our interpretation of this result is that the magnetic field was minimally perturbed by the small obstacles, because the plasma is predominantly diffusive at this scale. However, since the plasma fluid is collisional, it must form collisional, hydrodynamic-like shocks in response to the presence of the obstacles. The hydrodynamic-like shocks themselves are narrow and localised, meaning they also do not significantly perturb the magnetic field. The result is a hydrodynamic-like interaction between the plasma fluid and the obstacles while the magnetic field remains smooth.
The change in shock morphology between different obstacle sizes is not a result of any changes in the upstream plasma conditions. The experiments were repeatably carried out using the same plasma source. Furthermore, the subcritical shocks and the hydrodynamic shocks had the same velocity in the laboratory frame, so the upstream shock conditions were identical in both shock frames. Therefore, the change in morphology must be a result of the change in scale.
To investigate the scale dependence numerically, a simplified model of the experimental set-up was simulated using the AstroBEAR code, an adaptive mesh refinement (AMR) MHD code which includes resistivity and radiative loss. As with the Gorgon simulations, a plasma flow was injected from the left-hand side and the three remaining boundaries were zero gradient boundaries. Two levels of AMR gave an effective resolution of $0.125\, {\rm mm}$ . Radiative cooling was implemented by using the lookup table for aluminium presented in Suzuki-Vidal et al. (Reference Suzuki-Vidal, Lebedev, Ciardi, Pickworth, Rodriguez, Gil, Espinosa, Hartigan, Swadling and Skidmore2015). To simplify interpretation, the properties of the injected flow were kept constant, the average charge state was fixed at 3.5 and the plasma resistivity was fixed.
Results from a parameter scan of $B$ and $L_{\eta }$
 are shown in figure 11. The aim was not to reproduce the experimental plasma conditions exactly, as was done with the Gorgon code, but rather to investigate our interpretation of the experimental results in § 3.4.
Electron density (a–c) and corresponding magnetic field (d–f) from three simulations at $500$ ns. The resistive diffusion length and magnetic field at the left-hand wall are shown for each run.

Figures 11(a,d) and 11(b,e) reproduce the high field and low field cases studied using the Gorgon code in figure 10. The numerical simplifications discussed above mean that while the observed shock in figure 11(a,d) is qualitatively similar to the Gorgon result and the experiment, it is quantitatively different. In figure 11(c,f), the conditions at the boundary are identical to those in figure 11(a,d) except $L_{\eta }$ has been increased tenfold. This means that the obstacle size relative to $L_{\eta }$
 in this simulation is similar to that in the 0.5 mm diameter obstacle experiments shown in figure 9(a) and the simulation can be used to test our interpretation of the experiment. Comparison of the 2-D shape and location of the shocks relative to the obstacles shows good agreement. Further analysis could not be carried out since measurement of the shock width and downstream parameters was not possible in the experiment. In the simulation, the density undergoes a sudden jump with a width set by the simulation resolution. This is characteristic of MHD simulations of hydrodynamic shocks in which numerical viscosity sets the shock width. The magnetic field is only slightly perturbed by the obstacles. The reason the shock structure is hydrodynamic-like is not the weak magnetic field strength, as in figure 11(b,e), but the weak coupling between the fluid and the field at a spatial scale smaller than $L_{\eta }$
 . This result is therefore consistent with our interpretation that we observe hydrodynamic-like shocks in the experiment.
5. Conclusions
We have presented an experimental and numerical investigation of perpendicular subcritical shocks in a highly collisional plasma. We have demonstrated the presence of subcritical shocks by showing that $M_{S} > 1$ across the shock. The key findings are as follows.
(i) We have shown, for the first time, experimental agreement with the theoretical prediction that there is no jump in hydrodynamic parameters within the subcritical shock. This conclusion was reached based on detailed measurements of plasma parameters across the shock with resolution well below the shock width.
(ii) These measurements also demonstrated that the measured shock width was approximately equal to the classical (Spitzer) resistive diffusion length, as predicted by theory.
(iii) The conclusions were supported by calculation of the heating rates expected from adiabatic and Ohmic heating. These were compared with the radiative cooling rate and found to be consistent with the observed temperature profile. This suggested an absence of viscous dissipation at the subcritical shock.
(iv) The 2-D resistive MHD simulations using the Gorgon code reproduced the experimentally observed morphology of the subcritical shock and demonstrated that Ohmic dissipation sets the shock width, which is comparable to the classical resistive diffusion length. However, it was not possible to fully reproduce the experimental results in the simulations. We conclude that this discrepancy was caused by two-fluid effects at an earlier stage in the experiment. The experiment provides useful benchmarking of both the Gorgon and AstroBEAR codes (Oberkampf & Roy Reference Oberkampf and Roy2011). We show that their resistive models are sufficient to reproduce the subcritical shock but that early time two-fluid effects may cause persistent discrepancies between simulations and experiments.
(v) Hydrodynamic-like stagnation shocks were observed behind the subcritical shock. These were not predicted by theory. TS measurements demonstrated the importance of viscous dissipation at these shocks by showing that directed kinetic energy was converted into ion thermal energy at the shock front.
(vi) The dependence of the observed shock structure on obstacle size was investigated experimentally. Obstacles which were smaller than $L_{\eta }$
 but much larger than $\lambda _{i,i}$ only produced hydrodynamic-like shocks. We concluded that at scales smaller than $L_{\eta }$, the collisional plasma in the vicinity of the obstacles behaved as though the magnetic field was not present, since resistive diffusion dominates at this scale. This conclusion was supported by varying $\eta$ in AstroBEAR MHD simulations.


This first experimental measurement of a subcritical shock in a collisional aluminium plasma provides a validation of MHD shock theory and supports existing and future applications of the theory to astrophysical shocks. It also provides benchmarking for MHD codes which are routinely used to simulate astrophysical, space and laboratory plasmas. Furthermore, it paves the way for future investigation in the laboratory. In particular, how the shock width scales with upstream parameters remains an open question.
Acknowledgements
We thank Drs E. Yu and D. Ho for useful discussion.
Editor L.O. Silva thanks the referees for their advice in evaluating this article.
Funding
This work was supported by First Light Fusion Ltd. and by the US Department of Energy (DoE) including awards nos. DE-NA0003764 and DE-SC0020434.
Declaration of interests
The authors report no conflict of interest.
Data availability statement
The data that support the findings of this study are available from the corresponding author upon reasonable request.