

Introduction
State presence in the economy remains strong worldwide. State-owned enterprises (SOEs) rank among the largest firms in both emerging and advanced capitalist economies.Footnote 1 Some countries have even expanded state ownership by creating new SOEs or nationalizing existing firms.Footnote 2 These developments defy long-standing arguments that state ownership should be minimized or eliminated due to lower enterprise efficiency, productivity, and profitability.Footnote 3 SOEs persist because they serve crucial economic and political functions for governments: generating revenues through dividends and taxes, supporting employment, keeping key input prices low, responding to natural disasters and other crises, channeling capital toward targeted sectors and technologies, and supplying political elites with rents.Footnote 4
How do governments manage these firms? SOEs are important entities for states to control because they represent significant economic and political value. One key tool is “personnel power,” authority over SOE executive appointments. Systems of SOE executive appointment worldwide vary from market-oriented to political-oriented. On the market end of this spectrum are systems in which SOE boards of directors choose their executives instead of state appointments, approvals, or nominations.Footnote 5 At the other end are systems in which SOE executives are government officials or high-ranking members of the ruling elite.Footnote 6
We examine how personnel power is exercised in China, a context in which SOEs are highly politically integrated. China is an important case because its state sector is the biggest in both global and domestic terms. China has the largest total number of SOEs and also the highest share of SOEs among its biggest companies.Footnote 7 SOEs contribute an estimated 23 percent of the country's GDP and constitute a vital part of its industry and equity markets: they account for 28 percent of industrial assets, as well as approximately 40 percent of total market capitalization and 50 percent of revenues of publicly listed companies.Footnote 8 Moreover, Chinese SOEs have long provided the majority of overseas direct investment.Footnote 9 How the government manages SOEs therefore significantly affects both the domestic and global economies. Comparatively, the Chinese case may offer insights into the balance of economic and political factors in SOE management in other politically oriented systems.
We leverage original data to conduct the first systematic analysis of China's governance of its largest SOEs through executive appointments. Specifically, we investigate the factors affecting the political mobility of the leaders of China's fifty-three core central SOEs—who stays in the state-owned economy, who gets transferred to the government, and who exits. We use logit and multinomial logit models to analyze the attributes of top leaders and all central SOEs with vice-ministerial rank equivalence from 2003 to 2017. Specifically, we test if core central SOE leaders are rewarded for delivering positive economic performance or are moved to other positions for reasons of political connectedness.
Our findings are twofold. First, we find that better economic performance decreases the likelihood of a SOE leader exiting executive life and being transferred to a government position. Second, we find that SOE leaders are more likely to stay in their posts if they have informal connections to the political elites in charge of their evaluation; the more connections they have, the more likely they are to stay in the state-owned economy rather than exit or move into government. Put simply, China's party state retains SOE executives who deliver on the bottom line and are connected with the leadership of party and government organs responsible for personnel and enterprise administration. At the same, it rewards those who have accumulated government experience and party training with possible political advancement. These findings suggest that in contexts like China where SOEs are highly integrated with the state apparatus and ruling elites, personnel power can function as an instrument for economic and political stability.
SOE management around the world
SOEs serve vital economic and political functions for governments, making state management of these firms an important issue for comparative politics. Dividends and taxes from SOEs often constitute a significant source of government revenues. State firms also support stability by providing employment, keeping key input prices low, and responding to natural disasters, financial crises, and public health challenges. They facilitate industrial policy, national development, and economic statecraft by channeling capital toward targeted sectors and technologies and executing major infrastructure projects at home and overseas. They also supply political elites with an important source of rents.
Many governments use authority over executive appointments as a key method of governing SOEs. The logic is simple: control the leader, control the SOE. SOE executives directly affect firm organization and behavior by making and executing choices about strategy and structure. Specifically, SOE leaders choose whether and how to respond to state directives and changes in external economic and political environments. They also shape corporate structure by creating, eliminating, or modifying departments; altering internal hierarchies of authority; and reallocating assets, capital, and personnel. As more SOEs operate outside of their home countries, SOE executives’ decisions now affect markets, communities, and environments worldwide.
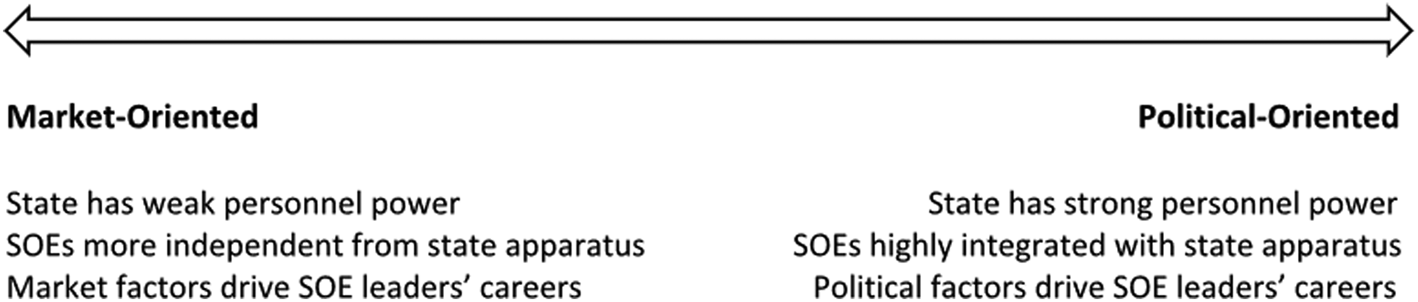
SOE executive appointment systems worldwide vary from market-oriented to political-oriented (figure 1). On the far market end are systems in which SOE boards of directors select executives.Footnote 10 Such systems are few and located predominantly in advanced capitalist economies, including Australia, Germany, New Zealand, Norway, and Sweden.Footnote 11 Other countries blend a primarily market orientation with limited state involvement. For example, South Africa permits SOE boards of directors to select executives subject to consultation with and final approval by state authorities.Footnote 12 In these systems, SOEs are managed like private firms, with market forces driving executive assessment and selection.
Spectrum of SOE Executive Management Systems

On the far political end are systems in which the state chooses SOE executives, and they are highly integrated with the state apparatus and ruling elites. Paradigmatic cases include Gulf states like Qatar and Bahrain, where members of the ruling family personally select executives and can serve as SOE leaders.Footnote 13 In Russia, top presidential administration officials and ministers routinely serve concurrently as the chairmen of the largest SOEs; the state can also bypass boards to appoint CEOs.Footnote 14 In these systems, firms act more like bureaucratic government organizations than fully marketized entities.
Between the extremes are blended types where governments may appoint leaders, but SOE executives vary in their connectedness with the political elite. In South Korea, for example, the president directly appoints the heads of SOEs, typically choosing individuals who are former political allies but who do not serve concurrently as government officials.Footnote 15 In Austria, government ministries retain primary powers of appointment over top management positions in state firms, with ministers who are unconstrained by watchdog junior ministers more likely to appoint SOE executives who share their partisan affiliation.Footnote 16
Factors affecting the state's exercise of personnel power vary depending on where a system of SOE executive appointment falls on this spectrum. Toward the market-oriented end, firm performance should better explain SOE executive career trajectories because the state interferes less, allowing markets to determine outcomes. However, toward the political-oriented end, firm performance alone is unlikely to account for who gets and keeps leadership positions. Instead, political factors like ties with higher-level officials or previous work experience must also be considered. While market forces may play a role, the interconnectedness of government and SOEs creates greater opportunities for political factors to matter.
This study focuses on one case of a highly politically oriented SOE executive appointment system: China. Beyond its theoretical importance as a paradigmatic politically oriented system, the China case is substantively significant because of Chinese SOEs’ economic might and because it is a bureaucratically defined system of oversight and authority, discussed in the following text. Lessons from China may thus be informative for other contexts where political units have formal authority over leadership appointments.
SOEs in China
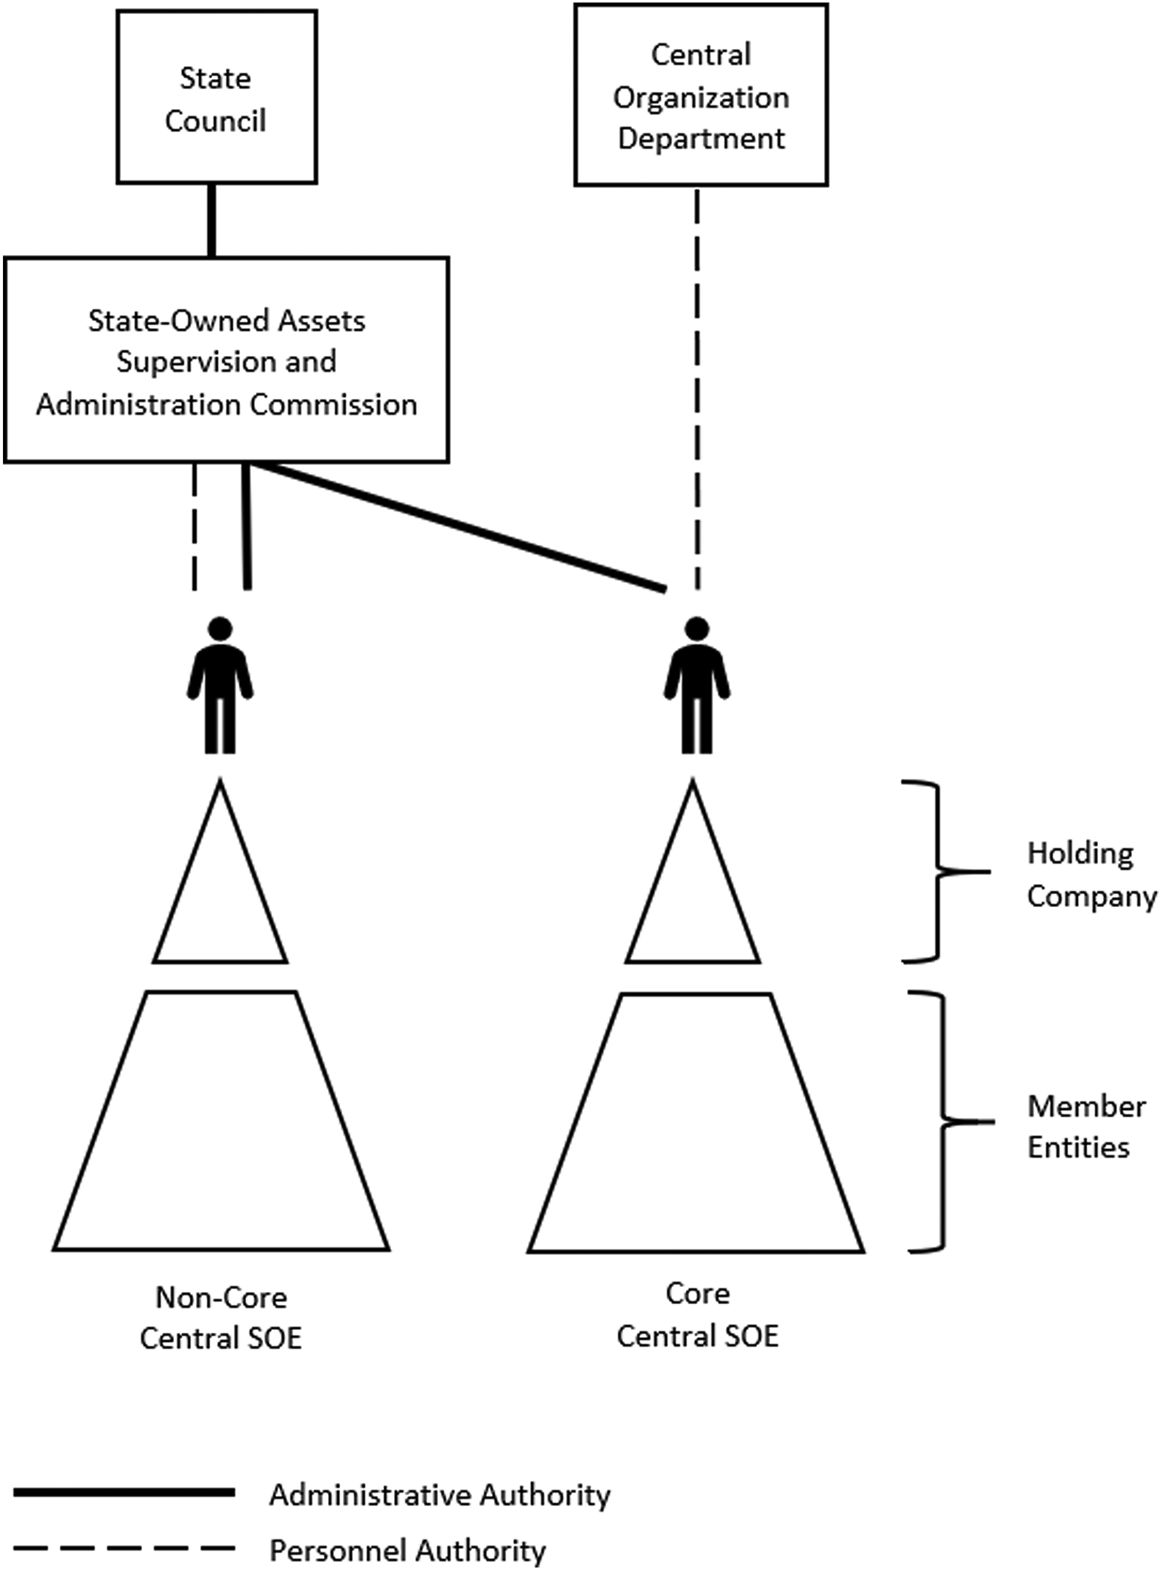
Today, China has ninety-seven central SOEs—nonfinancial companies owned by the central government and administered by the State-Owned Assets Supervision and Administration Commission (SASAC).Footnote 17 Core central SOEs are a subset of these firms: their vice-ministerial rank equivalence sets them apart from other central SOEs with department-level rank equivalence.Footnote 18 This means that leaders of core central SOEs have a bureaucratic rank equivalent to government officials like mayors.Footnote 19 Most core central SOEs are concentrated in strategically important sectors with restricted competition, such as defense, petroleum, electricity, aviation, and telecommunications, while some operate in more competitive industries like electronics and automobiles.Footnote 20 This sectoral distribution mirrors other countries.Footnote 21 Core central SOEs are typically structured as large enterprise groups, with as many as 100 to 200 member entities—including joint venture firms, research institutes, and publicly listed subsidiaries—arrayed under a holding company wholly owned by SASAC.Footnote 22
The Central Organization Department (COD), the Chinese Communist Party (CCP) department responsible for managing all leading officials in China, directly appoints, transfers, and removes core central SOE leaders. Specifically, the core central SOE leaders that the COD manages are the individual(s) holding the positions of party secretary, general manager, and board chairman. The COD has personnel authority for these executives even though the firms they lead are formally under SASAC administration.Footnote 23 As Mark Wu puts such an institutional arrangement in comparative terms: “Imagine if one U.S. government agency controlled General Electric, General Motors, Ford, Boeing, U.S. Steel, DuPont, AT&T, Verizon, Honeywell, and United Technologies. … It could hire and fire management, deploy and transfer resources across holding companies, and generate synergies across its holdings.”Footnote 24 Because the COD, a key party organization, has final say over personnel appointments, there is a clear institutional pathway for political influence over SOE management. Figure 2 depicts the administrative hierarchy and organizational structure of core central SOEs in China. The division of administrative and personnel authority in China's core central SOEs creates the potential for both economic and political factors to influence leader mobility, making this group of SOE leaders a crucial case for differentiating between their effects.
Administrative Hierarchy and Organizational Structure of Core Central SOEs in China
Source: Leutert, Reference Leutert, Bernier, Florio and Bance2020.

Core central SOE leaders are comparable to other leading Chinese officials because of their formal bureaucratic status—their administrative rank equivalence—and their political management by the COD. Core central SOE executives are almost invariably Han Chinese men between fifty and sixty years old.Footnote 25 Virtually all have at least a college education, similar to leading local officials like provincial governors and party secretaries.Footnote 26 Core central SOE heads typically assume their positions after decades spent working their way up gradually within a particular industry and sometimes even within a particular firm. They routinely move on into Chinese civil service positions in local and central government, although their rates of political circulation and age-mandated retirement are lower than those of other officials.Footnote 27 It is extremely rare for core central SOE leaders to cross over to the private sector, even though exits from the public sector are becoming more common for local officials.Footnote 28
Personnel power and SOE executives
Because Chinese SOE leaders are administratively similar to other officials in the state bureaucracy, existing research on political mobility provides a starting point for analyzing SOE leader mobility. Numerous studies find a positive correlation between economic performance and political advancement.Footnote 29 This positive relationship is theorized to drive a meritocratic growth model in which the CCP's cadre management system incentivizes and rewards economic performance.Footnote 30 Other scholarship finds that political connectedness and patronage ties improve officials’ career prospects.Footnote 31 Another body of work suggests that economic performance has a greater effect at lower levels and for individuals in government positions, whereas political connectedness matters more at the central level and for party posts.Footnote 32 Still others argue that economic performance may be partly endogenous to political connections.Footnote 33
Scholarship specifically addressing central SOE leaders is growing but remains limited. Yang, Wang, and Nie (Reference Yang, Wang and Nie2013) find that economic performance, membership in the Central Committee of the CCP, and having a PhD degree all boosted the likelihood of individuals advancing within and beyond the top ranks of central SOE management between 2008 and 2011.Footnote 34 Brødsgaard et al. (Reference Brødsgaard, Hubbard, Cai and Zhang2017) look inside central SOEs to find that economic performance positively affected the internal promotion of subsidiary heads between 2003 and 2012.Footnote 35 Other studies focus on central SOE leaders’ career trajectories, political connectedness, and institutional integration within China's political system.Footnote 36
These works provide important insights but have highly restricted empirical and chronological scope. Multiple studies combine leaders of core and noncore central SOEs in their analyses or aggregate intrafirm and postfirm advancement as a single dependent variable.Footnote 37 However, this is unadvisable because different bodies appoint the leaders of core and noncore SOEs and the determinants of intrafirm promotion and postexecutive leadership movements are likely to differ. Other work only examines intrafirm promotions of subsidiary heads, not the mobility of core central SOE leaders.Footnote 38 The short timeframes in existing research—only one year in Lin (Reference Lin2017) and four years in Yang, Wang, and Nie (Reference Yang, Wang and Nie2013)—constitute a further analytic obstacle. Our analysis of personnel power in China—how the government uses executive appointments to govern SOEs—advances these studies by systematically assessing the factors affecting political mobility for all core central SOE leaders between 2003 and 2017.
The exercise of personnel power
How does the CCP exercise personnel power? Are market forces correlated with personnel management, or do political connections define the career paths of China's core central SOE leaders? Economic performance is one possible explanation for political mobility. SOEs’ economic performance is of vital concern to the state: they contribute 30 percent of government revenues and account for 40 percent of market capitalization of companies listed on the Shanghai and Shenzhen stock exchanges.Footnote 39 SOEs also support economic stability by helping to avert financial turmoil, for example by enabling the coordinated resumption of Chinese industrial production during the COVID-19 pandemic and arresting sell-offs during 2015 Chinese stock market volatility.Footnote 40 Improving SOEs’ economic performance has been a long-standing policy goal in China; state intervention to restructure poor performers further underscores the imperative for core central SOE leaders in all sectors to deliver positive economic performance. Indeed, SASAC requires central SOE leaders to sign responsibility contracts for firm performance and charges them with fulfilling what director Hao Peng describes as an economic “stabilizer” function.Footnote 41 Together, these factors suggest that firm performance could influence leader outcomes. Choosing to retain SOE executives who deliver positive economic performance helps to aid government solvency and avert financial turmoil, whereas removing or transferring well-performing SOE leaders risks potentially destabilizing firm performance and broader growth.Footnote 42
Publicly available information indicates that economic performance is vital to performance assessment for core central SOE leaders. Chinese SOEs routinely compete with one another and with foreign firms, both at home and abroad.Footnote 43 The state expects central SOEs at minimum to make profits, even if not necessarily to maximize them.Footnote 44 Even so, maximization of operational profits is still listed first among the principles on which SASAC's performance assessment system was originally based.Footnote 45 In central SOE assessment measures issued by the COD and SASAC on a trial basis in 2009, fully half of the proposed evaluation scheme was based on operational performance metrics, more than any other area assessed.Footnote 46 The most recent publicized evaluation measures urge SOE leaders to boost efficiency, optimize resource allocation, improve labor productivity, and increase capital returns.Footnote 47 Every year, SASAC measures top executives’ success in achieving economic performance targets based on the preceding year's results, and it assigns them a grade from A to E that determines their compensation relative to a fixed baseline.Footnote 48 There is limited information publicly available about how SASAC's grades ultimately factor into the COD's decisions about political mobility for the core central SOE leaders under its personnel control. However, the fact that all central SOE leaders receive SASAC grades suggests that the COD does take them into account together with other factors, including individuals’ qualifications for particular posts and even their personal preferences.Footnote 49 Knowing that maintaining high-performing leaders supports economic stability and that economic performance is a key element for annual review, we expect that leaders of higher performing firms are more likely to maintain their positions than exit the state-owned economy.
Political connectedness is another potential determinant of SOE executive management. In systems where the management of SOEs is highly integrated with the political system and ruling elites, political connectedness is expected to be the primary driver of personnel decisions. Of primary interest here is political connections through patron-client relations. SOE leaders are clients of three types of higher-level officials: central party leaders, the COD—the department ultimately responsible for personnel decisions, and SASAC leaders—those in charge of annual reviews used by the COD to evaluate SOE leaders. Based on reciprocal accountability arrangements, political leaders rely on SOE executives to provide political and economic goods through their firms while SOE executives depend on political leaders for their jobs.
Although informal connections are criticized for potentially undermining meritocratic, rules-based governance, they can boost political stability in multiple ways: by aligning interests, solving information problems, fostering mutual trust, sustaining cooperation, and improving communication within the state bureaucracy.Footnote 50 Political connectedness, then, increases transparency between patron and client, decreasing the information asymmetry present in all patron-client relationships. These ties have been shown to increase the probability of political advancement in other areas of the bureaucracy.Footnote 51 Patrons are incentivized to keep “their people” in the game longer, benefiting from broad networks creating a constant pool of political allies.Footnote 52 Encouraging one's allies to stay in positions of power creates political stability by widening politician networks and constituencies of support. Because of this, we expect that leaders with patronage political connections are more likely to stay in the state-owned economy than exit.
A final potential determinant of personnel power is the professional history of SOE leaders. In politically oriented systems such as China, SOE leaders are more likely to have had previous work experience in the formal government bureaucracy because of the intertwined nature of the state and economy. Formal work experience in the state apparatus allows SOE leaders to gain familiarity with rules and expectations for political advancement and to demonstrate loyalty to the ruling regime. Because such work experience also provides an opportunity for socialization, network building, and exposure to government positions, we expect that former work experience in the state apparatus increases the probability of being transferred into government.
Methods and data
To evaluate the determinants of leaders’ political mobility, we use an original dataset of 243 leaders of all core central SOEs in China between 2003 and 2017, which yields a total of 1,231 leader-year observations.Footnote 53 We focus on core central SOEs because the clear lines of economic oversight by SASAC and political oversight by the COD allow us to more clearly identify potential patron-client relationships.Footnote 54 Because of China's politically oriented system of SOE management and the high ranking of core central SOEs with well-defined channels of authority between their leaders and the CCP, this study presents a case in which political connections appear most likely to influence mobility outcomes. For inclusion in our sample, an individual must hold at least one of the three top leadership positions in a core central SOE—party secretary, general manager, or chairman of the board of directors—for at least six months. Information about these leaders’ backgrounds and career trajectories was compiled from their official CVs, media reports, company websites, and the Chinese Political Elites Database hosted by National Chengchi University.
Dependent variable
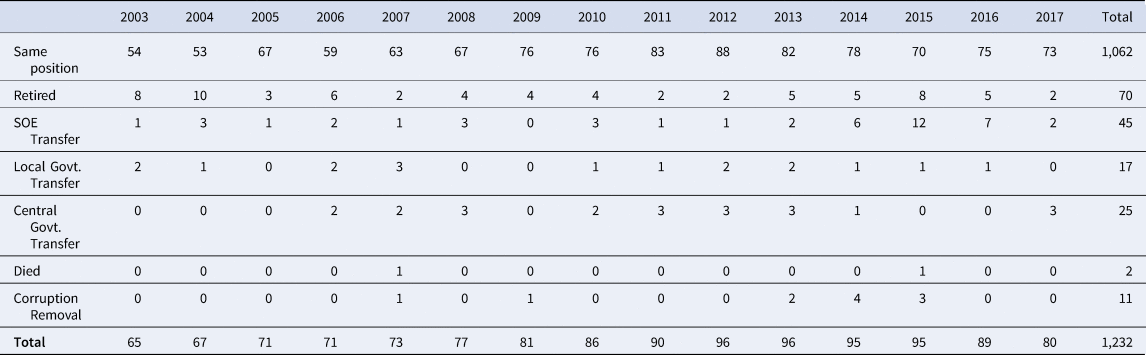
The dependent variable is political mobility: a core central SOE leader's probability of leaving his position of executive leadership. As discussed in the following text, we operationalize political mobility in two forms—power continuation and sectoral change—to capture the dynamics of leaders’ careers. Broadly speaking, political mobility has multiple potential outcomes: exit through retirement, death, or corruption removal; transfer to an executive post at another central SOE; or appointment to a position in government at either the local or central level. Given these possible outcomes, staying in position is, naturally, the most common outcome for leaders—leaders maintain their position on average 86 percent of the time, while the frequency of other mobility outcomes varies by year (table 1). Descriptively, there were more transfers between SOEs in the Xi Jinping era (post-2012) than during the Hu Jintao period, but transfers to government positions do not show specific trends. Conceptually, we group lateral transfers to another SOE leadership position with staying in one's position because neither rank nor sector changes.
Leadership Mobility Outcomes for China's Central SOE Leaders

Source: Authors’ dataset.
Leaders can exit by retiring, dying while in office, or being removed for corruption.Footnote 55 Core central SOE leaders are required to retire at the age of sixty, although this rule is often violated.Footnote 56 Corruption removals occur throughout the study's timeframe and more frequently under the Xi administration than the Hu administration. Nine of eleven corruption removals occurred from 2013 to 2015, a time when the Central Commission for Discipline Inspection targeted core central SOEs for investigation.Footnote 57 Retirement may also mask corruption: officials may be pressured into retirement or retire early to avoid a corruption probe, thereby making it difficult to discern between genuine and forced retirement for disciplinary purposes.Footnote 58 In our dataset, approximately 10 percent of those who retire do so before the age of sixty, with the youngest being fifty-four, but reasons for early retirement are unknown. We therefore follow the standard practice in the political mobility literature of employing a single termination category combining retirement, death, and corruption removal into one “exit” outcome.
It is also important to note that formal demotion due to poor performance is not a common occurrence in the Chinese context. Poorly performing leaders are often not formally demoted or punished but rather transferred laterally to another position of the same rank in a less important unit.Footnote 59 Within our dataset, only two individuals were “demoted” with a move to a noncore central SOE. It is therefore neither internally valid nor empirically valid to separate out this mobility outcome.
Another possible political mobility outcome for core central SOE leaders is appointment to positions in government at either the local or central level. Most movements within state-owned industry or to government are lateral transfers to same-ranked positions (vice-ministerial) rather than a promotion upward to ministerial rank. However, a small number of core central SOE leaders have ultimately achieved positions of full ministerial rank through government pathways at both the local and central levels, thereby showing that either government pathway does offer a potential route to political promotion.
We measure political mobility in two forms. First, we measure mobility as a dichotomous variable of power continuation. Remaining in one's position, moving to a different SOE, or being transferred to the government are scored as one and termination through retirement, death, or corruption removal are scored as zero. This measurement captures who gets to “stay in the game” rather than exiting the political system, which is generally seen as more desirable because power continuation allows continued access to resources and power. Second, we separate out different mobility outcomes to disaggregate the various ways in which leaders maintain power. A three-category variable, mobility, captures sectoral changes by measuring outcomes as exit, stay in the state-owned economy, or transfer to a government position. While moving to the government is the only pathway to political promotion, we use a categorical variable because we do not assume that staying in the state-owned sector or moving to government are intrinsically ranked as better or worse outcomes for leaders.
Independent variables
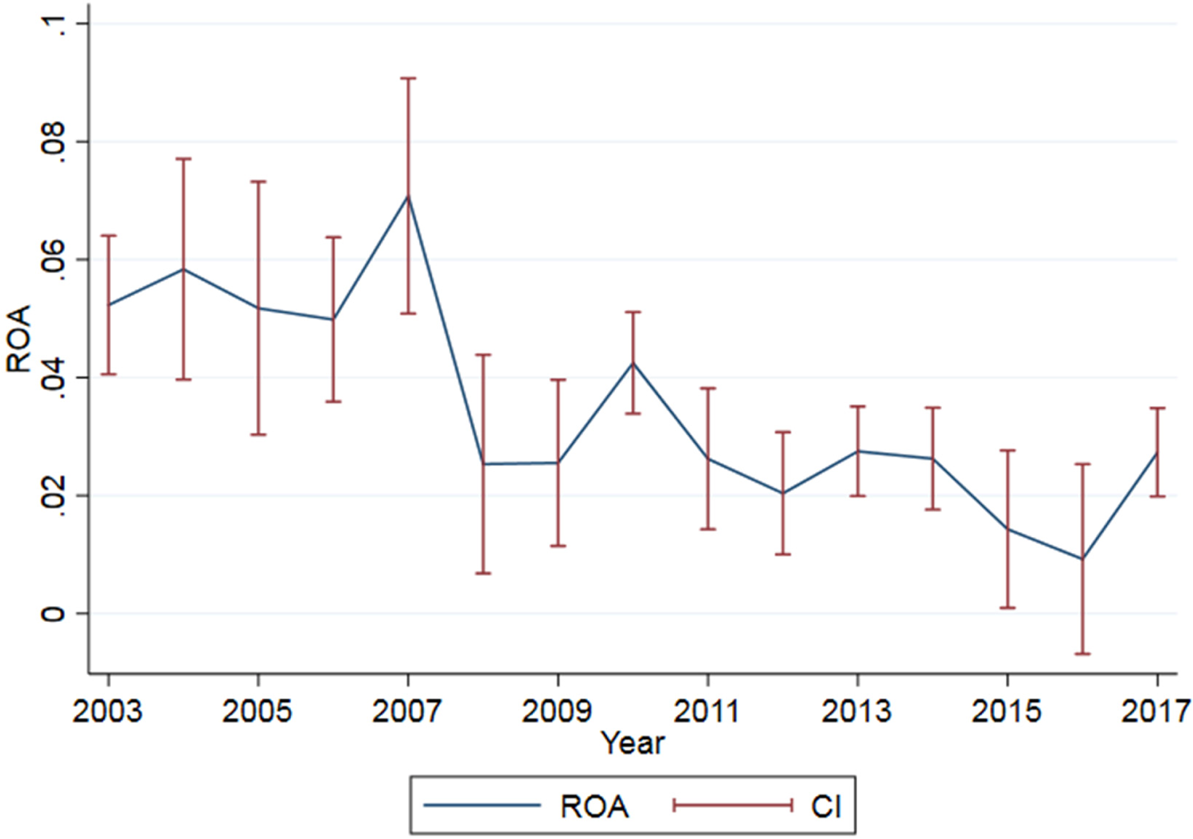
We assess core central SOEs’ economic performance by measuring the performance of their largest (by assets) publicly listed subsidiary in each year.Footnote 60 Because these publicly listed subsidiaries typically contain the best quality productive assets from core central SOEs, their performance represents a conservative upper bound for that of the overall enterprise group. While performance data for entire enterprise groups would be preferred, this data is largely unavailable because Chinese regulatory authorities do not require its disclosure. We follow the literature to take return on assets (ROA) for the largest listed subsidiary as our primary measure of firm performance.Footnote 61 Average ROA for the core central SOEs over time is presented in figure 3. Variation in firm performance occurs both across firms and over time, with greatest variation among firms during financial downturns and stock market crises. To reduce the variation in performance measures due to these factors, we also include a differenced measure of ROA. Alternative measures of firm performance, including negative performance, are discussed in the text that follows.
Average ROA for Central SOE Largest Subsidiary over Time, with 95 Percent Confidence Intervals

The second key independent variable is political connectedness. Measures of political connectedness are hotly debated and include birthplace networks, occupational proximity (defined as work and military experience in the same place at the same time), coworker networks, and patronage ties.Footnote 62 We conceptualize political connectedness as patron-client relations. A core central SOE leader is considered politically connected to a patron if the superior during whose tenure he was initially appointed is still in office. For example, a core central SOE leader appointed in 2003 is considered politically connected to Hu Jintao, who was party secretary at the time of appointment, until 2012 when Hu leaves office and Xi Jinping assumes leadership. The logic of this measurement is that initial appointment is more likely to signal connections and patronage relationships than more diffuse birthplace or workplace-based ties.Footnote 63
We measure patronage ties at three levels: the national administration (Hu or Xi), SASAC (particular SASAC directors), or the COD (particular COD directors).Footnote 64 Elite factions linked to China's top leader may be politically salient, especially for central-level officials like core central SOE heads. Economically, SASAC is responsible for overseeing and assessing core central SOEs’ economic performance and grading their executives annually from A to E, which presumably affects their political mobility prospects. Politically, the COD exercises ultimate decision-making authority over core central SOE leaders’ appointment, transfer, and removal. At each of these three levels, changes in individual patrons might affect political mobility because different leaders may have varying priorities and approaches to personnel management. We do not assume that core central SOE leaders know their patrons personally, although this is quite likely given their status as central-level officials.Footnote 65
The third set of measures captures professional experience. First, we measure whether a core central SOE leader has any previous work experience in a government or party position at the local or central level prior to his SOE leadership position. Previous experience is measured as a dichotomous variable disaggregated by level: central and local. Professional experience is also measured at the firm level through leadership tenure. Longer leadership tenure may be a boon to political advancement as it signals depth of leadership experience.
Control variables
Previous professional experience is one control variable of particular interest. We use dichotomous variables for experience in local or central government and a continuous variable for number of years in one's leadership position.
There are four sets of control variables for this analysis: individual traits, party training, firm traits, and period controls. Individual traits include age and education. Because the mandatory retirement age is sixty for officials of vice-ministerial rank, we expect age to be positively correlated with exit. Age squared is included to capture any nonlinear effects of age.Footnote 66 Education may increase the probability of promotion because of the party's ongoing efforts to professionalize cadres. We therefore include an indicator variable for graduate degree (MA or PhD) to assess the effects of advanced educational attainment. Some leading officials participate in formal training courses for mid-career cadres at the Central Party School. These schools provide a structured means of socializing officials within the party and potential networking opportunities. We also include industry fixed effects. Firms are identified by their industry according to internal SASAC classifications to control for differential treatment of firms by industry. Finally, we include an indicator variable for regime effect measuring Xi Jinping's administration (the first term in 2013–17).
A summary statistics table is available in the Appendix (table A3).
Modeling strategy
We implement a series of logit and multinomial logits to assess the relative determinants of political mobility.Footnote 67 In the initial set of models, the dependent variable is a discrete binary variable of power continuation, where 1 indicates staying in one's position or a subsequent appointment to another executive or government post and 0 indicates exit (retirements, deaths, and corruption removals). The second set of models conceptualizes the dependent variable as a three-category mobility measure, where –1 indicates exit, 0 indicates staying in position, and 1 indicates lateral movement to another central-level SOE position or any government position.
Results
Power continuation
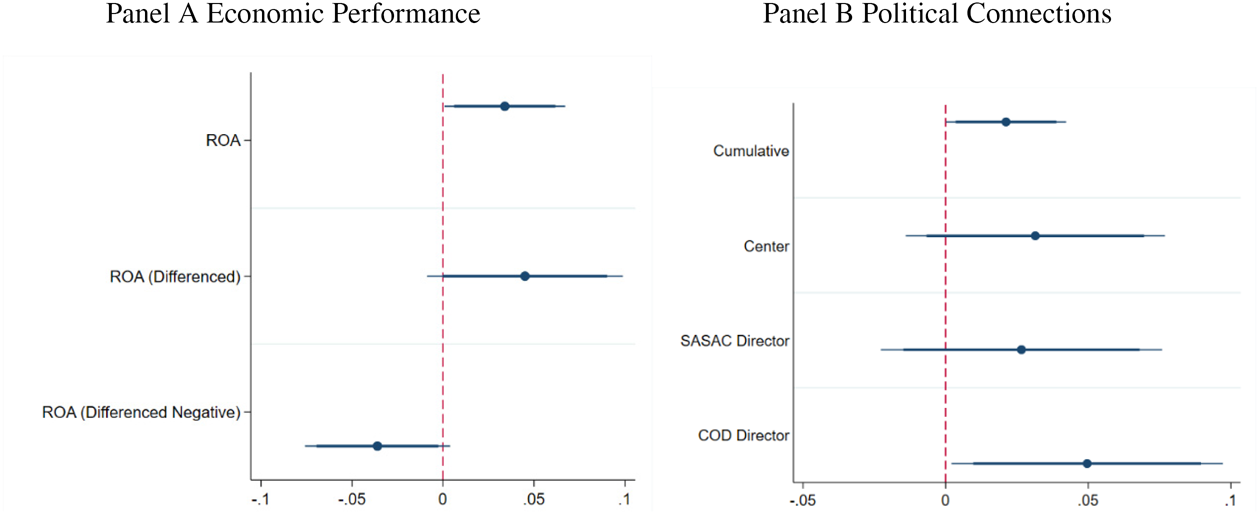
The first set of models presents logit models on the correlates of power continuation (figure 4). Exit from professional and political life means giving up access to economic and political power gained from a formal position, whereas power continuation means a leader gets to “stay in the game”—continuing to exercise influence and potentially earn rents from his formal position. Performance is positively and significantly correlated with power continuation. Both measures of good performance, ROA level and differenced ROA, are positive and significant (p = 0.45 and 0.10, respectively). Correspondingly, negative ROA growth, measured as one if ROA declined over the previous year and 0 otherwise, is negatively correlated with power continuation: having negative ROA growth results reduces the probability of power continuation by 3.6 percent (p = 0.07). This suggests that leaders who oversee more profitable firms, both overall and compared with the previous year, are more likely to stay in their position than exit.
Marginal Effects Power Continuation, Logit Models with 90 Percent and 95 Percent Confidence Intervals
All models include controls for age, experience, and SOE industry. Models in Panel A include cumulative connections while models in Panel B include control of ROA. Full results available in appendix tables A4 and A5.

Panel B presents the marginal effects of three levels of patron-client ties on power continuation. For power continuation, only connection to the COD is statistically significant on its own. However, cumulative connections also increase the probability of staying in power, providing some evidence that patron-client relationships matter but depend on the connection. Leaders without political connections have a predicted probability of continuing their position of approximately 88 percent whereas those with political connections at any of the three levels is approximately 92 percent.Footnote 68 Connection with the COD director has a slightly larger effect on probability of power continuation, but this difference is not statistically significant.
Of the experience measures, only leadership years is statistically significant, although the effect is small and temporally bound: one additional year in position decreases the probability of power continuation by 0.7 percent. This effect, however, disappears as tenure grows: longer tenures do not have a correlation with power continuation.Footnote 69 This correlation is also collinear with age and likely picking up some of the effect of age. Having experience at either local or central level government does not change the likelihood of staying in the political game. The primary determinant of exit is age. Both age and age squared are significant, suggesting a nonlinear relationship.
Disaggregating power continuation
The power continuation model groups multiple outcomes together. In reality, SOE leaders can maintain power in different ways: by staying in the state-owned economy (either remaining in their current firm or rotating to another central SOE) or by taking up a post in government. We treat these outcomes as categorical in nature. While a move to a government position provides the possibility of a rank-based promotion, maintaining a position in a central SOE may provide greater financial benefits. In this section, we present three-level models disaggregated by outcome (exit, stay in SOE, move to government).
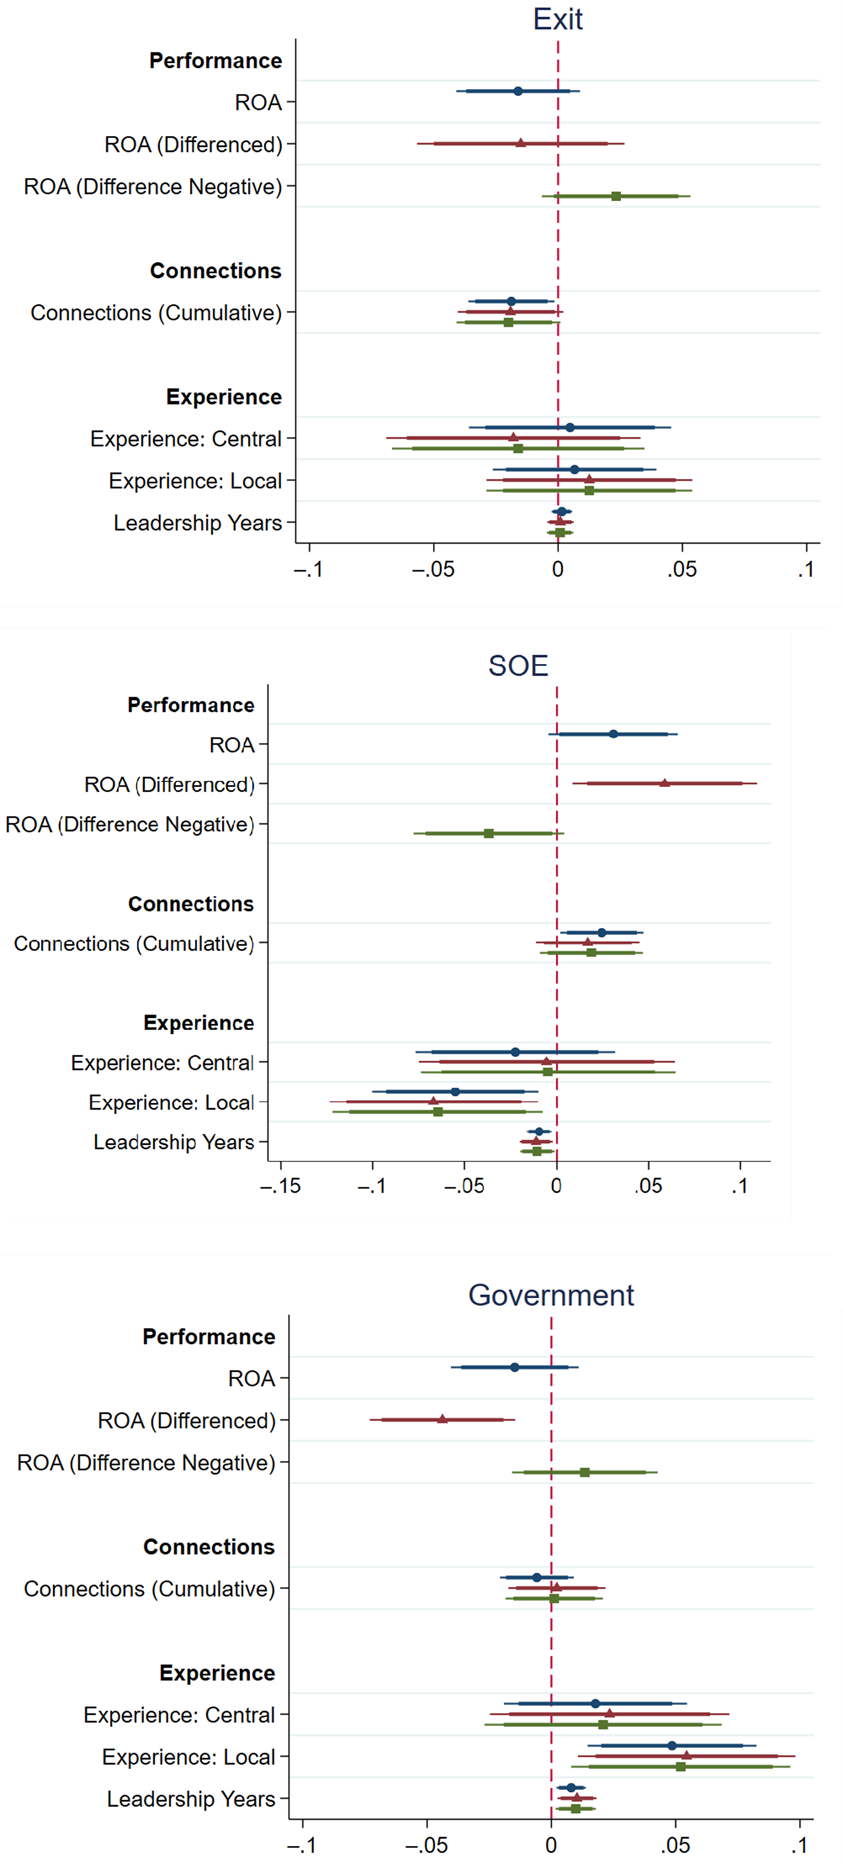
In the three-level multinomial models, there is some supporting evidence that firm performance influences political mobility (figure 5). Performance, ROA level, is positively correlated with staying in one's position in the state-owned economy, but not correlated with exit or a move to government. Leaders who oversee an increase in ROA (ROA differenced positive) are significantly less likely to be rotated into the government and more likely to stay in the state-owned economy; leaders who see negative growth (ROA differenced negative) are more likely to exit than to stay in their SOE position. Taken together, these results provide more specifying evidence for Hypothesis 1, that leaders of firms performing well are both more likely to stay in their position rather than exiting and more likely to stay in the state-owned sector rather than being rotated to the government.
Marginal Effects of Key Independent Variables on Probability of Exit and Political Mobility, Three Level Models with 90 Percent and 95 Percent Confidence Intervals
Staying in the state-owned economy estimated as the baseline option. Marginal effects predicted from the multinomial logit model. Full results available in appendix table A6.

In the three-level models, leadership years decrease the likelihood of staying in one's executive position and increase the probability of moving to a government position. As in the power continuation models, however, this effect is small and disappears at longer durations of tenure (figure A1). Previous experience in local government has a positive and significant impact on mobility into government positions. Having previously served in local government increases the probability of transferring to a government position, either at the local or central levels, by about 5 percent. These results suggest that one pattern in the personnel management of core central SOE leaders is from local government to central SOEs and finally back to government, whereas another pattern is simply staying within the state-owned economy for one's entire career.
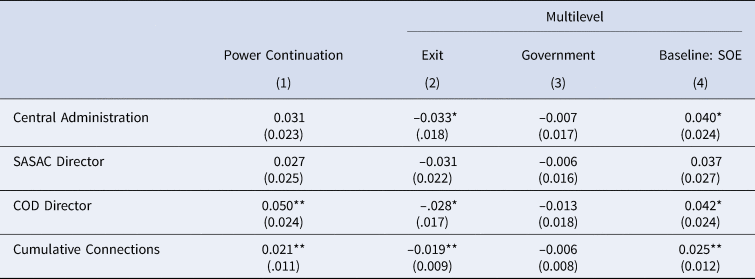
The three-level models also show positive correlations between political connectedness and staying in one's position, similar to the power continuation findings (table 2). Connections with the COD director and the central administration reduce exit by approximately 3 percent and increase the probability of staying in the state-owned economy by approximately 4 percent. The importance of connectedness with the COD director is further evidenced when controlling for other connections. When controlling for connections with SASAC directors as a robustness check, the COD connectedness measure remains statistically significant, with COD connectedness increasing the probability of staying in the state-owned sector compared to the other two outcomes by 6 percent (p = 0.000).Footnote 70 Political connectedness increases the probability of staying in one's position, but not moving into government. While some might expect politically oriented regimes to have high levels of SOE leader interchange between the state and the economy, these results suggest that in China politically connected individuals are more likely to remain in the economy.
Marginal Effects of Patron Connections at Three Levels on Power Continuation and Mobility Outcomes

Marginal effects for connections with the central administration, SASAC director, and Central Organization Department director, as well as cumulative connections. Column 1 presents results from logit regressions. Columns 2–4 present results from multinomial logit models. Full results available in the appendix. Columns 2 and 3 present the marginal effects of exit and mobility to government, respectively, compared to remaining in the state-owned sector. Column 4 presents the baseline effects which should be interpreted as the sum of the effects on exit and government.
Robust standard errors clustered at the individual level.
*** p < 0.01; ** p < 0.05; * p < 0.1.
Similar to the political connectedness models, the number of patron connections also matters for maintaining one's position in the three-level model. In particular, the more connections one has, the less likely one is to exit, with a marginal effect of 0.02 (p < 0.033), and the more likely one is to stay in the state-owned sector. Beyond the bivariate models, these results highlight that leaders with patron connections stay in the state-owned economy rather than being pulled into government. From the patron's perspective, this suggests a strategy of oversight administration regimes keeping a broad base of potential allies across multiple sectors, rather than pooling them into the government bureaucracy, similar to the findings of Keller (Reference Keller2016).
Robustness checks
For our main models, all three types of leaders—general manager, party secretary, and chairman—are treated as equal. As a robustness check, we also evaluate the potential for position effects. All models were run with indicators for the three different positions. Chairmen were more likely to continue their executive leadership in the logit model (marginal effect 0.05 p = 0.081) and less likely to exit in the multinomial model (marginal effect 0.05 p = 0.02). This correlation is likely the result of time-relative patterns: at the beginning of the panel, most firms did not have a board of directors and therefore lacked a chairman position. The growing proportion of firms with boards and consequently chairmen over the course of the panel means a natural bias toward power continuation because our data are censored. Concurrent positions, holding more than one position at a time, increases power continuation (marginal effect 0.04 p = 0.066) and decreases the likelihood of exit (marginal effect –0.03 p = 0.048) and moving to government (marginal effect –0.04 p = 0.017).
It is also possible that there are interaction effects between political connectedness and economic performance. Theoretically, a politically connected leader could be rewarded more for economic performance, or an unconnected leader could be rewarded less. We test this potential interaction dynamic and find no statistically significant interaction in any model.
The results presented in the preceding text are robust to alternative measures and modeling forms. We included alternative measures of firm performance and test for a series of nonlinear relationships with performance and interactions between performance and age. Our results remain the same. See the Appendix for a description of robustness checks.
Conclusion
As the state's presence remains strong in economies worldwide, many governments use executive appointments to govern their SOEs. In this article, we posit that systems of SOE executive appointments vary on a spectrum from market-oriented to political-oriented. Situating these systems relative to one another is an essential first step toward integrating the rich but fragmented country-based literature on SOE governance. Next, we investigate empirically how China—a substantively important case of high integration with the state apparatus and ruling elites—governs its SOEs, by conducting the first systematic analysis of political mobility for the leaders of the largest and most strategically important Chinese state firms. We find that better economic performance decreases the probability of a core central SOE leader exiting his executive role and increases the likelihood of transfer to another core central SOE. We also find that core central SOE leaders are more likely to stay in position if they possess informal connections to the political elites in charge of their evaluation, while those with previous local-level political experience are more likely to move into government.
Important areas for future research include exploring alternative measures of political connections and the determinants of core central SOE leaders’ initial appointments to executive leadership positions. One limitation of this analysis is that we do not include connections to Politburo members individually, but aggregate this to central party relations generally. We believe the current measure of connections best captures the potential for positive work evaluation—the mechanism behind the connections hypothesis—when compared to alternative measures. A coworking measure would allow future researchers to create a broader measure of connections among central-level party members, but at this time there is insufficient data and high potential for measurement error in comparing the two measurements. Future research, with sufficient data on core central SOE leaders’ work experience before their leadership position, would diversify and broaden our understanding of how political connections relate to mobility. This in turn would enable more fine-grained assessment of SOE leader appointment as an independent treatment on the firm, and the potential for political connections to drive the allocation of connected leaders to those SOEs likely to achieve better economic performance, independent of the effects of the executives.Footnote 71 Finally, additional cross-national research could evaluate the relative effects of political versus economic appointments in contexts with a mix of political- and market-oriented personnel management systems.
Overall, our findings suggest that in contexts where SOEs are highly politically integrated, governments can use personnel power as an instrument to pursue economic and political stability. In China, such stability is a top priority for the party state and the officials whose careers it determines using the cadre management system. Expectations for SOE leaders to deliver on stability are evident in both executive evaluation and official discourse. In the Chinese context, we find that the party state exercises personnel power to support its stability aims by deliberately keeping well-performing SOE leaders in the state-owned economy, retaining individuals who are connected with the leadership of supervising government and party bodies, and rewarding those who accumulate government and party training with transfers to government jobs with the potential for rank-based promotion. In contrast, in countries where SOEs are less integrated with the state apparatus and ruling elites, governments lack such personnel power and the leaders of SOEs are not easily used as tools. Instead, governments in such contexts may rely more heavily on other, more well-known methods—such as regulations, information reporting, and audits—to govern SOEs. By situating our findings about the Chinese case comparatively, we point the way forward for additional empirical analysis of SOE executive appointment systems in other countries.
Studying how governments use executive appointments to govern SOEs is more important than ever because these firms are increasingly active beyond national borders. While SOEs in natural resource industries like oil, gas, and mining have operated worldwide for decades, those in technology-based sectors like automobiles, electricity, nuclear power, transportation, and telecommunications have only recently entered international markets.Footnote 72 Moreover, SOEs in which the government is a majority shareholder and more than half of total assets are located overseas hail from both advanced capitalist and emerging economies, including firms such as Électricité de France, Singapore Telecommunications Ltd., and China Ocean Shipping Company.Footnote 73 In addition to existing scholarship on SOE adaptation to host country institutions and regulations, studying governments’ personnel power over top executives is also essential to understand how globalizing SOEs behave overseas.Footnote 74
Supplementary material
To view supplementary material for this article, please visit https://doi.org/10.1017/bap.2021.5.
Acknowledgements
The authors thank Melanie Manion and Li-an Zhou for their comments on earlier versions of the paper and Zhan Chen, Yingtao Guo, Yufan Huang, Xinwen Lv, Mingwei Xu, and Jingxin Zhou for invaluable research assistance and input. We are also grateful for feedback from participants at the Conference on Political Selection at the National School of Development, Peking University (2018); Harvard-MIT-BU Cambridge Chinese Politics Research Workshop (2018); Harvard Kennedy School Ash Center Asia Fellows Seminar (2018); International Studies Association Annual Meeting (2019); and Indiana University-Chinese Academy of Social Sciences Research Symposium (2019).