Introduction
New green payments across farms within the latest Common Agricultural Policy (CAP) reform and the removal of the EU milk quota system is already resulting in large changes for EU dairy farmers such as a price decline and an increase in raw milk production. Apart from lack of profitability, EU dairy farming is also subject to large pressures to reduce their environmental impact and improve standards of animal welfare. In order to study these issues together, generally, methodologies are either too non-specific (use standard emission factors) or lack the appropriate level of complexity. In this sense, Del Prado et al. (Reference Del Prado, Mas, Pardo and Gallejones2013) developed a modelling framework that coupled models and a life cycle analysis (LCA) in order to analyse N and C flows, and emissions from dairy farms. Using this modelling framework, we aim to analyse the N and greenhouse gas (GHG) emissions from dairy cattle farms in northern Spain and to relate their milk N and C footprint with different sustainability attributes in relation to environmental impacts (eutrophication, acidification, water footprint, etc.) welfare and economic indicators.
Material and methods
Management, animal welfare, economics, weather and soil data from 35 commercial dairy farms located in the Karrantza Valley (northern Spain) were collected in 2013. Dairy cattle farming represents the main economic activity in this area. The climate of this area is classified as maritime with high precipitation all year round (mean=1500 mm) and moderate temperatures. Weather conditions for 2013 were wetter than the average (1677 mm), which led to conditions with high potential denitrification. Using the data from the 35 dairy farms as an input, farm and field scale nutrient modelling was coupled with an LCA analysis through the modelling framework described by Del Prado et al. (Reference Del Prado, Mas, Pardo and Gallejones2013). Modelling was carried out in order to calculate the effect of management and weather conditions on C and N emissions, and other environmental impacts (e.g. water footprint) from the cradle to the farm gate (C and N footprint). This framework simulated the N and GHG emissions occurring at the farm level (on-farm) comprising emissions, both biogenic and non-biogenic, from the farm facilities (housed animals, manure, silage making) and grassland. The assessment also included the pre-chain emissions through purchased concentrates and forages and indirect energy use (synthesis and transportation of mineral fertilisers and purchased feed). The main functional unit of this analysis was 1 kg of energy-corrected milk (ECM). We also included in the analysis the amount of N and GHG emissions emitted as a function of total hectares used including farm forage area and the surface used to crop the purchased feed (i.e. concentrates). Different environmental impact categories were investigated: acidification, eutrophication, global warming (C footprint), water quality, water footprint and land use. Animal welfare was accounted for by recording indicators (e.g. a welfare index, number of lactations per cow, inseminations required per partum, fertility index, etc.). Farm N use efficiency was also calculated as the ratio between the exported and the imported N.
Results and discussion
Management, environmental, economic and animal welfare-related results varied widely amongst farms. Average milk per dairy cow and year was 8300 kg ECM/year (4500 to 11 000 kg ECM/year). The main N inputs to the farm were those related to purchased feed (73% on average, 30% to 95% of total N inputs). GHG emissions (C footprint) ranged from 0.64 to 2.73 kg CO2-eq/kg ECM milk and 2.9 to 8.8 tonnes CO2-eq/ha, which is in the range of existing studies in Europe. The contribution of different sources to the total C footprint varied between farms, but there was a large contribution of embedded emissions from purchased feed 41%±10% (mean±SD), CH4 from rumen (37%±5%) and manure management (5%±5%), and N2O from on-farm soils (12%±5%). Total average N losses were as follows: 19.2 g N/kg ECM milk (NH3), 9.4 g N/kg ECM milk (NO3 −), 1 g N/kg ECM milk (N2), 0.7 g N/kg ECM milk (N2O) and 0.3 g N/kg ECM milk (NO x ). Ammonia (63%±6%) followed by NO3 − leaching (31%±4%) comprised most of the N losses from the total N footprint.
Most area used to produce milk was associated with the production of concentrates and not on-farm forage area (on average, 70% of total hectare used to produce 1 l of milk). Water footprint was on average 1.38 tonne water/kg ECM milk (0.92 to 2.78 tonne water/kg ECM milk). The welfare and fertility indices varied between 14% to 82%, and 5% to 32%, respectively. Net margin per litre of milk varied between 0 and 0.26 €/l of milk.
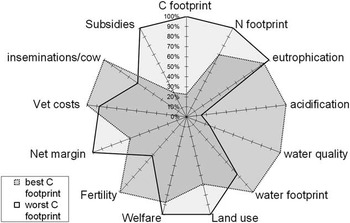
Trade-offs were observed amongst sustainability results when comparing farms. Figure 1 illustrates as an example that whereas the farm with the best C footprint is more sustainable than the farm with the worst C footprint in terms of C and N footprint, eutrophication, land use, welfare index and net margin, the opposite is found for acidification, water quality and footprint, fertility index and number of inseminations required per dairy cow.
Comparison among the farms with best and worst C footprint for selected variables indicating environmental pollutants and other sustainability attributes. Absolute results have been normalised to represent the relative difference between farms for each variable. Lower values imply higher sustainability performance.

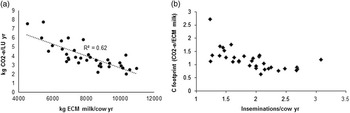
Relationship between milk productivity and greenhouse gas (GHG) emissions per unit of LU (a) and between inseminations/cows required for a partum and GHG emissions per unit of energy-corrected milk (ECM) (b).

The C footprint was positively correlated with on-farm N2O emissions (R 2=0.91; P<0.001) but not to CH4 output or concentrates greenhouse gas (GHG) footprint. GHG emissions per Livestock Units (LU) decreased with animal milk yield (Figure 2a). Although not statistically significant, decreasing GHG emissions per unit of milk energy-corrected milk was associated with an increase in the number of insemination required per partum (Figure 2b). As an initial explanation we may speculate, as we do not have definite results to support this idea, that some of the farms with lower C footprints tended also to be large farms with less total labour per animal (data not shown).
Other animal welfare or economic indicators (e.g. number of cows above third lactation, vet costs) were not correlated with either the C or N footprint.