


Introduction
Jökulhlaups: characteristics, significance, and state of the art
Paroxysmal outbursts of glacier-derived floodwater represent the most forceful hydrologic perturbations to affect glaciated regions. Such events are known by the expressive Icelandic term ‘jökulhlaup’ (Reference RobertsRoberts, 2005). By convention, a jökulhlaup is a substantial volume of meltwater that bursts from a glacier, yielding a river discharge in excess of the upper perennial boundary of glacier-melt-dominated river flow (e.g. Reference Post and MayoPost and Mayo, 1971). The thermodynamic result of floodwater flow through ice produces a rapid, monotonic rise in river discharge over a period of hours to several days (Reference NyeNye, 1976; Reference Spring and HutterSpring and Hutter, 1981; Reference ClarkeClarke, 1982). The rapidity of the rise to maximum discharge largely determines the geomorphic effectiveness and risk potential of jökulhlaups (Reference Evans and ClagueEvans and Clague, 1994). Large, sporadic jökulhlaups account for most flood-related fatalities and damage to infrastructure within stricken catchments (e.g. Reference Walder and CostaWalder and Costa, 1996). Jökulhlaups originate typically from a melt-water source either on, in, beneath or adjacent to a glacier. These locations are defined by zones of meltwater convergence, coincident with hydraulic and topographic conditions for unstable accumulation of meltwater (Reference BjörnssonBjörnsson, 1976).
The hazardous nature and physical complexity of jökulhlaups has inspired several path-breaking studies that have collectively elucidated the physics governing floodwater flow through glaciers (e.g. Reference MathewsMathews, 1973; Reference NyeNye, 1976; Reference Spring and HutterSpring and Hutter, 1981; Reference ClarkeClarke, 1982, Reference Clarke2003). Additionally, sensor-based measurements have allowed researchers to glean insight into the conditions required for jökulhlaup initiation (Reference ClarkeClarke, 1982; Reference BjörnssonBjörnsson, 2002; Reference AndersonAnderson and others, 2003). There is a growing realization that jökulhlaup timing is largely unrelated to the maximum permissible hydrostatic pressure that a meltwater body can exert on an ice dam. The hydromechanical reality of jökulhlaup initiation is considerably more perplexing, as manifested by jökulhlaup regimes that have altered due to increasing meltwater production and decreasing ice-damming capacity in today’s warming climate (e.g. Reference ThórarinssonThórarinsson, 1939; Reference AndersonAnderson and others, 2003). As a result of such changes, it is likely that jökulhlaups will occur more frequently in future (Reference Evans and ClagueEvans and Clague, 1994). The possibility of more irregularities in jökulhlaup timing also imposes a need for better observations of ice–water interactions in the inlet and outlet zones of flood tracts from ice-marginal, ice-dammed lakes. Such empirical data would increase the feasibility of accurate forecasts of the timing and intensity of jökulhlaups (Reference ClarkeClarke, 2003). Moreover, contemporary observations of decaying ice-dammed lakes are relevant to the latest hypotheses concerning the demise of glacial Lake Agassiz during shrinkage of the Laurentide ice sheet (Reference Clarke, Leverington, Teller and DykeClarke and others, 2004).
Grænalón and the purpose of this study
Iceland contains an abundance of glaciers prone to frequent jökulhlaups, with subglacial reservoirs and ice-marginal lakes dominating as flood sources (Reference ThórarinssonThórarinsson, 1939; Reference BjörnssonBjörnsson, 1992). Skeiðarárjökull is a surge-type piedmont glacier, roughly 1400 km2 in area, encompassing Grímsvötn and Grænalón, two of the most famous and active jökulhlaup systems (Fig. 1). Grænalón occupies a subaerial valley whose outlet is largely obstructed by the flank of Skeiðarárjökull, a situation that has prevailed since at least AD 1200 (Fig. 2) (Reference ThórarinssonThórarinsson, 1939). Climate-induced thickening and advance of Skeiðarárjökull increased the damming capacity of the glacier flank, providing conditions for voluminous meltwater storage (Reference ThórarinssonThórarinsson, 1974). In the early 20th century, Grænalón was the largest subaerial lake in the world capable of draining subglacially (see Reference Walder and CostaWalder and Costa, 1996, table 1).
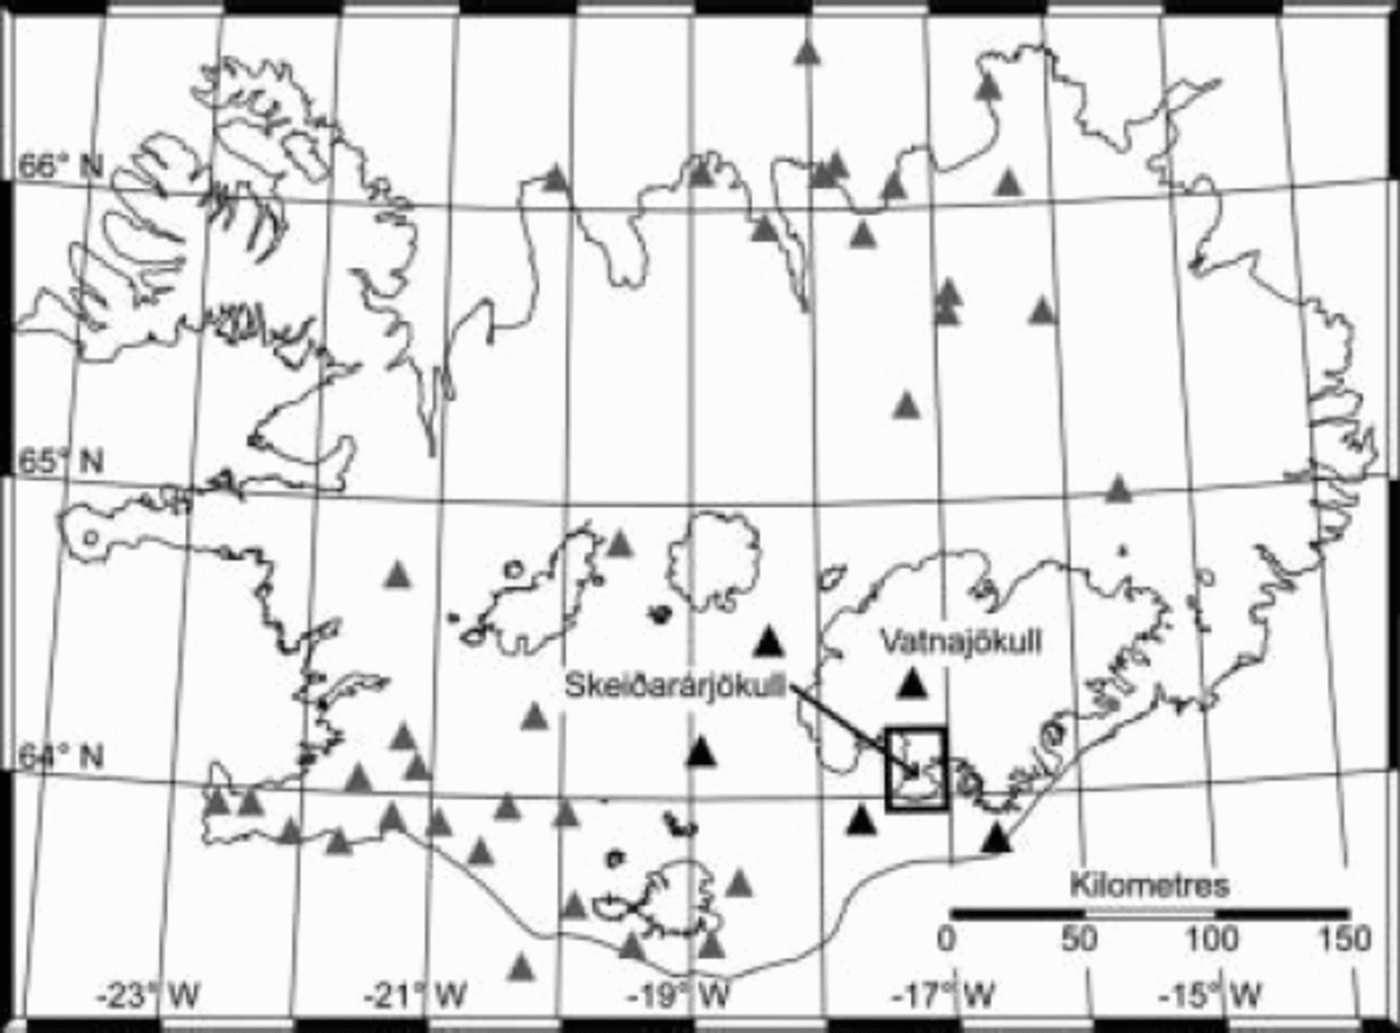
Geographic location of Skeiðarárjökull and the regional seismic network used in this study. The map projection is Lambert Conformal Conic, with geographical coordinates overlaid. The frame around the lower part of Skeiðarárjökull denotes the extent of Figure 2. Triangles represent the location of seismic stations, with those used for detecting glacier seismicity highlighted black.
Schematic map of the thickness of Skeiðarárjökull, showing the location of control structures on the flood route from Grænalón. The map projection is Lambert Conformal Conic and data are referenced to the ISN93 datum. Profiles of transects A–B and C–D are presented in Figures 3 and ˚, respectively. The depicted flood route maximizes the gradient in subglacial hydraulic pressure. The course of the first 2 km of the flood route is known from observations of a sinuous depression in the ice surface.

The documented history of Grænalón reveals significant, long-term changes in jökulhlaup timing and intensity, reflecting the adaptation of Grænalón and its drainage mechanisms to a thinning ice dam. The purpose of this paper is to explore changing ice–water interactions during jökulhlaups from Grænalón. Herein we (i) synthesize the jökulhlaup history of Grænalón; (ii) present geomorphic observations and geophysical measurements from the inlet and outlet zones of the subglacial flood tract; and (iii) evaluate the hydromechanical factors governing the dynamic character of jökulhlaups from Grænalón.
Research Procedure
Time-series data on the surface elevation of Grænalón and the subsequent release of jökulhlaups from the lake were compiled from data reports (Reference Rist and ThórarinssonRist and Thórarinsson, 1970; Reference RistRist, 1973, Reference Rist1976, Reference Rist1981, Reference Rist1984; Reference Sigurðsson, Snorrason and ZóphóníassonSigurðsson and others, 1992). Survey data, collected the last time the lake drained entirely in 1935, were used to constrain basin elevations and the maximum elevation of Grænalón (Reference ÁskelssonÁskelsson, 1936). In addition, we used a hypsometric relation for Grænalón to approximate the volume of meltwater released during well-documented jökulhlaups (Reference Björnsson and PálssonBjörnsson and Pálsson, 1989). Lake and ice-dam conditions were deduced from oblique aerial photographs taken at least once a year since July 1998. Since October 2001, we have obtained annual elevation profiles of Grænalón and Skeiðarárjökull using an aircraft-mounted Collins ALT-50TM radar altimeter whose exact position was recorded continuously using a kinematic global positioning system. Within the survey area, the minimum elevation accuracy of these combined measurements was ±2m.
Since 2001, jökulhlaup propagation has been recorded using real-time seismic results from a permanent, regional configuration of three-component digital seismometers, intended to detect micro-seismicity from tectonic sources (Fig. 1) (Reference BöðvarssonBöðvarsson and others, 1996). To test the premise that glacier-derived seismicity accompanies the drainage of Grænalón, we collated eyewitness observations of jökulhlaups in Núpsvötn, the ungauged river conveying floodwater from Grænalón. Lastly, to determine the thermodynamic state of floodwater nearing the glacier terminus, we deployed a RBR TR-1050TM temperature sensor directly into an artesian floodwater vent on the late waning stage of a jökulhlaup from Grænalón (Fig. 2). This device contained a newly calibrated 24-bit ThermometricsTM thermistor with an accuracy of ±0.002˚C and an operating range spanning –40 to 35˚C. The length and gradient of the subglacial flood tract were derived from a digital elevation model of the bed and surface of Skeiðarárjökull, computed from radio-echo sounding data collected between 1994 and 1998 (University of Iceland, unpublished data).
Results
Jökulhlaups from Grænalón
It is reputed that the first jökulhlaup from Grænalón occurred as early as 1201 (Thórarinsson, 1939). Records state the occurrence of a second jökulhlaup in 1785, but several floods between 1201 and 1785 are probable. In 1898, a jökulhlaup comprising ∼2×10⁹m3 of floodwater attained a maximum discharge of ∼5000m3 s–1 within 4 days, causing one fatality and significant degradation of farmland (Reference ÁskelssonÁskelsson, 1936; Reference ThórarinssonThórarinsson, 1974). Jökulhlaups of similar intensity, duration and impact occurred in 1913, 1935, 1939, 1943, 1946 and 1949. Between 1785 and 1939, a col at ∼640ma.s.l. on the southern side of Grænalón governed the maximum elevation of the lake (Figs 2 and 3) (cf. Reference ClarkeClarke, 1982). Throughout this period, jökulhlaups drained subglacially via an inlet at the lowest elevation of the lake bed, thus enabling full drawdown (Fig. 3) (Reference ÁskelssonÁskelsson, 1936; Reference ThórarinssonThórarinsson, 1939). The col was abandoned permanently as a spillway during the 1939 jökulhlaup.
Profile view of transect A–B, as depicted in Figure 2. The 1935 profile and the lake-bed outline are sourced from Reference ÁskelssonÁskelsson (1936). Profiles of the contemporary surface of Skeiðarárjökull and the glacier bed are derived from radar altimetry measurements and a digital elevation model, respectively.

The next jökulhlaup occurred in 1951, but instead of coursing beneath the ice dam, floodwater cascaded over an ice buttress projecting from the western flank of Skeiðarárjökull at the southeast corner of Grænalón (Figs 2 and 4) (Reference ThórarinssonThórarinsson, 1974). Floodwater then accumulated in a rock–ice trench, flanking ∼3 km of Skeiðarárjökull, before entering subglacial drainage through a thermally carved inlet (Figs 2 and 4) (cf. Reference Sturm and BensonSturm and Benson, 1985). The resulting flood comprised ∼3×10⁸m3 of water, produced a maximum discharge of ∼2000m3 s–1 and lasted for 7 days (Reference ThórarinssonThórarinsson, 1974). From 1951 to 2003, ice–water interactions at the ice buttress resulted in 37 jökulhlaups from Grænalón (Fig. 5). During this period, the trench down-glacier from the ice buttress served repeatedly as a watercourse for floodwater draining into Skeiðarárjoäkull. However, in 1986 most floodwater took an entirely subaerial route to the glacier terminus, bypassing the inlet (Reference Sigurðsson, Snorrason and ZóphóníassonSigurðsson and others, 1992). The unusual path of the 1986 jökulhlaup can be explained by a progressive 15m increase in lake surface elevation since approximately 1973 (Fig. 5); on draining into the trench, floodwater would have risen to ∼45m above the inlet location at ∼535ma.s.l.
Oblique aerial photograph of Grænalón taken on 8 July 2002, 4 days after a jökulhlaup peaked from the lake. The view is northward, and features discussed in the text are highlighted (see also Fig. 2). At the time of the photograph, the surface elevation of Grænalón was 524ma.s.l., corresponding to a lake volume of ∼5×10⁸m3.

Time-series plot of the surface elevation of Grænalón and the cumulative number of observed jökulhlaups from the lake since 1898. Jökulhlaup timing is based on the observed incidence of maximum discharge. Cross-hair size is proportional to the maximum error associated with the elevation measurements (±8 m).
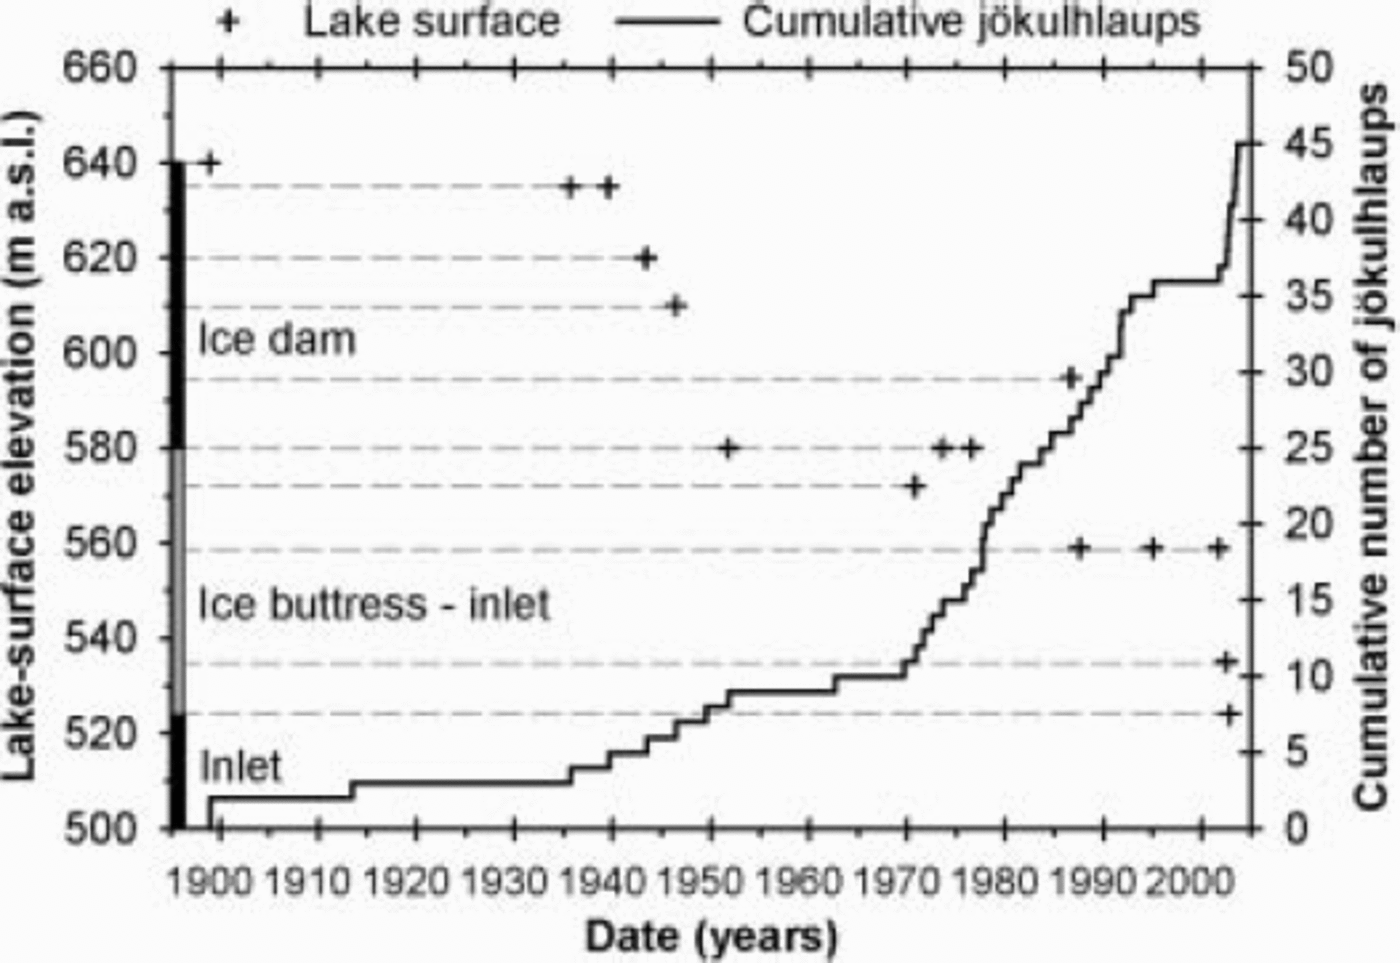
Successive jökulhlaups between 1943 and 2003 lowered the surface of Grænalón by 58m (Fig. 5), equivalent to a volume reduction of ∼5.8×10⁸m3. In 2001 Grænalón lowered suddenly by ∼24 m, sufficient to cause permanent abandonment of the inlet that had prevailed since 1951 (Fig. 2). Subsequent jökulhlaups forced the creation of a new inlet at ∼520ma.s.l., located 2 km down-glacier from the ice buttress (Figs 2 and 4). Jökulhlaups after 2001 were the product of 3–5m of drawdown relative to the 520m datum, corresponding to a source volume of ∼6×10⁶m3 and a resultant maximum discharge of ∼100–300m3 s–1 at the glacier terminus. In May 2003 the ice buttress was reduced to a narrow rib, and by October 2003 the buttress had disappeared. Presently, the watercourse to the inlet is unimpeded.
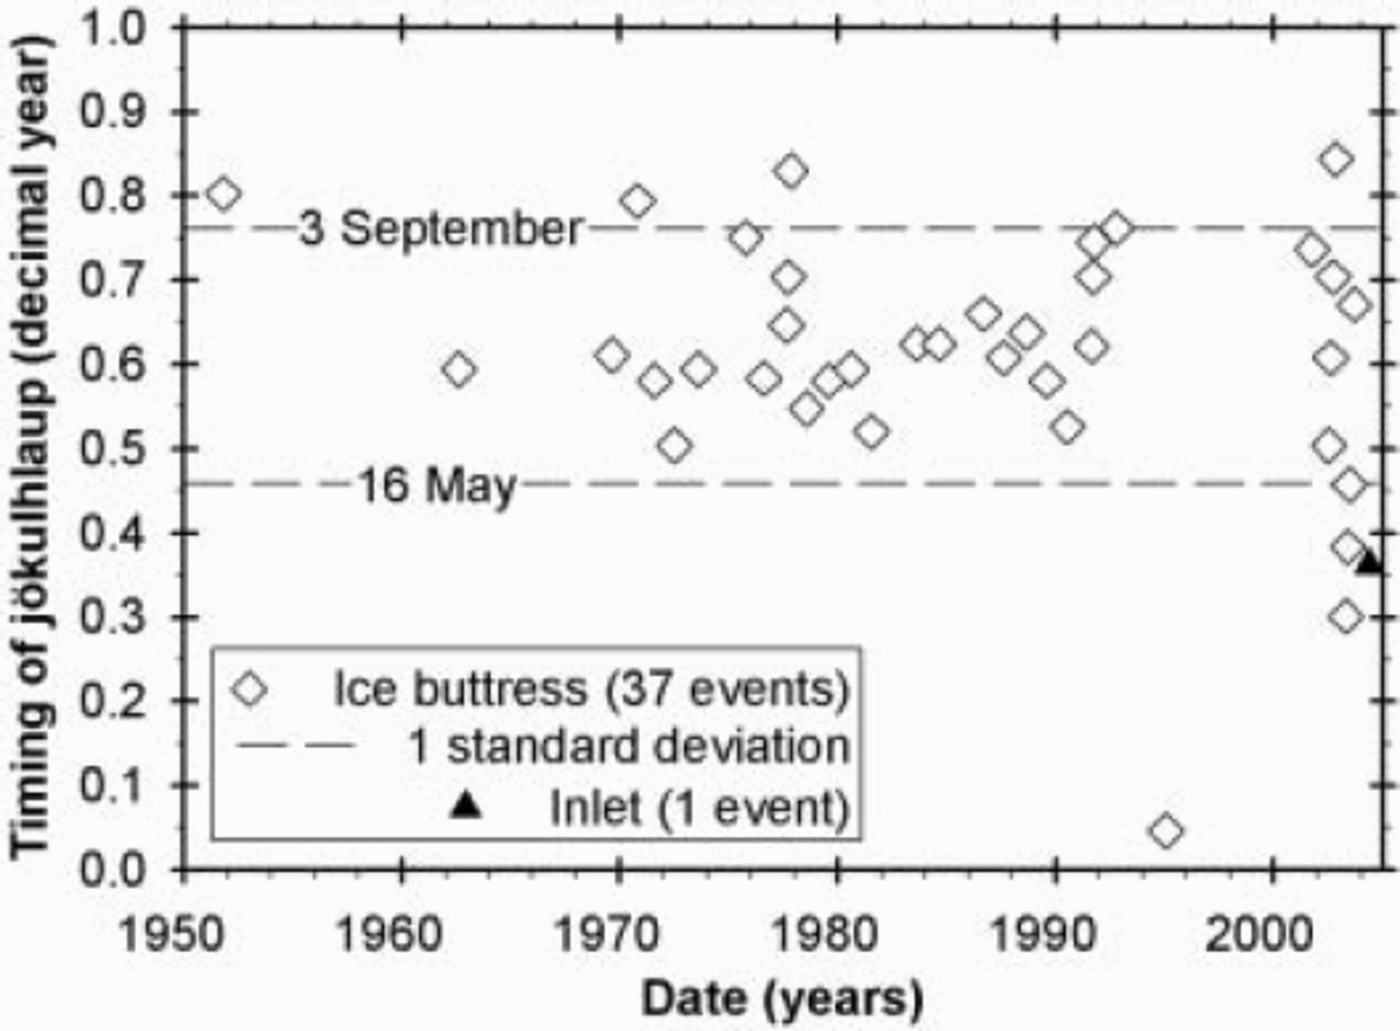
Changes in the elevation of Grænalón were accompanied by alterations in jökulhlaup cyclicity and seasonal timing. Excluding the 1201 and 1785 jökulhlaups, drainage via the ice dam took place on average every 9 (±7) years, and, for the 52 year time-span of the ice buttress, jökulhlaups occurred on average every 1 (±2) year (Fig. 6). During 2002 and 2003, Grænalón drained with unusual regularity (Fig. 5). Five small jökulhlaups occurred between July and November 2002 with an average return interval of 33 (±5) days. Similarly, in 2003, four jökulhlaups were separated by an average period of 44 (±23) days. Large variations in the seasonal timing of jökulhlaups between 1951 and 2004 are apparent. From 1951 to 1992, jökulhlaups occurred between mid-May and mid-September (Fig. 6). However, from 1992 onwards, jökulhlaups were scattered from January to November, with a trend toward flooding earlier in the year (Fig. 6).
Time-series plot of the cyclicity and seasonal timing of jökulhlaups from Grænalón during the time-span of the ice buttress. Jökulhlaup timing is based on the observed incidence of maximum discharge.
Field observations and measurements
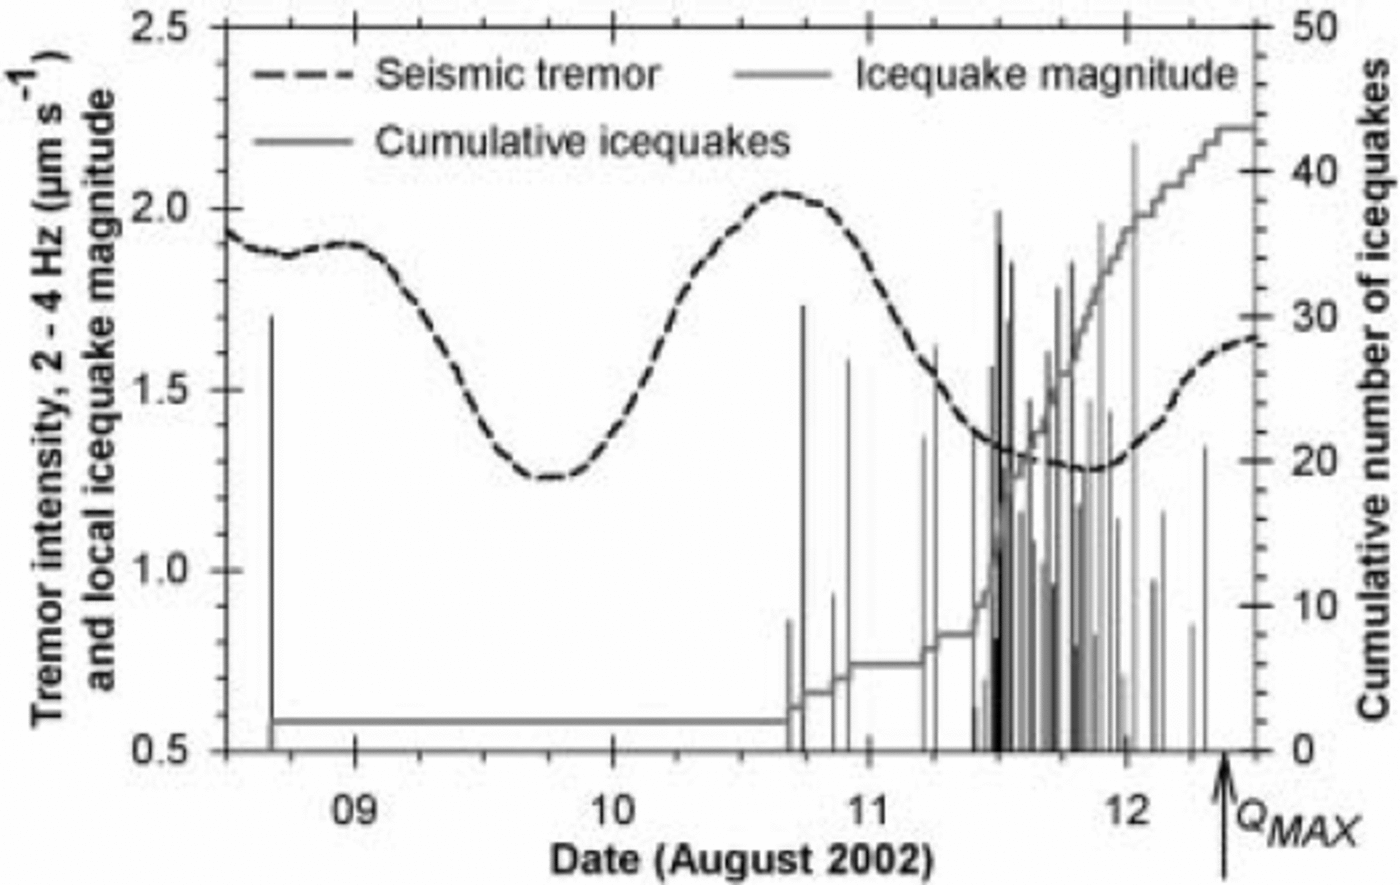
Grænalón has drained on ten occasions since 2001, and the ensuing jökulhlaups were attended by anomalous periods of continuous seismic tremor, registered by two seismometers sited 26–30km from Grænalón (Fig. 1). This seismicity was mainly in the 2–4 Hz frequency band and temporally coincident with icequake swarms within a seismogenic zone encompassing the area of Skeiðarárjökull down-glacier from Grænalón (Fig. 7). Episodes of glacier-sourced seismicity were used as a prompt to reconnoitre the inlet and outlet zones of the subglacial tract from Grænalón.
Time-series relationship between glacier-derived seismicity and the timing of maximum observed flooding from Grænalón in August 2002 (denoted by Q MAX). Tremor data were smoothed using a running-medium transform and are based on the vertical component of measurements made continuously at Grímsfjall, 26 km from Grænalón (Fig. 1). The minimum accuracy of the magnitude derivations is ±0.5. Two phases of subglacial floodwater movement are inferred, corresponding to the peaks in tremor intensity on 9 and 10 August.
During jökulhlaups since 2001, a cluster of seven to ten subglacial vents has erupted along an 800 m wide sector of the glacier terminus (Fig. 2). As each jökulhlaup intensified, turbid floodwater gushed ≤1m into the air, implying a maximum exit velocity of ∼4ms–1. Since 2001, floodwater has propagated 13.4 km beneath Skeiðarárjökull, and the deepest section of the subglacial flood tract is 4.2 km up-glacier from the vent region (Figs 2 and ˚). Between this zone and the glacier terminus, the tract gains ∼500m in elevation, resulting in the glacier bed slope being opposed to the glacier surface slope by a factor of 1.7 (Fig.8.) (cf. Reference Alley, Lawson, Evenson, Strasser and LarsonAlley and others, 1998). Assuming a constant velocity of 4 ms–1, the minimum time for floodwater to travel directly from the deepest part of the subglacial basin to the glacier terminus is ∼17.5 min. On the late waning stage of a 3 day jökulhlaup from Grænalón in July 2002, we measured the temperature of artesian floodwater for a period of 2.7 hours (Fig. 9). Throughout this period, an average temperature of –0.006˚C (±0.002) prevailed, in contrast to regional air temperatures of ∼8˚C. Repeat temperature measurements in a nearby vent that was unaffected by waning-stage efflux yielded an average reading of 0.000˚C (±0.002) (see Reference Tweed, Roberts and RussellTweed and others, 2005) over the same time-span.
Profile view of transect C–D, as depicted in Figure 2, illustrating the subglacial tract for jökulhlaups from Grænalón.

Time-series plot of floodwater temperature at an artesian vent on ° July 2002; see Figure 2 for the vent location. Error bars signify the measurement accuracy (see text for details).

Discussion
Ice–water interactions at Grænalón
From at least 1898 to 1949, Grænalón emptied subglacially when hydrostatic pressure at the base of the ice dam reduced the potential barrier to within ∼3 km of the lake (Fig. 3) (Reference BjörnssonBjörnsson, 1976, Reference Björnsson1992). We conjecture that a hydraulic connection was introduced prematurely through the barrier due to lake water tapping into basal crevasses. Between 1951 and 2003, the surface elevation of Grænalón was governed by the size and configuration of the ice buttress. Under this regime, likely drainage processes at the ice buttress included hydrostatic flotation, unstable down-cutting of ice caused by supraglacial overspill, and subaerial breach-widening at the rock–ice contact (Reference ThórarinssonThórarinsson, 1974; Reference BjörnssonBjörnsson, 1976; Walder and Costa, 1996; Reference Raymond and NolanRaymond and Nolan, 2000). Following the demise of the ice buttress, lake level has been controlled solely by glaciohydraulic conditions in the region of the inlet (cf. Reference AndersonAnderson and others, 2003). This circumstance results in less cyclic, more frequent jökulhlaups that are ∼50 times smaller in volume than those regulated by the ice buttress. We suggest that the high sensitivity of the present inlet to minor increases in lake surface elevation allows water to leak almost continuously into subglacial drainage; this view is consistent with escalated icequake activity in Skeiðarárjökull since October
2003 (Icelandic Meteorological Office, unpublished data).
Ice–water interactions at the glacier terminus
Jökulhlaups from Grænalón drain into an overdeepened subglacial basin, where the effect of negative effective pressure drives floodwater toward the glacier terminus. Assuming a pressure-melting-point dependency of –7.5×10⁻⁵˚C kPa–1, pure water in dynamic storage in the deepest part of the subglacial flood tract (∼500m ice thickness) has an ambient freezing point of –0.33˚C. Temperature measurements of artesian floodwater at the glacier terminus gave a mean value of –0.006˚C (–0.0002). This value is thermodynamically reconcilable with the estimated transit time of floodwater from the deepest part of the subglacial basin and glaciostatic stresses in the vent region. During periods of maximum efflux, however, subglacial floodwater gains potential energy much faster than it can be transformed to sensible heat, allowing floodwater to supercool whilst ascending to the glacier terminus (Reference ShreveShreve, 1985; Reference Alley, Lawson, Evenson, Strasser and LarsonAlley and others, 1998). Supercooling acts to roughen and throttle flood conduits due to the growth and ice-wall adhesion of sediment-bearing frazil ice (Reference ShreveShreve, 1985). This process could explain why several high-capacity floodwater vents coexist within a narrow sector of the glacier terminus during jökulhlaups.
Dynamic character of jökulhlaups from Grænalón
Jökulhlaups from Grænalón have evolved from large, infrequent events typified by complete drawdown to smaller, more common events involving ∼1% of the lake’s volume. Thinning of the ice dam by ∼70m since the beginning of the 20th century has progressively reduced the volume of Grænalón by 75%. This decay has resulted in three elevation-controlled drainage regimes governed by: the ice dam (1201–1949; 640–580ma.s.l.), the ice buttress (1951–2003; 580–522ma.s.l.) and the inlet (≥2004; <522ma.s.l.). The first two drainage regimes were each characterized by a steep rise in jökulhlaup activity, accompanied by a nonlinear decrease in jökulhlaup magnitude over time (Fig. 5). But what will the future response of Grænalón be under the third drainage regime? We propose that minor jökulhlaups will recur as a consequence of ice–water interactions in the region of the inlet until Grænalón no longer extends into the rock–ice trench. During this period, as Grænalón approaches the threshold of stability, it is likely that jökulhlaups of diminishing intensity will occur sporadically in response to increasing hydraulic sensitivity in the region of the inlet. After abandonment of the trench, Grænalón will be incapable of producing jökulhlaups until thinning of the contiguous ice dam yields a glaciostatic stress equivalent to the deepest part of the lake (Reference ThórarinssonThórarinsson, 1939; Reference BjörnssonBjörnsson, 1976). Grænalón will then revert to a pressure-coupled reservoir, capable of draining subglacially; however, the volume and maximum discharge of the resultant jökulhlaups are unlikely to surpass values recorded during the existence of the ice buttress.
Concluding Remarks and Implications
The foregoing results and analysis support the following conclusions:
To date, three distinct drainage regimes have prevailed at Grænalón in response to the changing elevation of the lake. Evolving ice–water interactions were a catalyst for each regime change.
The shift from one drainage regime to another was associated with pronounced changes in jökulhlaup magnitude, timing and cyclicity.
Jökulhlaups from Grænalón have evolved from large, infrequent events that emptied the lake to smaller, more common events involving a minor fraction of the lake’s volume.
The maximum hydraulic potential of Grænalón has fallen increasingly short of the pressure trigger required for subglacial drainage via the ice dam. Since 1951, lake water has decanted into Skeiðarárjökull via a rock–ice trench along which various ice barriers have persisted temporarily.
Floodwater exits Skeiðarárjökull in a supercooled state due to rapid displacement from a terminal overdeepening where ice thickness reaches ∼500 m. The glaciohydraulic importance of supercooled floodwater remains an unresolved issue.
Our findings suggest that Grænalón behaves as a dynamic, feedback-driven system, capable of attaining metastable equilibria in time and space. This interpretation contradicts the parsimonious view that a single drainage mechanism is applicable throughout the existence of an ice-dammed lake. Grænalón is an exemplar of the demise of modern and ancient ice-dammed lakes; future paleohydraulic studies should explore the hydrologic significance of ice–water interactions made apparent by this study. Furthermore, recasting our findings in numerical form may help to sharpen existing theoretical models of jökulhlaup hydraulics.
Acknowledgements
For relevant funding, we acknowledge the Icelandic Public Roads Administration, the Icelandic National Energy Authority and the Earthwatch Institute. We express gratitude to R.F. Kristjánsson, S. Guðbjörnsson and M. Ómarsdóttir for field assistance and research support. This paper was improved substantially following review comments from R.S. Anderson and M.J. Sharp, together with editorial guidance from J.V. Johnson.



