Septicemia, or sepsis caused by bacterial bloodstream infections, is associated with high mortality; it results in an estimated 200,000 deaths annually in the United States.Reference Fleischmann, Scherag and Adhikari 1 – Reference Deutschman and Tracey 6 Early diagnosis and treatment of sepsis are important for improving patient outcomes, and blood cultures are considered the gold standard for detecting bacteremia. Given the challenge of predicting patients at risk of developing bacteremia, there is a low threshold for clinicians to order blood cultures.Reference Coburn, Morris, Tomlinson and Detsky 7 , Reference Hall and Lyman 8 The low yield of blood cultures in many clinical settings suggests that some testing may be unnecessary.Reference Coburn, Morris, Tomlinson and Detsky 7 , Reference Paolo, Poreda, Grant, Scordino and Wojcik 9 – Reference Velasco, Martinez and Moreno-Martinez 13 Improving blood culture utilization is important for ensuring timely detection of bacteremia while minimizing potential harms associated with overutilization of blood cultures, such as inappropriate antibiotic therapy or increased length of stay.
Utilization practices have been relatively underexplored, and the factors that affect blood culture ordering are not well understood. In addition, blood culture utilization has not been well quantified, and only a few studies have published utilization rates per patient.Reference Woods-Hill, Fackler and Nelson McMillan 14 – Reference Willems, Smismans and Cartuyvels 16 While there are some guidelines for blood culture utilization, they do not provide clear indications for obtaining blood cultures, and many recommendations lack a consensus among different professional organizations.Reference Miller, Binnicker and Campbell 17 – Reference Baddour, Wilson and Bayer 19 The level of evidence for some recommendations is low, indicating a need for more rigorous evaluations of these existing guidelines.
In this study, we analyzed the effect of medical service on utilization patterns (total number and frequency of blood cultures, use of repeat cultures following a true-positive culture, and number of sets drawn per day). We found that utilization patterns differed by medical service and, to some extent, culture results. Characterizing the pattern of blood culture utilization is an important step toward determining the appropriate quantity and frequency of blood cultures that should be obtained. These results may ultimately inform the development of evidence-based guidelines for the appropriate use of blood cultures and benchmarks to evaluate the clinical effectiveness of these tests.
Methods
Data sources
This retrospective study was conducted at the Hospital of the University of Pennsylvania (HUP), a 789-bed tertiary-care hospital in Philadelphia, Pennsylvania. Blood cultures sets collected between July 1, 2014 and June 30, 2015, were obtained from the Clinical Microbiology Laboratory information system (Cerner, Kansas City, MO), and additional encounter data were obtained from the Clinical Effectiveness and Quality Improvement (CEQI) division at HUP. The University of Pennsylvania Institutional Review Board approved this study.
Study population
During the study period, there were 36,737 admissions to HUP, and a total of 45,767 blood culture sets were processed in the Clinical Microbiology Laboratory. We excluded any blood culture sets that were not drawn at HUP (n=1 set), cultures with no corresponding encounter data from the CEQI database (n=3,243 sets), blood culture sets not drawn from inpatients (944 sets), and blood culture sets with missing data (n=2,640 sets). Blood culture sets drawn in emergency services from patients who were not admitted to an inpatient service were excluded. The final data set consisted of 38,939 blood culture sets drawn from 7,174 inpatients across 9,511 distinct encounters.
Blood sample collection for blood culture
Blood culture were either drawn by a dedicated phlebotomy team (45.3%), or by nurses or physicians. Special prepackaged collection kits were not used. A diversion (discard) tube was used. The phlebotomy team only drew blood for peripheral blood cultures. Nurses and physicians collected blood either peripherally or from central lines. Chlorhexidine gluconate was used for disinfection of the venipuncture site.
Study definitions
For this study, a set of blood cultures consisted of 1 aerobic and 1 anaerobic BACTEC bottle (Becton Dickinson, Sparks, MD). A hospital encounter was defined as a distinct inpatient visit in the hospital, as determined by a unique financial number in the billing system. Length of stay was calculated using the corresponding admission and discharge dates.
A true-positive blood culture was defined as the isolation of an organism generally considered to be a pathogen (in any number of blood culture sets)Reference Weinstein, Towns and Quartey 20 or that is not a contaminant as defined by Clinical Laboratory and Standards Institute (CLSI) criteria. 21 The identification of >1 microorganism species in blood culture sets collected within a 24-hour period was considered a polymicrobial infection. We used the CLSI criteria for contaminants in this study. 21 Blood culture sets obtained following the first true-positive blood culture within an encounter were considered repeat cultures. Persistent bacteremia was defined as the detection of the initial organism in repeat cultures drawn 2–7 days after the initial positive culture.Reference Wiggers, Xiong and Daneman 22 No detection of the initial organism was defined as cleared bacteremia.
Each encounter was associated with a single admitting service. Services were grouped into the following categories: emergency (trauma); surgery (anesthesia, cardiac surgery, emergency surgery, gastrointestinal surgery, neurosurgery, plastic surgery, surgical oncology, surgery, thoracic surgery, and vascular surgery); oncology (oncology, oncology liquid, and oncology solid); transplant; and general medicine (colorectal, cardiovascular, family medicine, family medicine obstetrics, gastroenterology, gynecology, hematology, hospitalist, infectious disease, long-term acute care, medicine, neurology, obstetrics, otolaryngology head/neck, oral maxillofacial, orthopedic, otorhinolaryngology, physical medicine and rehabilitation, pulmonary, and urology). Principal diagnoses were based on hospital discharge diagnosis coding using International Classification of Disease, Ninth Revision (ICD-9) codes. Each hospital encounter was coded with one principal diagnosis. The ICD-9 codes were grouped into the following categories:
Catheter-related infections: 996.64, 996.68, 999.31, 999.32, 999.33
Central nervous system (CNS) infections: 320.2, 320.9, 322, 322.9, 323.81, 324, 324.1
Endocarditis: 391.1, 410.71, 421, 421.9, 424.9
Intra-abdominal infections: 567.21, 567.22, 567.23, 567.29, 567.31, 567.38, 569.61
Neutropenia: 288, 288.01, 288.03, 288.04
Sepsis/bacteremia: 3.1, 38, 38.1, 38.11, 38.12, 38.19, 38.2, 38.3, 38.4, 38.41, 38.42, 38.43, 38.44, 38.49, 38.8, 38.9, 112.5, 790.7
Skin and soft tissue infections: 35, 680.3, 681, 681.01, 681.02, 681.1, 682, 682.1, 682.2, 682.3, 682.4, 682.5, 682.6, 682.7, 682.8, 682.9, 683, 684, 686.01, 686.8, 686.9, 704.8
Urologic infections: 590.1, 590.2, 590.8, 596.81, 599
Diseases of circulatory system: 390–459, excluding codes for endocarditis
Neoplasms: 140–239
Other infectious diseases: ≤139, excluding codes for sepsis and skin and soft-tissue infections
Diseases of respiratory system: 460–519
Injury/Trauma: 800–999.9, excluding codes for catheter-related infections
Other: All other codes not specified.
Statistical analysis
We conducted univariate and bivariate analyses of the number of sets by 24-hour period, by hospital encounter, by medical service, and by culture result. We also calculated the overall yield of blood cultures and the contamination rate. For each encounter, we calculated the interval (in days) between cultures obtained during separate 24-hour periods. For each encounter with at least one true-positive result, we summed the number of repeat cultures drawn and calculated the remaining length of stay. We analyzed the number and results of repeat cultures drawn 2–7 days after the initial positive culture to determine whether the bacteremia had cleared. A χ2 test was used to compare the number of sets obtained within 24-hour periods by medical service, as well as the true-positive rate of sets drawn by service and by diagnosis.
For all models, a likelihood-ratio test was used to determine significant covariates to include in the final model. A P value <.05 was considered statistically significant. A negative binomial model was used to compare the rates of obtaining repeat cultures, to account for overdispersion in the data. The initial organism and medical service were included as covariates, and the remaining length of stay was used as an offset to account for different lengths of time spent in the hospital. The area under the receiver operating characteristic curve (AUC) was assessed based on logistic regression models. For mixed-effects logistic regression models, hospital encounter was included as a random effect. The model fit for mixed-effects models was assessed using the Diagnostics for HierArchical Regression Models (DHARMa) package, which uses a simulation approach to create interpretable residuals.Reference Hartig 23 All statistical analyses were performed in R using RStudio. 24 , 25
Results
Characteristics of data set
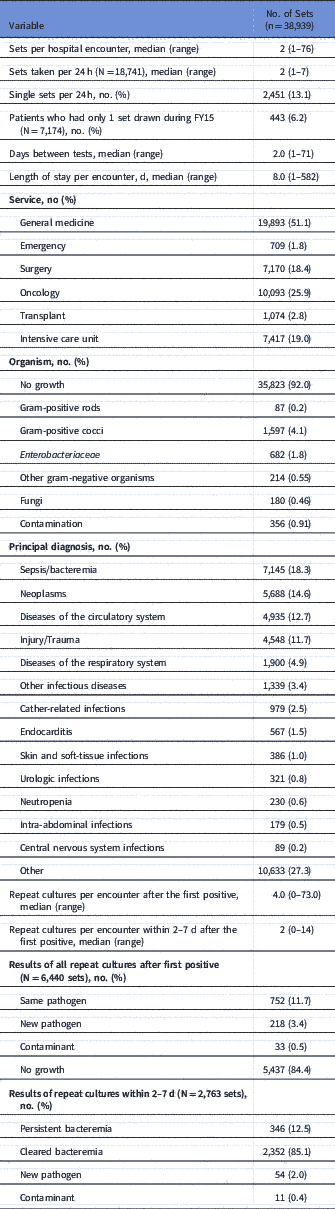
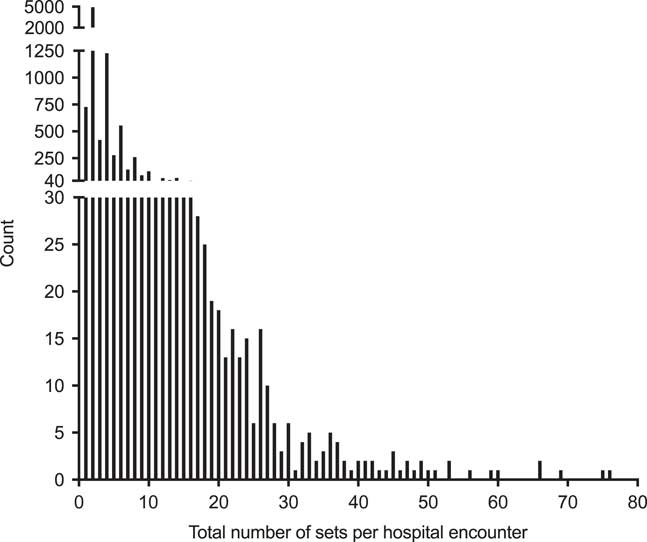
The final data set consisted of 38,939 sets of blood cultures drawn from 7,174 inpatients during 9,511 distinct hospital encounters across 35 different medical services (Table 1). The median length of stay for a hospital encounter was 8 days (range, 1–582 days). Services were grouped into the following categories: general medicine, emergency, surgery, oncology, and transplant. For patients who entered an emergency service and were later admitted as an inpatient, all blood cultures were assigned to the admitting service. Principal diagnosis codes were grouped into 1 of 14 different categories, and the following groups accounted for the greatest number of sets: sepsis/bacteremia, neoplasms, and diseases of the circulatory system (excluding endocarditis, which was in its own category) (Table 1). The distribution of the total number of sets drawn per hospital encounter was right-skewed, with a median of 2 sets per encounter (range, 1–76 sets) (Fig. 1).
Characteristics of Blood Culture Sets

Note. FY15, fiscal year 2015; N/A, not available.
Frequency distribution of total number of sets of blood cultures per hospital encounter. The total number of sets per hospital encounter ranged from 1 to 76, with a median of 2 blood culture sets.

Microbiology
The overall blood culture contamination rate was 0.91%. Contamination rates were 0.42% and 1.3% for cultures drawn by phlebotomists and by nurses and physicians, respectively.
A total of 2,760 (7.1%) sets drawn from 1,003 (10.5%) unique hospital encounters were true-positive blood cultures, yielding an overall true-positive rate of 7.1%. The most commonly isolated organisms per hospital encounter were Escherichia coli, Staphylococcus aureus, Klebsiella pneumoniae, Enterococcus faecalis, and Staphylococcus epidermidis. For downstream analyses, organisms were grouped into the following categories: gram-positive rods, gram-positive cocci, Enterobacteriaceae, other gram-negative organisms, and fungi (Table 1).
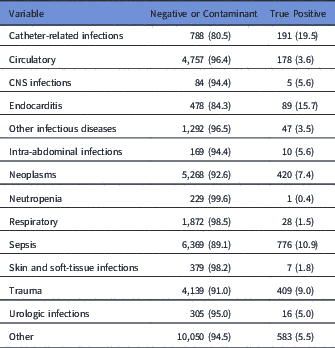
The rate of true-positive blood cultures differed by service group and by principal diagnosis group. Among the services, the frequency of obtaining a true-positive blood culture was lowest in emergency services and highest in oncology services, which had true-positive rates of 5.1% and 7.8%, respectively (χReference Stoller, Halpin and Weis 2 =15.22; df=4; P=.0043). Among the principal diagnosis groups that we assessed, the true-positive rate ranged from 0.4% for sets drawn from patients with neutropenia to 19.5% for sets drawn from patients with catheter-related infections (χReference Stoller, Halpin and Weis 2 =644.26; df=13; P<0.001) (Table 2).
Number of Sets by Principal Diagnosis

Note. CNS, central nervous system.
Patterns of utilization
Frequency of blood cultures
The overall incidence rate for obtaining blood cultures was 307.7 sets per 1,000 patient days. To assess the frequency with which blood cultures were drawn, we grouped cultures into 24-hour periods (N=18,741) based on the time of collection. Overall, 3,527 (37.1%) encounters had repeat cultures drawn, and the median number of days on which blood cultures were drawn during an encounter was 1 day (range, 1–44). Using a mixed-effects logistic regression model with encounter as a random effect and length of stay as an offset, we found that the odds of having cultures drawn on a given day was 1.11 times higher in oncology services than in general medicine (95% CI, 1.06–1.17; AUC, 0.73; P<.001).
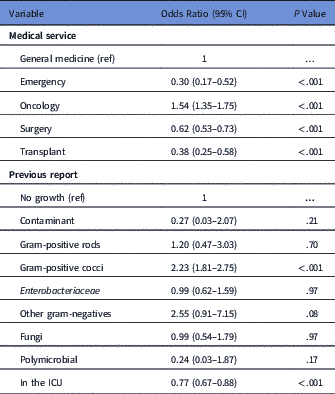
We also evaluated the practice of drawing repeat cultures within the next 24 hours. Out of a total of 9,230 days on which repeat cultures were drawn, the median interval between repeat cultures was 2 days (range, 1–71 days), and the frequency of drawing repeat cultures within the next 24 hours was 23.1%. Using a mixed-effects logistic regression model, we found that oncology services and cultures with gram-positive cocci were significant predictors of having repeat cultures drawn within the next 24 hours (AUC, 0.74; P<.001) (Table 3).
Odds of Having Repeat Cultures Drawn the Following Day

Note. CI, confidence interval; ICU, intensive care unit.
Use of repeat cultures after a positive identification
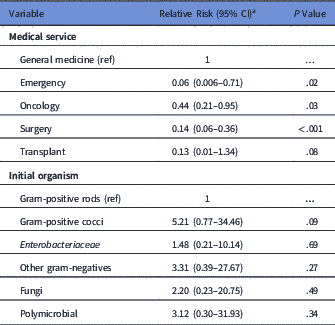
Of the 1,003 encounters with at least one true-positive culture, 895 patients (89.2%) had repeat cultures drawn, and 679 patients (67.7%) had repeat cultures drawn 2–7 days after the initial positive culture. The median number of repeat cultures per encounter was 4 blood culture sets (range, 0–73 sets). Using a negative binomial model with remaining length of stay as an offset, the rates of drawing repeat cultures were significantly lower for emergency, oncology, and surgery services than for general medicine (Table 4). Initial organism was a significant covariate, although none of the organism groups was significantly different compared to the reference group, gram-positive rods.
Relative Risk of Having Repeat Cultures Drawn Following a True-Positive Culture

Note. CI, confidence interval; ref, reference.
a For a follow-up period of 7 d.
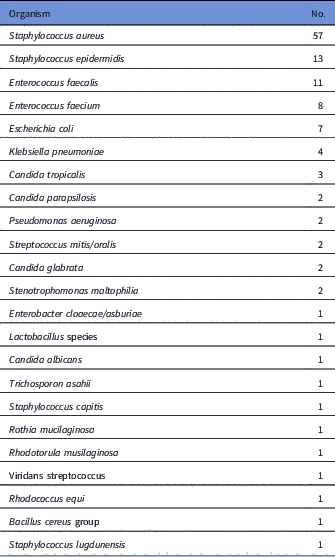
Analysis of repeat culture results showed that 5,437 (84.4%) of all repeat cultures after the first true-positive culture within an encounter were negative. To evaluate the frequency of persistent bacteremia, we conducted a subanalysis of repeat cultures obtained 2–7 days after the initial positive culture. Of 2,763 repeat cultures drawn within this period, 2,352 blood cultures (85.1%) were negative. Of the 679 encounters with repeat blood cultures drawn during this period, 533 patients had cleared bacteremia, 124 patients had persistent bacteremia, and 22 patients developed bacteremia from a new organism. Staphylococcus aureus was the most common cause of persistent bacteremia, accounting for 57 patients with persistent bacteremia (46.0%). Other common causes of persistent bacteremia included Staphylococcus epidermidis (10.5%), Enterococcus faecalis (8.9%), Enterococcus faecium (6.5%), Escherichia coli (5.6%), and Klebsiella pneumoniae (3.2%) (Table 5).
Number of Patients With Persistent Bacteremia by Organism

Under- and oversampling of blood cultures
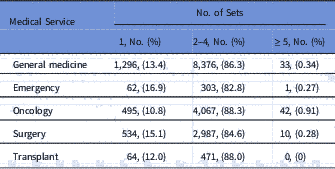
Because most guidelines recommend drawing 2–4 blood culture sets and discourage the use of single sets, we wanted to assess the level of adherence to these guidelines.Reference Lee, Mirrett, Reller and Weinstein 26 – Reference Lamy, Dargere, Arendrup, Parienti and Tattevin 28 The median number of blood culture sets drawn during a 24-hour period was 2 (range, 1–7 sets), and 2,451 single sets (13.1%) were drawn among all 24-hour periods in the study period (N=18,741). The distribution of the number of sets drawn within 24 hours was significantly different across services (χReference Stoller, Halpin and Weis 2 =68.4; df=8; P<.001) (Table 6). We also assessed the frequency with which only 1 blood culture set (in total) was drawn during a hospital encounter. We found that 727 (1.9%) single blood culture sets from 443 patients were the only sets drawn during those distinct hospital encounters. This rate was significantly different across services, ranging from 0.42% of all blood culture sets drawn in oncology services to 1.9% of all sets drawn in emergency services (χReference Stoller, Halpin and Weis 2 =62.13; df=4; P<.001).
Number of Sets Drawn Within 24-Hour Periods by Service

Discussion
In this retrospective study, we benchmarked blood culture utilization using available target values and conducted additional analyses to assess utilization patterns at a tertiary-care university hospital. Although specific usage patterns may differ by institution, our study suggests that assessing the effect of medical service on utilization patterns may be informative for identifying systemic factors that influence ordering practices.
The magnitude of blood culture utilization observed in many patients highlights a need for the development of more benchmarks and guidelines. Although there are no existing standards, Baron et al.Reference Baron, Weinstein, Dunne, Yagupsky, Welch and Wilson 29 suggested 103–188 blood culture sets per 1,000 patient days as a potential target rate. The high frequency and high quantity of repeat cultures (most of which were negative) also calls for a reassessment of the utility of drawing repeat cultures. In addition, although the College of American Pathologists has provided some benchmarks for the single set blood culture rate, these may not be appropriate or current benchmarks for larger, tertiary-care hospitals such as the one described here.Reference Novis, Dale, Schifman, Ruby and Walsh 30 , Reference Schifman, Bachner and Howanitz 31 Without clear guidelines for appropriate blood culture use, we cannot evaluate the extent to which the utilization patterns described in this study were inappropriate or unnecessary.
One limitation of this study is that it was performed at a single academic hospital, and additional analyses at other institutions are needed to compare ordering practices and to determine whether other metrics would be useful to evaluate when developing guidelines and benchmarks. Furthermore, we used only the ICD-9 codes for principal diagnosis upon discharge, which may have omitted other concurrent conditions and does not indicate why blood cultures were ordered at the time. Also, we did not assess whether a patient had multiple, distinct episodes of suspected bacteremia within an encounter, which may have affected our analysis of the rate of repeat cultures.
Although preanalytic aspects for obtaining blood culture sets were not the focus of this study, the relatively low contamination rate observed in this study is noteworthy. Our data are consistent with previous findings that contamination rates are lower for phlebotomists than for nonphlebotomists, although the rates for both groups were below the benchmark suggested by the CLSI. 21 , Reference Snyder, Favoretto and Baetz 34 A recent survey reported that 80% of the respondent hospitals had contamination rates <3%,Reference Garcia, Spitzer, Kranz and Barnes 35 suggesting that the benchmark for blood culture contamination could be lowered.
Another important preanalytical issue is the volume of blood per culture set. Although we were unable to collect this information for this study, we have begun to monitor blood culture volumes during fiscal year 2018 (FY18) using software in our blood culture instruments (BD Epicenter, Becton Dickinson). Of 27 in-patient hospital units that we monitored, only 2 units drew on average the recommended volume of blood (8–10 mL per bottle). After a hospital-wide educational intervention was implemented, the number of units collecting the recommended volume increased, suggesting that interventions can improve collection practices (I. Nachamkin, unpublished data).
Diagnostic stewardship, the process of determining the proper use of diagnostic tests for appropriate patients to facilitate clinical decisions, is critical for improving blood culture utilization.Reference Morgan, Malani and Diekema 36 , Reference Messacar, Parker, Todd and Dominguez 37 Routine monitoring of blood culture utilization and analysis of utilization patterns is an important step toward defining the appropriate use of blood cultures and identifying potential areas of overutilization. Intervention programs using computerized physician order-entry decision support and clinical practice guidelines have been shown to effectively reduce unnecessary cultures without affecting patient outcomes.Reference Woods-Hill, Fackler and Nelson McMillan 14 , Reference Bates, Kuperman and Rittenberg 38 Although bacteremia prediction models are useful for stratifying patients into different risk groups,Reference Bates, Cook, Goldman and Lee 32 , Reference Leibovici, Greenshtain, Cohen, Mor and Wysenbeek 33 the use of blood cultures to monitor patient status can still be optimized to limit blood loss and reduce unnecessary testing. Appropriate blood culture utilization also contributes to antimicrobial stewardship by reducing the risk of false-positive results, which may help avoid inappropriate antibiotic therapy.Reference Morgan, Malani and Diekema 36
This study demonstrated the feasibility of analyzing global patterns in blood culture utilization and benchmarking utilization metrics. Future studies of blood culture utilization that incorporate other population-level factors will help determine the underlying indications for drawing blood cultures. The effect of specific ordering practices on treatment decisions and patient outcomes should also be measured to assess clinical effectiveness and to develop evidence-based guidelines for blood culture utilization.
Acknowledgments
We thank Jeff Rohrbach and Mei Yu for providing data sets and Hillary Nelson, Ricardo Castillo-Neyra, and Jane Schulte for critical feedback on this manuscript.
Financial support
No financial support was provided relevant to this article.
Conflicts of interest
All authors report no conflicts of interest relevant to this article.