

Social network model of political participation in Japan
In their path breaking analysis of participation and political equality across seven countries, Sidney Verba, Norman Nie, and Jae-on Kim (Reference Verba, Nie and Kim1978) provided many compelling insights into the modes and processes of political participation. Their analysis begins with a puzzle. Why does one find such great variations in the strength of the correlations between individual socio-economic resources and political activity levels across nations? To answer this puzzle, they construct a model that posits that participation levels are the product of two distinct kinds of forces. Individuals with higher levels of income and education, all else being equal, will have more resources (money, time, prestige, knowledge, and skills) available to effectively involve themselves in the political process. In addition, because one's socio-economic resource level (SERL) is directly related to one's political interest, efficacy, perceived stake in political outcomes, and other dimensions of psychological involvement, high SERL individuals will be more motivated to become politically active. Verba and his associates argue, therefore, that if these individual-based processes alone are operating, upper status citizens will uniformly constitute a disproportionate share of the activist population in every country. Since it may be assumed that more active segments of the population will receive greater representation, this argument has important implications for democratic theory.
Group-based forces, however, may potentially offset the natural advantage of upper-status citizens. In the case of various politically mobilized socio-economic groups, organization provides the necessary resources to participate effectively in politics and political ideologies and/or group-specific issue preferences provide the motivation. If lower status socio-economic groups in a particular country are politically mobilized through voluntary associations or party organizations, the group-based process of political participation may have an equalizing impact and thereby depress the correlation between individual socio-economic resources and participation levels. On the other hand, if the upper status groups are better organized, then the group-based processes will only exacerbate the disparities derived from individual-level forces between the haves and the have-nots in participation levels.
In perusing the data presented by Verba et al. (Reference Verba, Nie and Kim1978), Japan emerges as an important extreme test case for investigating those factors that may depress the expected association between the individual socio-economic level and the participation level. Across their three primary modes of political participation, we find that of the seven nations in the study, the Japanese case reveals the lowest correlations with the SERL scale for campaign activity and communal activity and no significant correlations for voting (Verba et al., Reference Verba, Nie and Kim1978: 75). Why then do we find such extremely low correlations in Japan?
As with most multi-national studies, the Verba et al. analysis fails to capture many of the factors that produce deviant cases. While their theory is compelling, the evidence they provide does not satisfactorily explain the low Japanese correlations. Indeed, rather than providing a satisfactory solution to their initial puzzle for the Japanese case, their analysis raises several new puzzles of its own.
The logic of their argument would suggest that group-based forces must play a strong role in Japan. They do find high levels of organizational memberships in Japan, but most of these are classified as memberships in non-politicized organizations, in the sense that the members reported that regular discussions of political and public affairs did not take place at the organizations' meetings (Verba et al., Reference Verba, Nie and Kim1978: 101–6). If most Japanese organizations are indeed non-politicized, then we should expect group-based forces to have little impact on altering the relationship between individual-based socio-economic resources and motivations and political activity in Japan.
Even more puzzling is the fact that membership in the kinds of organizations that are emphasized in their analysis – such voluntary associations as unions, enterprises and professional organizations, religious associations, and other kinds of organizations representing various social strata, classes, economic interests, or cultural cleavages – reveal sizable opposite correlations with individual socio-economic advantage. Data from the 1976 JABISS election study demonstrate that the index of memberships in these kinds of non-areal organizations, that is voluntary organizations not based on one's immediate neighborhood of residential community, has a correlation of 0.23 with the SERL scale. Looking only at these organizations, then, we would conclude that group-based forces in Japan reinforce the participation bias in favor of the higher status strata, much as they do in the United States where we find among the highest SERL–participation correlations. In fact, we will argue that group-based forces, as operationally defined by Verba et al., do not explain the low SERL–participation correlations that we find in Japan.
In the analysis that follows, we will solve the above riddles and present a more comprehensive model of political participation in Japan. We will begin by defining two modes of political participation. We will then re-define Verba's operational definition of group-based forces to focus more broadly on social networks.Footnote 1 We will next introduce four additional variables, exogenous to the Verba model, that all operate to weaken the SERL–participation linkage in the Japanese context. Then we will present a more comprehensive multivariate model of political participation for each of the two participation modes. The analysis is based on the 2003 Asian Barometer survey.Footnote 2
Modes of political participation
Obviously, participation is highly unequal. Political participation is more common in some groups than in others, which in turn causes the former to have a stronger impact on the political process. A wealth of research concludes that network involvement encourages political participation (Dalton, Reference Dalton2014, Reference Dalton, Dalton and Shin2006; Howard and Gilbert, Reference Howard and Gilbert2008; Lee, Reference Lee2010; Krishna, Reference Krishna2002; Cox et al., Reference Cox, Rosenbluth and Thies1998; Kim, Reference Kim and Alagappa2004; Flanagan et al., Reference Flanagan, Kohei, Miyake, Richardson and Watanuki1991; Rosenstone and Hansen, Reference Rosenstone and Hansen1993; Verba et al., Reference Verba, Schlozman and Brady1995; Putnam, Reference Putnam2002, Reference Putnam2000). While the component items are not precisely identical in all cases, the ABS includes items that can be considered to be tapping the same two modes of conventional political participation as Verba et al. derived:Footnote 3 voting and campaign activity. Campaign activity obviously is a significant mode of action, for through it the citizen can increase his or her influence over the election outcome beyond the one vote allocated to him or her. Furthermore, greater initiative is required of the citizen than in relation to the vote; campaign activity is clearly a more difficult political act than mere voting.
Voting
The measure of voting is relatively straightforward. The ABS asked the following question.
Q. In talking to people about elections, we often find that a lot of people were not able to vote because they were away from home, they were sick or they just didn't have time. How about you? Did you vote in the elections [the most recent national election, parliamentary or presidential] held in [year]?
We coded ‘1’ for yes and ‘0’ no for a dichotomous measure of voting: 74.2% of respondents said they voted in the last election.
Campaign activity (CA)
The CA scale is composed of three items on the respondent's level of experience in campaign participation. The CA is coded so that for each item higher numbers indicate greater involvement. The specific questions asked are: (1) ‘Did you attend a campaign meeting or rally?’ (2) ‘Thinking about the national election in [year], did you try to persuade others to vote for a certain candidate or party?’ (3) ‘Did you do anything else to help or show your support for a party or candidate running in the election?’ Fifteen percent of the Japanese sample reported participating in (1), 7% in (2) and 4% in (3) said ‘yes’, respectively. We combine these three into a campaign activity scale using a simple additive procedure. The scale then taps the respondents' intensity/degree of participation in campaign activity. Twelve percent of the Japanese reported participating in one activity, a little more than 3% in two and a little more than 2% in all three.
The puzzle revisited
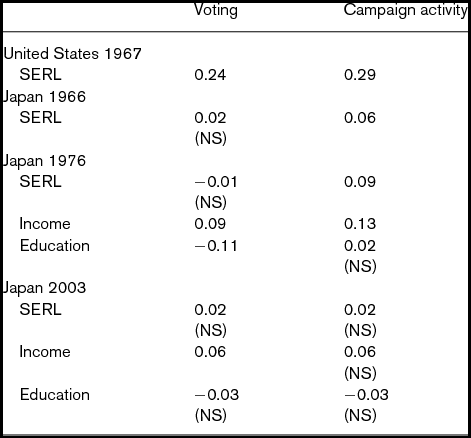
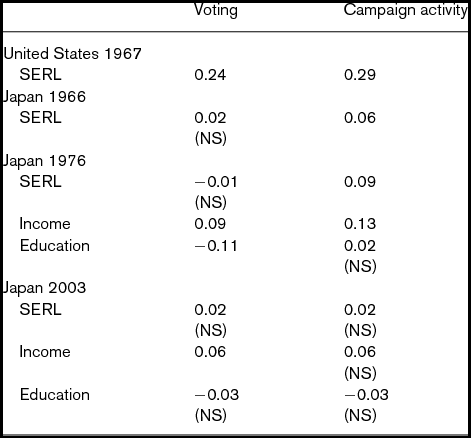
Table 1 reports the Verba et al. findings on the relationships between their SERL index and two modes of political participation for the United States and Japan using their 1965–7 Participation Project data. The marked differences between the strength of the correlations in the two countries are readily apparent. A comparison with the JABISS and ABS data reveals that the Verba findings still held true in Japan ten and even 35 years after their study. The surprising finding from the ABS data is that the patterns of correlations for both modes of participation are remarkably similar, suggesting that there may be no meaningful differences between these two modes in the impact of socio-economic resources on participation levels. Verba and his associates argue that campaign activity is a more difficult act than voting and is less dependent on institutional channels than voting. They therefore reason that campaign activity should be less constrained by group-based processes and more dependent on individual motivations and resources than voting and hence more strongly associated with the SERL index. This distinction emerges neither in the 1976 nor in the 2003 data. Why?
The association between socio-economic advantage and political participation (Pearson's r)
Note: NS indicates that the association is not significant at the 0.05 level.
Source: The American and 1966 Japanese data are reported as found in Verba et al. (Reference Verba, Nie and Kim1978: 75). The Japanese correlations were computed from the 1976 JABISS Election Study (Flanagan and Lee, Reference Flanagan and Lee1993) and the 2003 Asian Barometer Survey data.
We have already suggested that group-based processes as operationalized by Verba et al. will not explain the weak SERL–participation correlations. We have pointed out that most Japanese organizations are non-politicized and membership in non-areal voluntary organizations, which are far more politicized than the areal, community associations, is substantially correlated with socio-economic advantage. What matters most in Japan may not be intermediary civic engagement, but daily interpersonal communications, less-organized intermediate or informal groups (like out-of-hours co-workers groups, study/training groups, hobby circles), the latter contributing to the affluence of social capital which in turn plays a greater role as a facilitator of political participation. Ikeda‘s study (Reference Ikeda2002) of the JEDS (Japanese Election and Democracy Study) 2000 survey, for instance, unequivocally demonstrates that not only is politically relevant social capital in Japan generated in personal networks (e.g., daily conversation with his/her interpersonal environment), it also is a by-product of the social interactions with a citizen's discussions. Increasing levels of politically relevant social capital enhances the likelihood that a citizen will be engaged in politics.
Table 1 suggests an additional puzzle that can be added to these. As the Verba argument predicts, the lowest SERL correlations are with the voting scale. Voting is the easiest activity and, since it requires little in the way of individual resources and motivations, may be easily dominated by an organization interested in mobilizing the vote. An additional puzzle emerges when we dissect the SERL index into its component dimensions of income and education. As shown in Table 1, these two attributes in our 2003 data display markedly different patterns of association with the two participation modes. Income displays a flat, almost constant, correlation of roughly 0.06 across two modes. Education, in contrast, is negatively correlated with both, and has no significant association with either mode of participation. We have used the combined SERL scale throughout the paper for comparability with the Verba findings. Admittedly, the differences between the education and income correlations within the two modes are not large enough to create any real distortions in the interpretation of the findings. In sum, the evidence presented in Table 1 demonstrates that the SERL associations with two modes of political participation are uniformly weak to insignificant in Japan.
Group and individual-based processes: redefining the variables
The Verba et al. model of individual and group-based processes suggests that institutional affiliation can supply the resources and motivations that the individual lacks and thereby stimulate participation among disadvantaged socio-economic strata. Verba and his associates suggest that for disadvantaged individuals, organization provides resources in terms of numbers and motivations via the socialization of the individual into a political ideology and an expanded consciousness of group-specific issues. In more concrete terms, they argue that there are four ways in which organizations can affect levels of participation: (1) they may mobilize their members to participate; (2) they may expose their members to political stimuli, for example through the discussion of social issues; (3) they may provide skills and experience within the organization that may then be transferred to political participation roles outside the organization; or (4) they may so dominate a participation mode that non-members are barred from participation, for example party membership may be a requirement for participation in campaign activities (Verba et al., Reference Verba, Nie and Kim1978: 81).
To operationalize this concept of group-based processes, they create an index of institutional affiliation. It is in the operationalization of this index that we encounter problems with their analysis. The institutional affiliation index is constructed from two variables – strength of party identification and membership in politicized organization – both of which seem inappropriate in the Japanese case. Party identification is an attitude and does not imply any involvement with a party organization. At best, party identification is an indicator of a meaningful psychological attachment to a party label and a standing decision to support that party in elections (Dalton, Reference Dalton2014, Reference Dalton, LeDuc, Niemi and Norris2010; Dalton et al., Reference Dalton, Shin and Chu2008). At worst, as some research has shown, the party identification indicator may only be tapping into a short-term voting intention (Tomassen, Reference Tomassen, Budge, Crewe and Farlie1976; Crewe, Reference Crewe, Budge, Crewe and Farlie1976; Kaase, Reference Kaase, Budge, Crewe and Farlie1976; Flanagan et al., Reference Flanagan, Kohei, Miyake, Richardson and Watanuki1991). Moreover, Richard Katz (Reference Katz1979) has argued that strength of party identification is in fact a measure of intensity of psychological involvement in politics and as such is quite distinct from the dimension of party preference. He found, for instance, that when strong Democrats or strong Republicans changed their party affiliation, they were more likely to become strong rather than weak supporters of the other party.
In Japan, few voters are members of parties or involved with party organizations in any meaningful sense. There are, of course, important candidate-specific support groups and candidate networks that do have a meaningful impact on political participation. However, the strength of party identification in no way taps into involvement in candidate networks. A number of observers of Japanese politics have made the point that political parties are not very salient to segments of the Japanese population, who instead appear to relate to politics via personalistic ties to particular local influential individuals and politicians (Richardson, Reference Richardson1974; Flanagan and MacDonald, Reference Flanagan and MacDonald1979; Flanagan et al., Reference Flanagan, Kohei, Miyake, Richardson and Watanuki1991; Thies, Reference Thies, Hsieh and Newman2002; Scheiner, Reference Scheiner2005; Noble, Reference Noble2010; Aldrich and Kage, Reference Aldrich and Kage2011). Therefore, at least in the Japanese context and probably elsewhere as well, it makes more sense to regard the strength of party identification as an indicator of intensity of psychological involvement in politics rather than as an indicator of an involvement in a politically mobilizing organization.
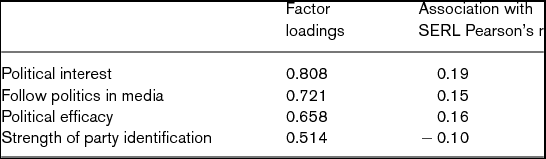
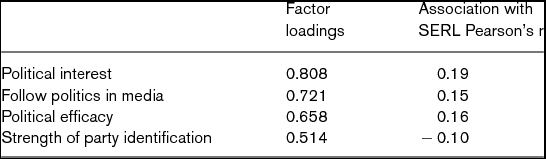
When we included strength of party identification in a factor analysis with three other psychological involvement variables,Footnote 4 only one factor emerged with an eigenvalue of 1.0 or greater. The loadings of these four variables on this common factor are reported in Table 2. The political interest scale loaded highest on the factor followed by the scale of attentiveness to politics in the media. The political efficacy scale also loaded on the psychological involvement factor. Later in the paper, as Table 3, where we report a single measure for psychological involvement, it is the variable derived by combining the four items into a single index to produce a more robust measure of psychological involvement.
The factor loadings of the psychological involvement variables on a common factor and their association with socio-economic advantage (Pearson's r)
Note: All reported correlations are significant at the 0.05 level.
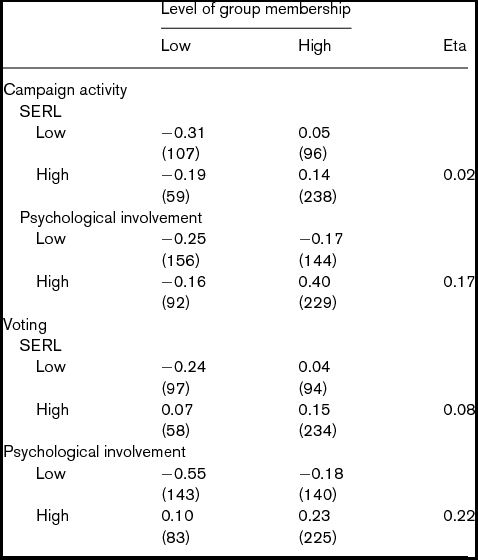
Standardized group mean scores on voting and campaign levels for voter categories defined by level of group membership, socio-economic resource level, and psychological involvement

Note: The figures in parentheses are the number of cases on which the group mean was computed.
In Table 2, we also report the association of each of these components of psychological involvement with socio-economic advantage. Three variables, political interest, follow politics, and political efficacy, exhibit relatively modest associations with socio-economic advantage. As Verba et al. argue, we should expect higher correlations between socio-economic advantage and psychological involvement in those countries where group processes play an equalizing role vis-à-vis participation levels because psychological involvement is relatively immune to institutional constraints. Hence, group-based processes should interfere less with individual-based processes and the ‘natural’ proclivity for high SERL strata to be more involved in politics. We do note, however, that even these correlations of 0.19, 0.15, and 0.16 for interest, follow politics in the media and efficacy respectively are substantially lower than the correlations Verba et al. (Reference Verba, Nie and Kim1978: 75) report of 0.40 and 0.36 for SERL with interest and discussion in the United States. Moreover, the SERL correlation with strength of party identification is no higher in Japan than the weak to insignificant SERL–participation correlations that we reported in Table 1. We will argue that these weaker than expected associations between psychological involvement and socio-economic advantage are also a function of group-based processes.
The second indicator Verba et al. propose for institutional affiliation, membership in political organizations, presents a different kind of problem. They distinguish between politicized and non-politicized organizations because they argue that lower-status groups need self-conscious ideology as motivation if they are to catch up with the upper-status groups in terms of political activity (Verba et al., Reference Verba, Nie and Kim1978: 15–16). This is the kind of role that we normally expect unions, class parties, reform movements, and other leftist organizations to play. These kinds of organizations are voluntary associations normally without great economic resources. Therefore, to be effective, these organizations must mobilize large numbers of people. In this context, ideology becomes an important, perhaps essential, ingredient. In order to gain mass adherents, these organizations must socialize the socio-economically disadvantaged strata who have little political knowledge or skills into an understanding of why there is a need for the organization and what they can gain by joining and participating actively in it.
In Japan, however, there is another kind of organization. These are the community-based organizations which, compared to the above non-areal kinds of organizations, are both more organic, in the sense that they are a spontaneous extension of a natural social groups, and more inclusive, in the sense that membership is generally automatic as a function of residence (and sometimes other criteria such as age or sex, i.e., young men's, women's and old people's associations) rather than being voluntary. These areal associations derive their strength from traditional norms of community solidarity and face-to-face social network interactions on a day-to-day basis. These community associations, therefore, especially in rural contexts, can frequently mobilize their members to participate in various political activities without having to rely on ideological indoctrination or heavy doses of political education and discussion.
In our reformulation of the operational definition of group-based processes in Japan, therefore, we first exclude strength of party identification, which we felt is more appropriately classified as an indicator of psychological involvement. Secondly, and more importantly, we broaden the kinds of group affiliation measures to include more informal, social network ties along with more formal organizational affiliations. To reflect this broadened definition of group-based processes, we prefer the term social network involvement to institutional affiliation, with the understanding that this term is meant to cover both formal membership in established organizations and informal associations and social interactions.
Unfortunately, the ABS does not contain specific items that can measure the above membership in community-based organizations, but it does offer, albeit limited, proxy measures. We start with two measures of social network characteristics: formal or informal membership. The ABS asked respondents: (1) whether they were a member of any organization or formal groups (e.g., political parties, trade association, PTA); (2) whether they were a member of any private groups, circles, or regular gatherings (e.g., circles of friends who exchange information, share common hobbies). Each of these two measures is dichotomous, given that the most important distinction is that between those who join and those who do not.
We should note that membership in either type of group does not necessarily imply that all members are actively participating in group activities. The frequency and quality of participation in group meetings or activities can indeed tell us more about, what Putnam calls, associational density. Fortunately, the ABS includes items that tap the intensity of social engagement. If the respondent answered ‘yes’ to either (1) and/or (2), then the follow up questions were asked: (1) to name the three most important organizations they belonged to. Thus we are able to examine membership in both more formal and informal organizations, and with respect to both we can also ask about the intensity of membership. In sum, we can investigate more or less intense commitment/involvement.
We are testing to see whether participation in network associations is more likely to lead to higher rates of political participation than is participation in one's SERL only. While our interest of research lies in addressing how well each type of group resources, formal or informal, is conducive to political participation, the measurement of the two types of the associational membership is not as full as we would have liked. Moreover, due to the large number of missing cases (non-membership in this case; 33% in formal and 51% in private) and relatively a high correlation between the two types (Pearson's r = 0.423), we combine two types of voluntary associations throughout our study, unless otherwise specified. The distribution of the combined group membership then is: none (25%), 1 to 3 (51%), 4 to 6 (24%). For a test of the intensity of network involvement, our hypothesis would be: The more involved in organizational network, the greater generalized activity in politics.
Can network involvement mobilize otherwise apolitical voters to turn out to the polls? In searching for evidence, in Table 3, the respondents' socio-economic resource levels (SERL) and group membership were trichotomized into low, medium, and high categories, but the middle categories have been deleted to simplify the table. The reported numbers are the mean z-scores for each category of respondents on a scale of their frequency of voting and campaign participation. We see very starkly that the individual's SERL by itself does not have clear independent effect on voting, whereas group membership, regardless of the voter's individual resources, has the same effect in stimulating voting above the sample mean of zero. Similar pattern emerges from campaign activity with a slightly stronger effect of group membership.
This finding suggests that SERL has little or no effect on voting and/or campaign activity, unless, perhaps, these personal resources stimulate higher levels of psychological involvement. This leads us to the second part of each mode, where the same analysis is performed with the combined psychological involvement scale substituted for SERL.
Psychological involvement does exert detectable influence. Regardless of group membership, those falling into the bottom third on psychological involvement are inhibited from participation in both modes. A mixed pattern emerges from those falling into the top third on psychological involvement: group membership does not matter much in voting, but is mixed in campaign activity. For the latter, those falling into the bottom third on membership but the top third on psychological involvement are inhibited from participation in campaign activity (–0.16). We also note that the highest frequency of cases falls in the high psychological involvement/group membership classification in both types of participation. In sum, the evidence presented in Table 3 demonstrated two conclusions: (1) psychological involvement does exert some detectable, albeit small, influence; (2) for more difficult action, campaign activity, group-based forces reinforce the participation bias in favor of the more psychologically involved strata.
Exogenous factors that weaken the SERL–participation linkage
We have now operationally redefined the three independent variables in the Verba et al. model. The SERL index remains unchanged despite the caveats presented regarding the somewhat different impacts of income and education levels on participation in Japan. The index of psychological involvement has been broadened somewhat to include strength of party identification and political efficacy along with the more typical indicators of interest and attentiveness to politics in the media. The institutional affiliation index has been redefined by eliminating its attitudinal component – strength of party identification – and substituting indicators of two distinct types of social network involvement, including both formal and informal organizational memberships.
We are now in a position to test for the causes of the unusually weak SERL–participation linkage in Japan. We will begin by analyzing in this section three factors that are exogenous to the Verba et al. model and yet contribute greatly to weakening the SERL–participation linkage, at least in the Japanese case. These three factors are sex, age, and urbanization. While Verba et al. do deal at some length with the impact of two of these variables, sex and urbanization, on participation levels, they do not explicitly introduce these variables as explanations for the differences among nations in the strength of the SERL–participation relationship. Yet in the Japanese case, all three variables play a role in depressing the associations between participation levels and socio-economic advantage.
Sex
The Verba et al. analysis (Reference Verba, Nie and Kim1978: 234–68) reveals that Japan can still be classified with other more traditional societies, such as India, Nigeria, and Yugoslavia, where sex exerts a strong impact on participation levels. This differs from the findings for the advanced industrial Western societies, such as the Netherlands and the United States, where sex differences in participation levels are very much on the decline. The finding of sharp sex role differences in the Japanese case seems to be somewhat of an anomaly given the high education levels of Japanese women. Indeed Verba et al. (Reference Verba, Nie and Kim1978: 268) report that the gap in Japan between male and female overall political activity scores when controlled for socio-economic advantage, institutional affiliation, and psychological involvement ranks second among their seven nations with only Nigeria exhibiting a greater difference between the sexes. In Japan, involvement in political activities other than voting is still not regarded as an activity that is compatible with the female sex role. As Susan Pharr's earlier study (Reference Pharr1981) of sex and political socialization in Japan has shown, an activist role for Japanese women in politics still receives little social support and can entail considerable personal sacrifice. For example, politically active women experience great difficulty in finding a husband. Other studies (Aldrich and Kage, Reference Aldrich and Kage2011; Gelb and Palley, Reference Gelb and Palley1991, Reference Gelb and Palley1994; Imamura, Reference Imamura1987; Eto, Reference Eto2005; Nakano, Reference Nakano2013) with rare exceptions (for an exception, see Steel, Reference Steel2004) mirror a parallel pattern in the women's status in Japan.
If the social norms and expectations that inhibit or even bar women from political participation are strong enough in a nation, they will be felt across all socio-economic strata. Thus for women in such societies, socio-economic advantage may have little impact on participation levels. If the relationship between socio-economic advantage and participation level is rather flat for women due to cultural inhibitions that discourage female activism, these sex role norms are in effect depressing the ‘normal’ SERL–participation association that would emerge if we looked only at the male population.
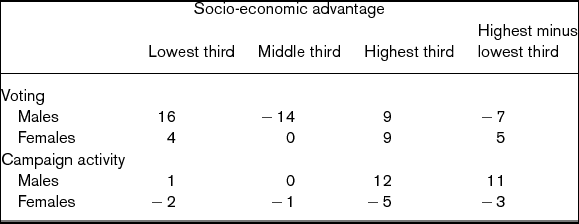
In Table 4, we find evidence that suggests that sex role differences exercise precisely this kind of effect in depressing the SERL–participation associations. Here, scale scores for group means were derived by standardizing the scales so that each had a population mean of zero and a standard deviation of 100. Thus if one group has a score of 50 and another of –50, the first is a half of a standard deviation above the population mean on the index while the second group is one half standard deviation below the population mean. Voting is the exception in Table 4, with SERL having little or no impact on female voting and a modest inverse effect on male voting. This finding suggests that voting is an activity that is more fully dominated by group-based rather than individual-based processes and that much of the voting activity in Japan is mobilized participation.Footnote 5
Participation scale scores across two participation modes for three levels of socio-economic advantage controlling for sex
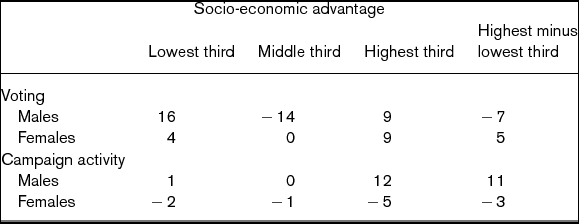
The other mode of participation, campaign activity, exhibits the striking pattern with the differences in participation scores between the highest and lowest thirds on socio-economic advantage being much greater for men than women: the high–low difference for men is about five times that for women. Interestingly, while the participation scores for women, regardless of their SERL, are below the sample mean of zero, women falling into the top third on SERL are the least likely to engage in campaign activity (–5).
We may conclude that sex roles have a significant effect on depressing the SERL–participation relationship in Japan. Japanese women are not markedly more likely to participate in political activities with rises in their socio-economic level. This flatter SERL–participation association for women, therefore, is one factor that helps explain the unusually weak impact of socio-economic advantage on political participation in Japan.
Urbanization and age
Urbanization and age have an even greater impact on depressing the SERL–participation. In Japan we find a sizable correlation between urbanization and the SERL index (r = 0.18). Urban residents on average have more socio-economic resources as a function of higher salaries and better education than rural residents. However, urban residents are also less likely to engage in conventional modes of political participation,Footnote 6 as witnessed by the negative and insignificant correlations between urbanization and voting (r = –0.12) and campaign activity (NS). The negative association is a function of the decline-of-community phenomenon that Verba et al. have so persuasively conceptualized and demonstrated.
Furthermore, the greater the size and impersonality of urban areas makes involvement in various political activities a more distant, unfamiliar, and difficult endeavor. In large settings, therefore, political participation is often a more foreign and formidable activity. We find, then, that urban residents who have higher socio-economic resources actually participate in conventional political activities at lower levels than rural residents do with lower resource levels, because of the reduced motivations and opportunities for participation in urban settings. This phenomenon inevitably reduces the bivariate SERL–participation correlations.
Age has a similar effect. Older cohorts, presumably as a function of their greater experience and knowledge concerning the hows and why of participation, are found to participate in voting (r = 0.27) and campaign activity (r = 0.13) at significantly higher levels than younger cohorts. However, in Japan it is the younger cohorts that have the higher levels of socio-economic resources (r = –0.39). This is dramatically true in the case of education (r = –0.47), as a result of the massive expansion of secondary and higher education in Japan throughout the post-War War II period. These younger, better-educated cohorts have also moved disproportionately into better paying, urban, professional, and technical jobs. Thus remarkably, given the strong emphasis on seniority in the fixing of wage scales in Japan, we find a significant negative correlation between age and income (r = –0.19). In Japan, then, the younger age cohorts who actually have the higher socio-economic resources participate in political activities at lower levels due to their greater unfamiliarity with the rules of the game, their higher mobility and disassociation with mobilizing organizations and social networks, and their lower perceived stakes in political outcomes. Again, as in the case of urbanization, this phenomenon inevitably depresses the bivariate SERL–participation correlations.
Multivariate modeling of political participation
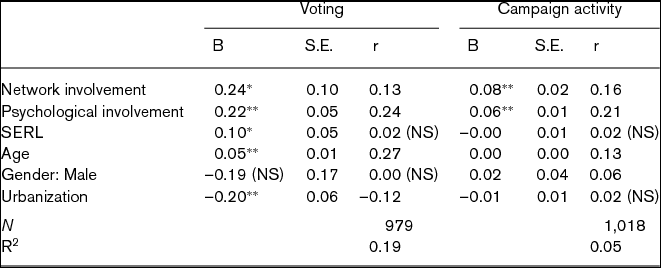
We are now in a position to fit the data to an expanded version of our model that includes the exogenous influences that we have demonstrated in the last section. We use two regression equations thus derived to create a distinct social network and psychological involvement variable for each participation mode. Logistic regression analysis is used to estimate the voting model because the dependent variable, voting, is dichotomous. For the campaign activity (CA), an OLS (ordinary least-square) regression is employed to determine the staying power and precise contribution of any given determinant when other determinants are taken into account. Reported are unstandardized coefficients (b) for all variables as well as standardized errors for the variables with p < 0.05. Also reported in the table are bivariate correlation coefficients. Multivariate analysis is used to verify the patterns that emerged in the bivariate analysis. For the CA model, we also performed a path analysis to examine the direct and indirect effects of all the variables included by decomposing their relationships (data not shown).Footnote 7
In the models, the significant coefficients of all the control variables are in the expected direction. Several conclusions can be drawn from the results in Table 5. First, the mixed role of socio-economic advantage (SERL) in Japan, when the effects of the other background variables are controlled, is quite apparent. While in the voting model SERL does have a positive effect on stimulating participation, we find a negative and insignificant link between SERL and campaign activity.
Effects of predictor variables on voting and campaign activity
Notes: NS indicates that the association is not significant at the .05 level. S.E. = standard errors. R2 for Voting is Pseudo and R2 for Campaign Activity Adjusted.
* Significant at < .05.
** Significant at < .01.
Our second point is that in marked contrast to SERL, network involvement and psychological involvement play a strong role in each of the models, all else being equal. Indeed in the case of campaign activity, these two variables exercise an overwhelming predominant role as is apparent from Table 5. The other variables in the campaign activity and voting model, except age and urbanization, display no major effects. Socio-economic resources, therefore, appear to affect participation primarily through their impact on social network and psychological involvement levels. If socio-economic advantage leads to higher psychological involvement or induces an individual to become active in organizations or community networks, the result will be higher levels of participation. But if socio-economic advantage has little or no association with psychological and network involvement, it will have little or no association with participation. The path analysis for the CA model provides evidence of indirect effects of SERL via psychological involvement: the path coefficients from SERL to social network involvement (0.366) and to psychological involvement (0.204).
The third point that we would like to stress is that the path coefficient between network and psychological involvement in the campaign activity model is statistically significant (beta = 0.09). Verba et al. do note in passing that institutional affiliation may have some effect on one's level of psychological involvement. But they also argue that ‘the relationship between socio-economic resources and psychological involvement in politics ought not to be reduced by the intervening effects of institutional affiliation’ (Verba et al., Reference Verba, Nie and Kim1978: 71, fn. 6). They do not effectively test for the effects of institutional affiliation on altering the relationship between SERL and psychological involvement, partly because of the problems with their indicator of institutional affiliation. If, as we argue, strength of party identification is an indicator of psychological involvement, they have failed to establish independence between their indicators of psychological and network involvement. The significant path between network and psychological involvement suggests that high levels of network involvement will stimulate psychological involvement to levels far above what would be predicted on the basis of an individual's socio-economic resource level. Conversely, low levels of network involvement are likely to depress an individual's psychological involvement to levels far below what would be predicted based on his/her socio-economic resources.
Finally, when we shift from the bivariate perspective to the multivariate perspective, the effects of age on campaign activity diminish greatly after the effects of other controls enter the picture. The effect of age appears to be insignificant because higher age has an offsetting positive effect on campaign activity through inducing higher levels of psychological involvement. It should be noted that the fit of the model is noticeably better in voting, with r2 ranging from 5% to 19% of the explained variance.
Conclusion
In summary, we have found three major kinds of causes for the weak associations between socio-economic advantage and participation levels in Japan. First, we introduced three variables – sex, urbanization, and age – that were not explicitly entered into the Verba et al. model as factors that may account for cross-national variables in the strength of the SERL–participation correlations. Due to several special features associated with the Japanese setting, all three were found to have the effect of depressing these correlations in Japan.
The second major cause of the weak SERL–participation linkage is derived from the equalizing impact of group-based processes in Japan. Admittedly, although we found some support for our hypothesis, it does not mean that the study was without fault. Our model focused on rather broad associational categories: formal versus informal. Due to data limitations, it was not possible to deal directly with the question of whether formal association resulted in significant differences in political participation compared to informal ones, once confounding factors are taken into consideration. However, other studies unequivocally present evidence. In The Japanese Voter, Flanagan et al. (Reference Flanagan, Kohei, Miyake, Richardson and Watanuki1991), for instance, found that it was not largely membership in politicized, voluntary organizations that exercised the equalizing role. Even the unions in Japan draw equally from the blue- and white-collar classes and represent the wage-earning elite in both classes who are employed in large enterprises in the modern sector of Japan's dual economy. Those employed in the small shops and small-scale enterprises that comprise Japan's large traditional economic sector are not unionized and have relatively insecure and low paying jobs. Thus, it is not the more politicized, voluntary organizations that exercise the greater portion of this equalizing role, but it is rather the more non-politicized, organic areal associations and informal social networks found in Japan's residential communities that play this equalizing role. Since these community associations and networks require no initiative to join or revolutionary ideology to gain commitment, they tend to draw all economic strata within the community into participatory activities. This equalizing role is further enhanced since it is in the more traditional and economically depressed sectors of Japanese society that these community networks are more densely and effectively organized.
The third major cause of the weak SERL–participation linkage is found in the comparatively weak associations in Japan between SERL and psychological involvement reported in Table 2. As the multivariate and path analysis models demonstrated, the network and psychological involvement variables have the dominant effects on participation levels and any effect that socio-economic resource level has on participation is mediated through these variables. The Verba et al. model predicts a strong association between SERL and psychological involvement. What the model fails to consider is the strong impact of group and network affiliations on psychological involvement. We found that psychological involvement was far more likely to vary with network involvement than socio-economic resource levels. We also found that both network and psychological involvement were necessary to induce high levels of participation. The absence of either component seems to have a killing effect on participation levels, especially for the harder mode of participation, campaign activity.
About the author
Aie-Rie Lee is Professor of Political Science at Texas Tech University. Her areas of specialization include comparative political behavior with an emphasis on East Asia, political development, democratization, and gender politics. Her work has appeared in such journals as Comparative Political Studies, Social Science Quarterly, International Journal of Public Opinion Research, Journal of East Asian Studies, Journal of Northeast Asian Studies, Asian Survey, Studies in Comparative International Development, Asian Affairs, Policy Studies Journal, Energy Sources, and Women and Politics.