Introduction
Epithermal deposits are the products of large-scale hydrothermal convective systems driven by magmatic heat in the upper 1–6 km of the Earth's crust, typically associated with andesitic volcanoes (Lindgren, Reference Lindgren1933; Henley and Ellis, Reference Henley and Ellis1983). Epithermal ores form over the temperature range of <150°C to ~300°C, from the surface to as deep as 1–2 km (White and Hedenquist, Reference White and Hedenquist1995). Three types of deposit are defined on the basis of sulfidation state, the content of noble metals and base-metal sulphides, in the pH conditions and the depth of formation: low-sulfidation (LS), intermediate-sulfidation (IS) and high-sulfidation (HS) (Hedenquist et al., Reference Hedenquist, Arribas and Gonzalez-Urien2000). The first two groups were formed from near-neutral pH fluids, whereas the initial fluid of the HS type has an acidic pH (Hedenquist et al., Reference Hedenquist, Arribas and Gonzalez-Urien2000; Hedenquist and Arribas, Reference Hedenquist and Arribas2017). The HS deposits (Au–Ag–Cu–As style) differ from others by greater depth of formation (100 to 900 m) (Hedenquist and Arribas, Reference Hedenquist and Arribas2017). The presence of high-sulfidation state sulfide minerals indicates high-oxidation states typical for acidic hypogene fluids. Hydrothermal fluids forming epithermal gold deposits are Au-saturated in most cases (Zhu et al., Reference Zhu, An and Tan2011). Ascending Au-bearing fluids migrate upwards along faults and permeable horizons. As they do so, their temperature decreases in combination with mixing with near surface fluids, leading to deposition of the carried metals. The intensely leached volcanic rock composed mainly of quartz is the product of very acidic conditions (pH <1 to >3) (White and Hedenquist, Reference White and Hedenquist1995) that occur within a sulfate-rich hydrothermal fluid (Arribas, Reference Arribas and Thompson1995). Neutralization of the acidic solution by reaction with wallrock results in alteration zones that are defined by the presence of alunite, kaolinite, illite and montmorillonite ± chlorite (Steven and Ratte, Reference Steven and Ratte1960).
The HS epithermal deposits associated with volcanic belts are late Mesozoic and Cenozoic in age and are associated with Late Cretaceous to present day subduction zones of the Pacific rim (Volkov and Sidorov, Reference Volkov and Sidorov2013). The characteristic features of HS are: (1) the predominance of disseminated ore with subordinate veins in the gangue (residual quartz, alunite, baryte, anhydrite, kaolinite); (2) the ore minerals include pyrite, enargite, chalcopyrite, tennantite, covellite, gold and Au-tellurides; (3) the main metals are Au, Ag, Cu, As, Pb, Hg, Sb, Te, Sn, Mo and Bi (Arribas, Reference Arribas and Thompson1995; White and Hedenquist, Reference White and Hedenquist1995; Hedenquist and Arribas, Reference Hedenquist and Arribas2017). High-sulfidation epithermal deposits worldwide typically have Au grades in the range of average values 0.6–2.7 ppm according to Volkov et al., (Reference Volkov, Savva, Sidorov, Kolova, Chizhova and Alekseev2015) and 0.01–68.0 ppm according to Liu et al., (Reference Liu, Zheng and Liu2000). As a rule, these are multistage deposits. The mode of gold occurrence changes during the evolution of ore-forming systems, as well as under the influence of superimposed processes (oxidation and secondary enrichment). In the East of Russia, only two deposits of HS type in the Khabarovsk region (White Mountain and Svetloe) have been reliably established, but they have not been extensively studied (Volkov et al., Reference Volkov, Savva, Sidorov, Kolova, Chizhova and Alekseev2015).
The aim of this research is to understand why, along with the general features characteristic of HS epithermal deposits, such unusual minerals are found in this particular ore occurrence: Au selenides, Au sulfoselenotellurides and Au oxide. We characterize the mineral assemblage of the Gaching deposit, and use mineral parageneses and available experimental and thermodynamic data to interpret the conditions of formation of these natural assemblages. We employed a thermodynamic approach (Xu et al., Reference Xu, Fan, Hu, Santosh, Yang, Lan and Wen2014) to gauge relative stabilities of sulfide, selenide, telluride and oxide minerals as a function of fugacity of S2, Te2, Se2 and O2.
Geological setting and ore geology
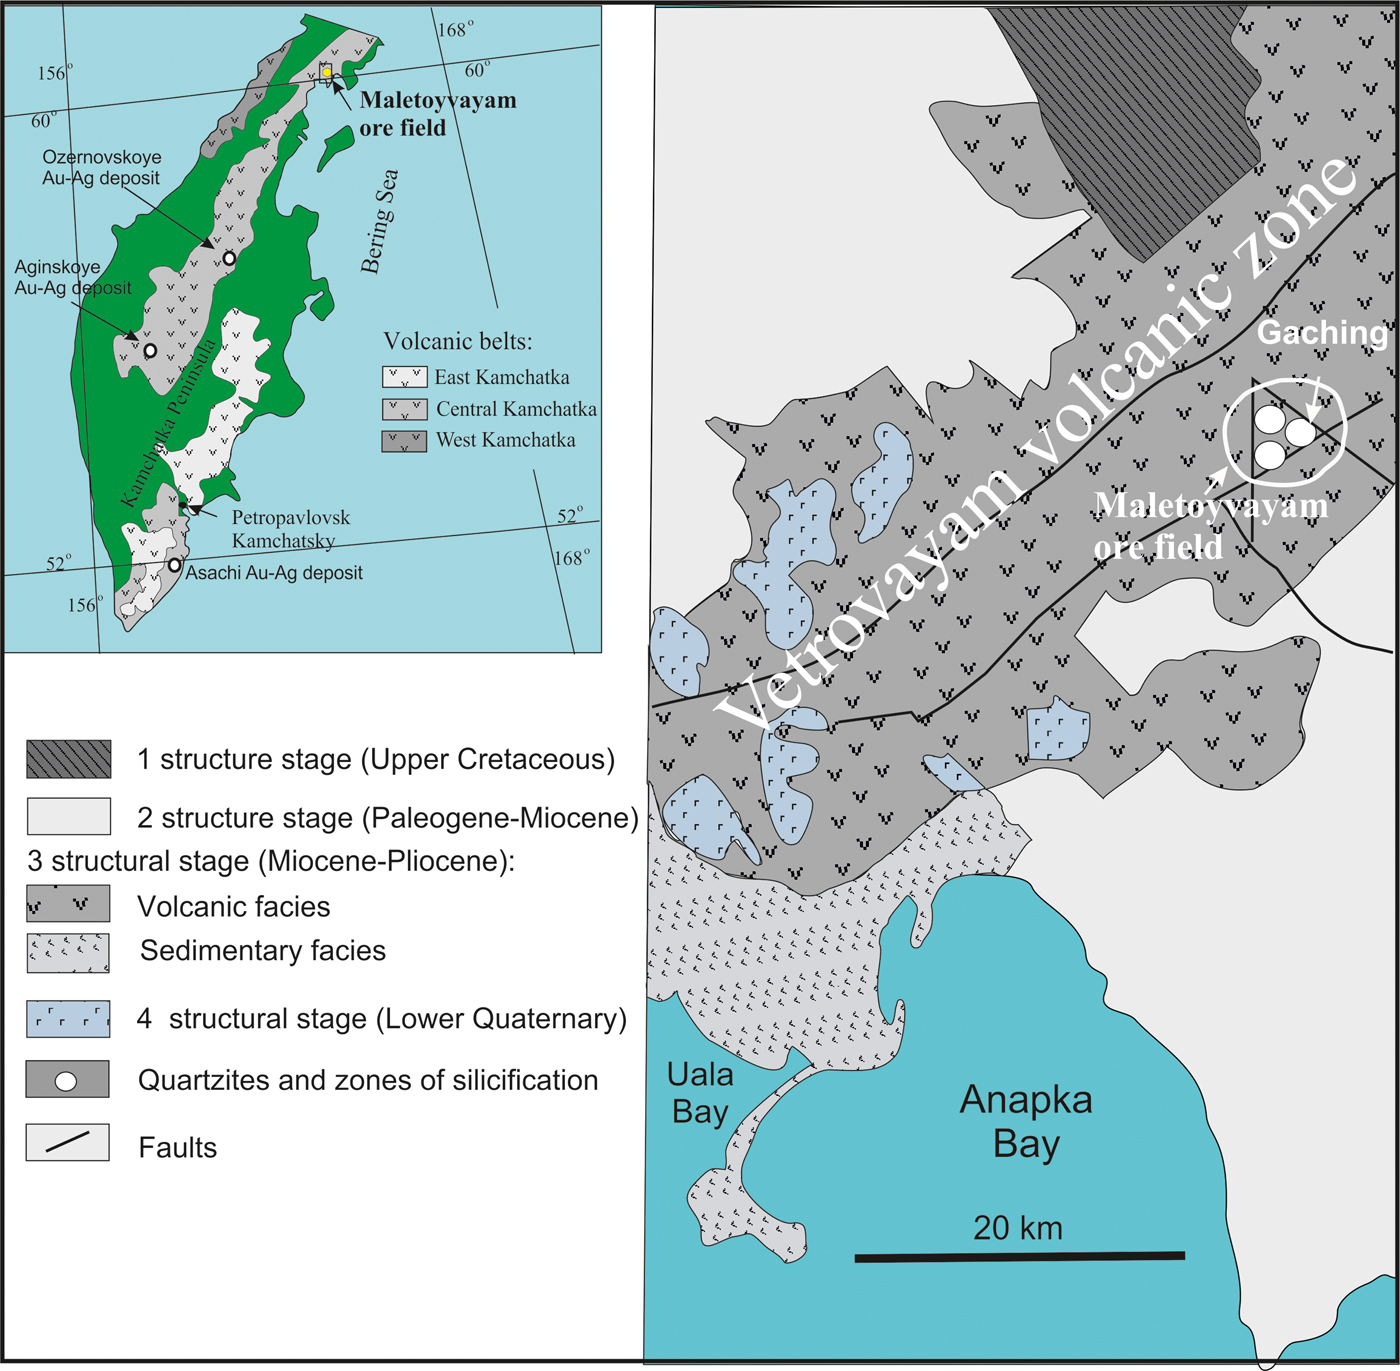
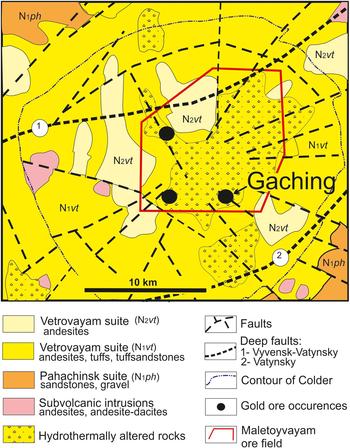
The Central Kamchatka volcanic belt (Russia) is ~1800 km long and is controlled by the Main Kamchatka deep fault (Fig. 1). A number of gold-silver epithermal deposits (Ozernovskoe, Asachinskoe, Aginskoe and others) have been identified within the belt (Goryachev et al., Reference Goryachev, Volkov, Sidorov, Gamyanin, Savva and Okrugin2010; Yablokova et al., Reference Yablokova, Zobenko and Lobzin2014). Gold-silver deposits (Vetrovaym and Maletoyvayam ore fields), associated with metasomatic quartzites are confined to volcanic-tectonic structures within the Vetrovayam volcanic zone of the northeastern Central Kamchatka volcanic belt (Fig. 1) and the southwestern part of the Koryak Highland (Golyakov, Reference Golyakov1980; Melkomukov et al., Reference Melkomukov, Razumny, Litvinov and Lopatin2010). The Maletoyvayam ore field is composed of sediments of the Vetrovayam suite: andesites, tuffs and tuffaceous sandstones (Fig. 2). The metasomatic quartzites located in the central parts of the field to the periphery are replaced successively by alunite-, sericite-kaolin-quartz and kaolin-quartz quartzites; the outer parts of the field are composed of argillizites and propylites (Melkomukov et al., Reference Melkomukov, Razumny, Litvinov and Lopatin2010). The Au content in Maletoyvayam deposits reaches 8.8 ppm (2.66 average) (Melkomukov et al., Reference Melkomukov, Razumny, Litvinov and Lopatin2010) and up to 144 ppm according to data of the Kamakhken geological and geophysical expedition (http://kgge.ru/?page_id=443, in Russian).
Volcanic belts of the Kamchatka Peninsula (Tsukanov, Reference Tsukanov2015), the tectonic scheme of the Vetrovayam volcanic zone (Golyakov, Reference Golyakov1980) and location of Maletojevayam ore field on the base Melkomukov data (Reference Melkomukov, Razumny, Litvinov and Lopatin2010).
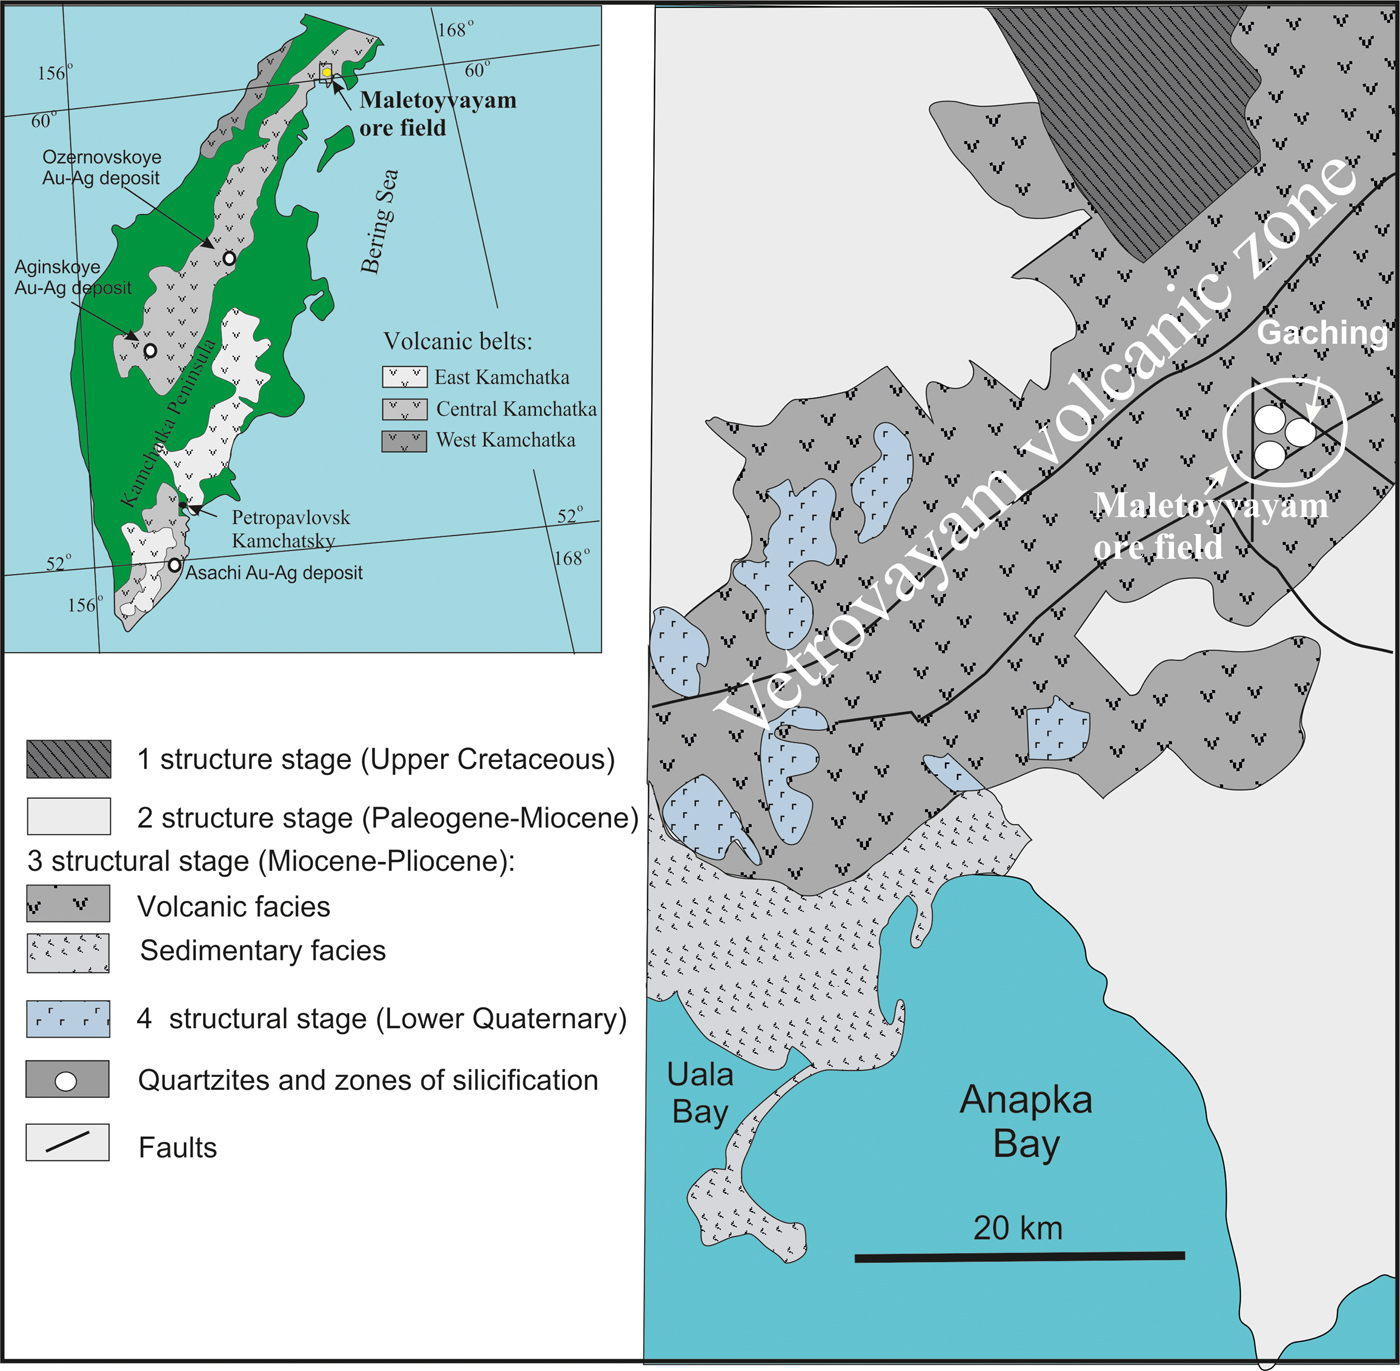
Geological map of the Maletoyvayam ore field and the location of the Gaching ore occurrence, modified after Lyashenko and Mikhaylova (Reference Lyashenko and Mikhaylova1972).
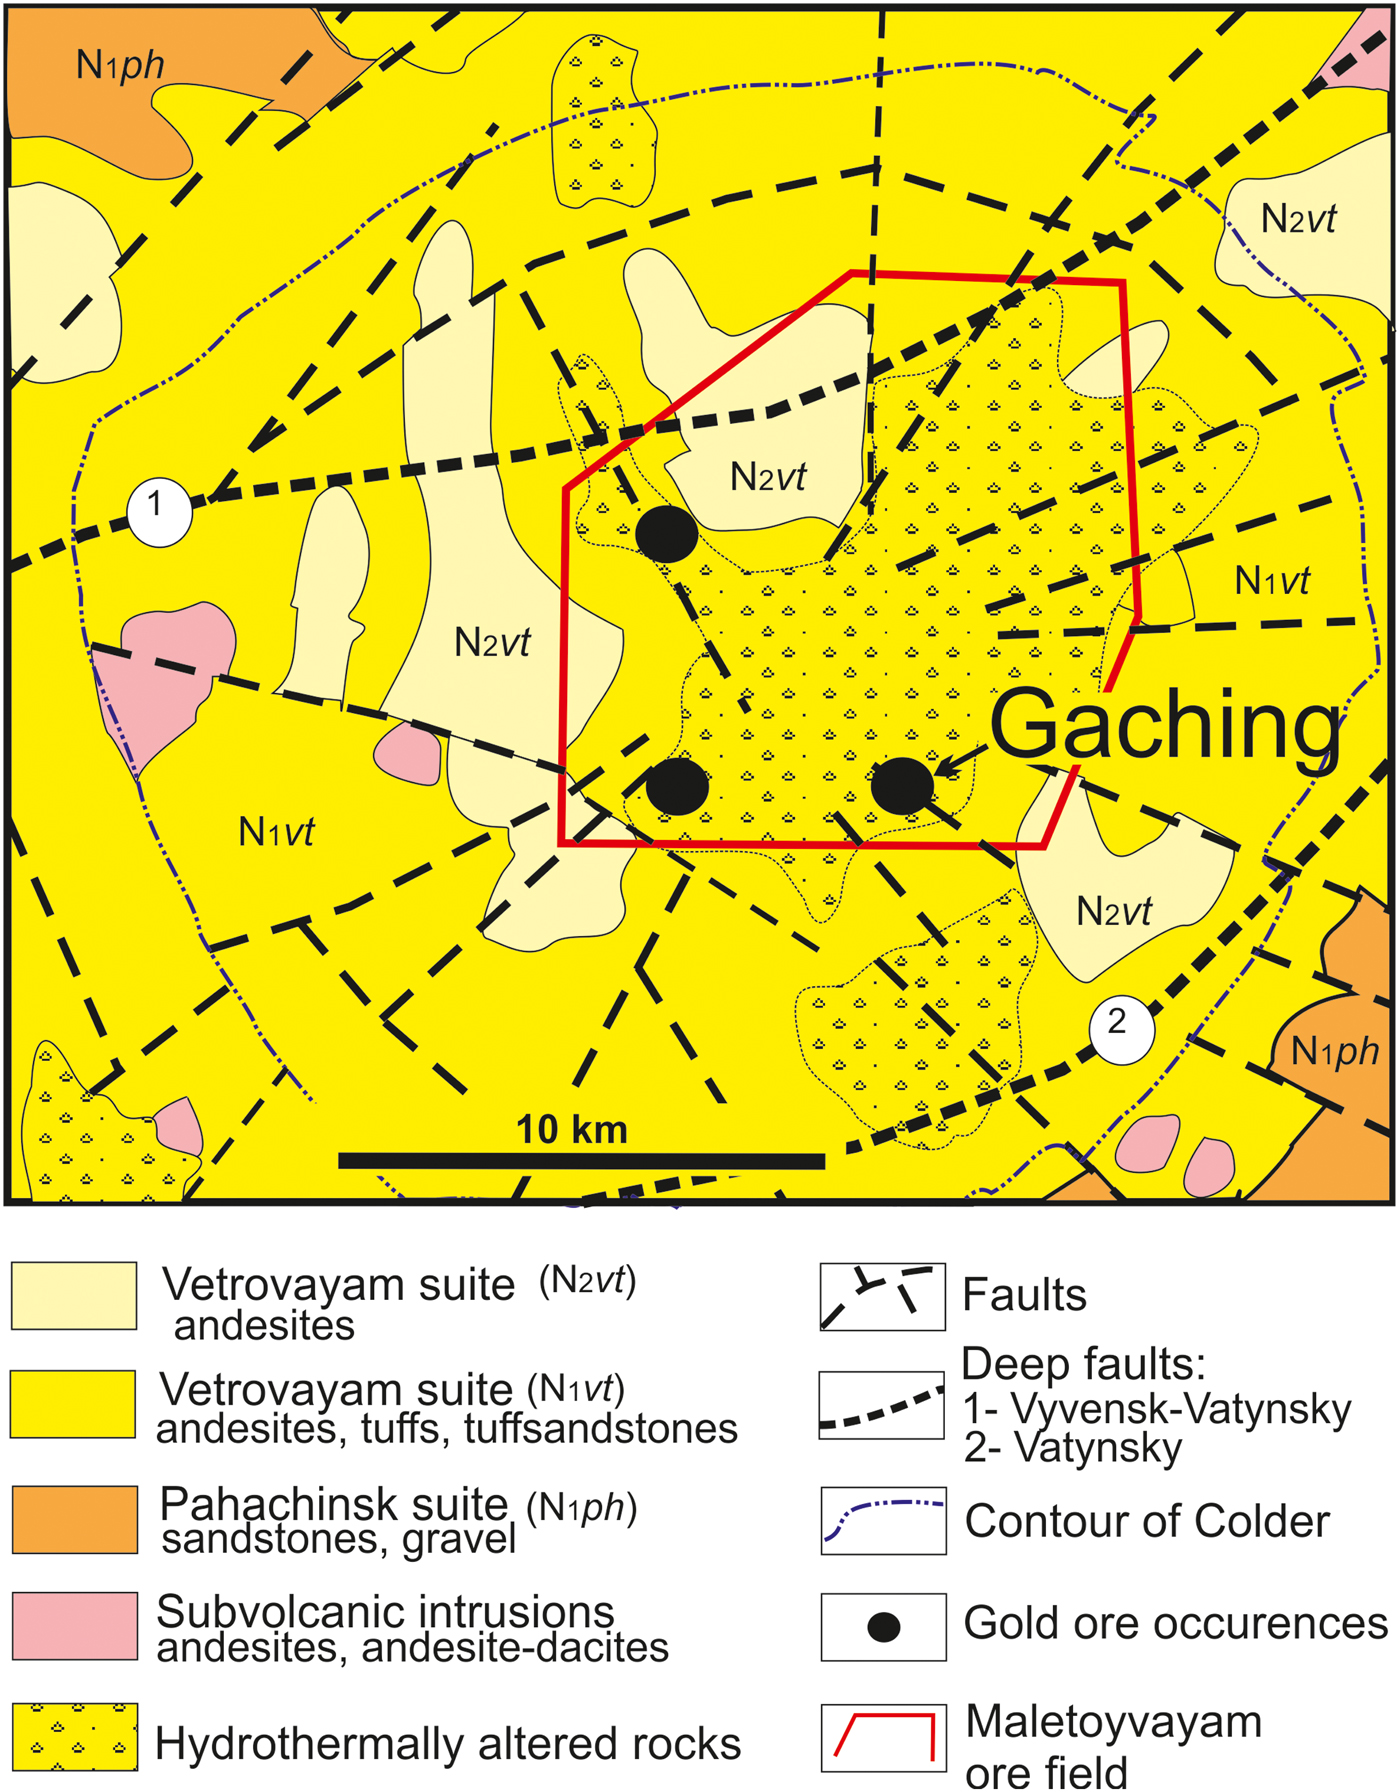
Three ore occurrences were contoured within the Maletoyvayam ore field (Gaching, Jubilee, South-West areas) at which geological and exploration works started in 2010. It was found previously that the main ore minerals in the Jubilee ore occurrence are pyrite, Cu- sulfosalts and native gold; gangue minerals are quartz, alunite, native sulfur and kaolinite; the ore textures are interspersed, veined, banded, and combinations thereof (Kalinin et al., Reference Kalinin, Andreeva and Yablokova2012). Based on the characteristic mineral assemblages (White and Hedenquist, Reference White and Hedenquist1995; Hedenquist and Arribas, Reference Hedenquist and Arribas2017) the Jubilee ore occurrence is related to the HS type. Numerous varieties of mustard gold have been identified (Kudaeva and Andreeva, Reference Kudaeva and Andreeva2014), various types of pyrite (Yablokova and Zobenko, Reference Yablokova and Zobenko2013) and native sulfur of industrial importance have been found in the Jubilee occurrence of the Maletoyvayam ore field (Plutahina and Shishkanova, Reference Plutahina and Shishkanova2014). The Gaching occurrence is located at the head of the Gachingalhovayam River and represents a quartz stockwork hosted by the secondary quartzites and intensely oxidized quartz-alunite rocks (Melkomukov et al., Reference Melkomukov, Razumny, Litvinov and Lopatin2010). The visible thickness of the ore zone is 50 m and the length is 500 m (Mining Bulletin of Kamchatka, 2011). The Au mineralogy of the Gaching ore occurrence is described by Tolstykh et al. (Reference Tolstykh, Vymazalova, Petrova and Stenin2017).
Methods
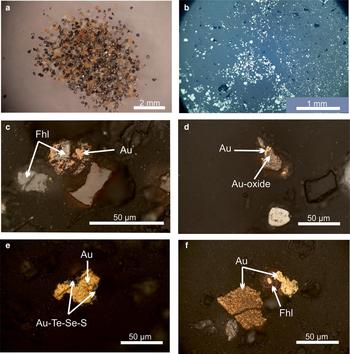
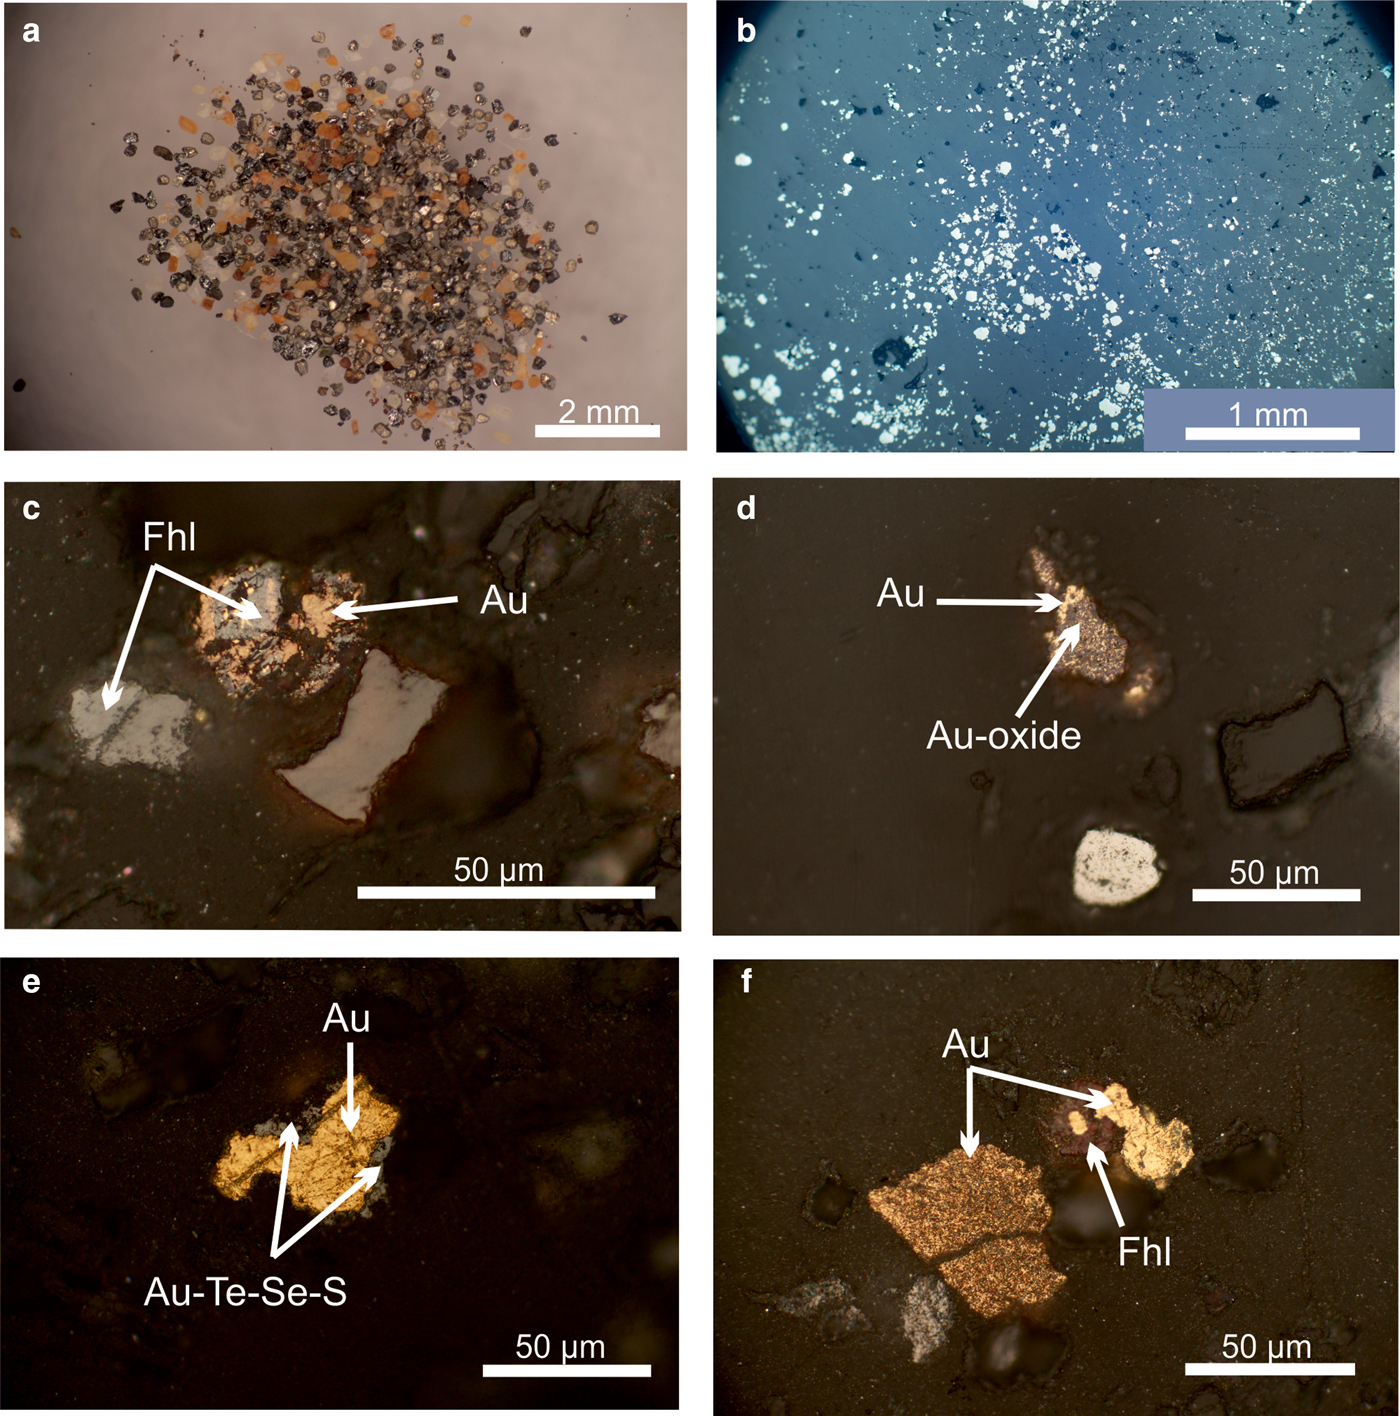
The samples studied, of total weight 20 kg, were obtained from the research and production company ‘Eleechem’. Samples of oxidized alunite-quartz rocks were crushed and concentrated to a heavy fraction obtained by hydroseparation followed by concentration in the heavy liquid bromoform, (CHBr3). This fraction consisted mainly of baryte, anglesite, an admixture of ferruginous quartz, pyrite, gold, Au- selenotelluride and other rare minerals (Fig. 3a). Gold minerals were found in fractions smaller than 0.16 mm. Minerals from the concentrate were prepared in polished sections and examined in reflected light, by electron microscope and by electron microprobe. More than 100 composite grain aggregates including Au minerals from a heavy concentrate and ~30 grains of associated minerals from the lighter fractions were selected. A total of ~500 analyses were performed using energy dispersive spectroscopy (EDS) and ~64 using wavelength dispersive spectroscopy (WDS) systems.
Ore minerals from the Gaching ore occurrence. (a) The heavy fraction of the sample (pyrite, baryte, anglesite, gold and other minerals); (b) dissemination of pyrite in quartzite (polished section in reflected light); and (c–f) native gold (polished sections in reflected light) in intergrowths with sulfosalts and Au-selenotelluride.
The chemical compositions of the minerals and texture of the mineral aggregates and separate grains were examined at the analytical centre for multi-elemental and isotope research of the V.S. Sobolev Institute of Geology and mineralogy SB RAS in Novosibirsk using a LEO-413VP scanning electron microscope (SEM) with INCA Energy 350 microanalysis system (Oxford Instruments Ltd) equipped with EDS (analysts Dr. N. Karmanov, M. Khlestov, V. Danilovskaya), operating at an accelerating voltage of 20 kV, current intensity of 0.4 nA, 50 s measuring time and beam diameter of ~1 µm. The following standards were used: pure metals (Ag, Au, Bi, Se, Sb, Fe, Cu), pyrite (S), synthetic HgTe (Te) and sperrylite (As). The detection limit was 0.02%. The following X-ray lines were selected: Lα for Ag, Te, As, Sb and Se; Kα for S, Fe, Cu and O; and Mα for Au and Bi.
Microprobe WDS Analyses of tellurides, selenides and sulfoselenotellurides of Au were carried out at 20 kV and 50 nA, on a JEOL JXA-8230 microprobe (beam size ~1 mm) (analysts V. Korolyuk). The following X-ray lines (and standards) were used: SeLα (Bi2Se3), TeLα (AgTe2), AgLα (Ag), SKα (CuFeS2) and AuMα (Au). These results were also processed using ZAF correction routines in the native JEOL software. Values of the minimum detection-limit are <0.05% for all of the elements analysed. All the data in the tables are listed according to the detection limits of the elements. The accuracy and reproducibility of the analytical procedures were evaluated with special tests (Korolyuk et al., Reference Korolyuk, Usova and Nigmatulina2009; Lavrent'ev et al., Reference Lavrent'ev, Karmanov and Usova2015).
Results
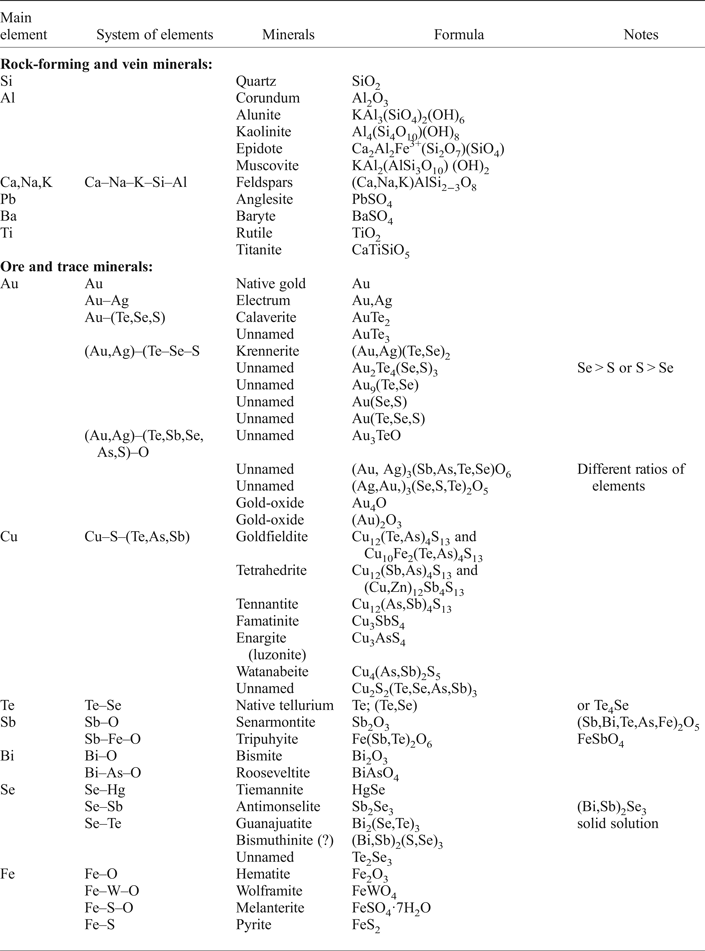
Our studies have shown that pyrite is the dominant sulfide present in the Gaching deposit. Quartzite host rock includes pyrite as impregnations of coarse grains ranging from a few tens of micrometres to 0.25 mm in diameter (Fig 3b). The ore minerals at the Gaching are always associated with white quartz, whereas grey quartz, which is common in other parts of the Maletoyvayam ore field (Jubilee, South-West areas), is rare here. Fine-grained quartz usually has a brown colour due to iron hydroxides. In these rocks, the intensity of oxidation varies from medium to high. Other rock minerals include baryte, anglesite, kaolinite and alunite (Table 1). Ore minerals include Cu-, Zn-, Sb-, As-, Te-bearing sulfosalts (tennantite–tetrahedrite, goldfildite), native gold and electrum, Au(Ag)-telluride (calaverite, krennerite) and various Au oxides of complex and variable composition. Additional trace ore minerals include senarmontite, tripuhyite, rooseveltite, tiemannite, antimonselite, guanajuatite and wolframite (Table 1).
Minerals assemblage from the Gaching ores.

Gold
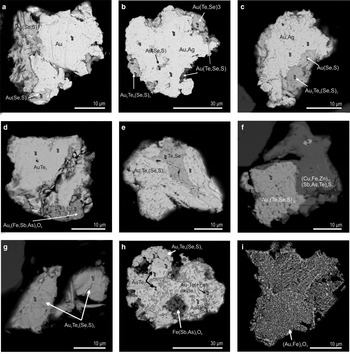
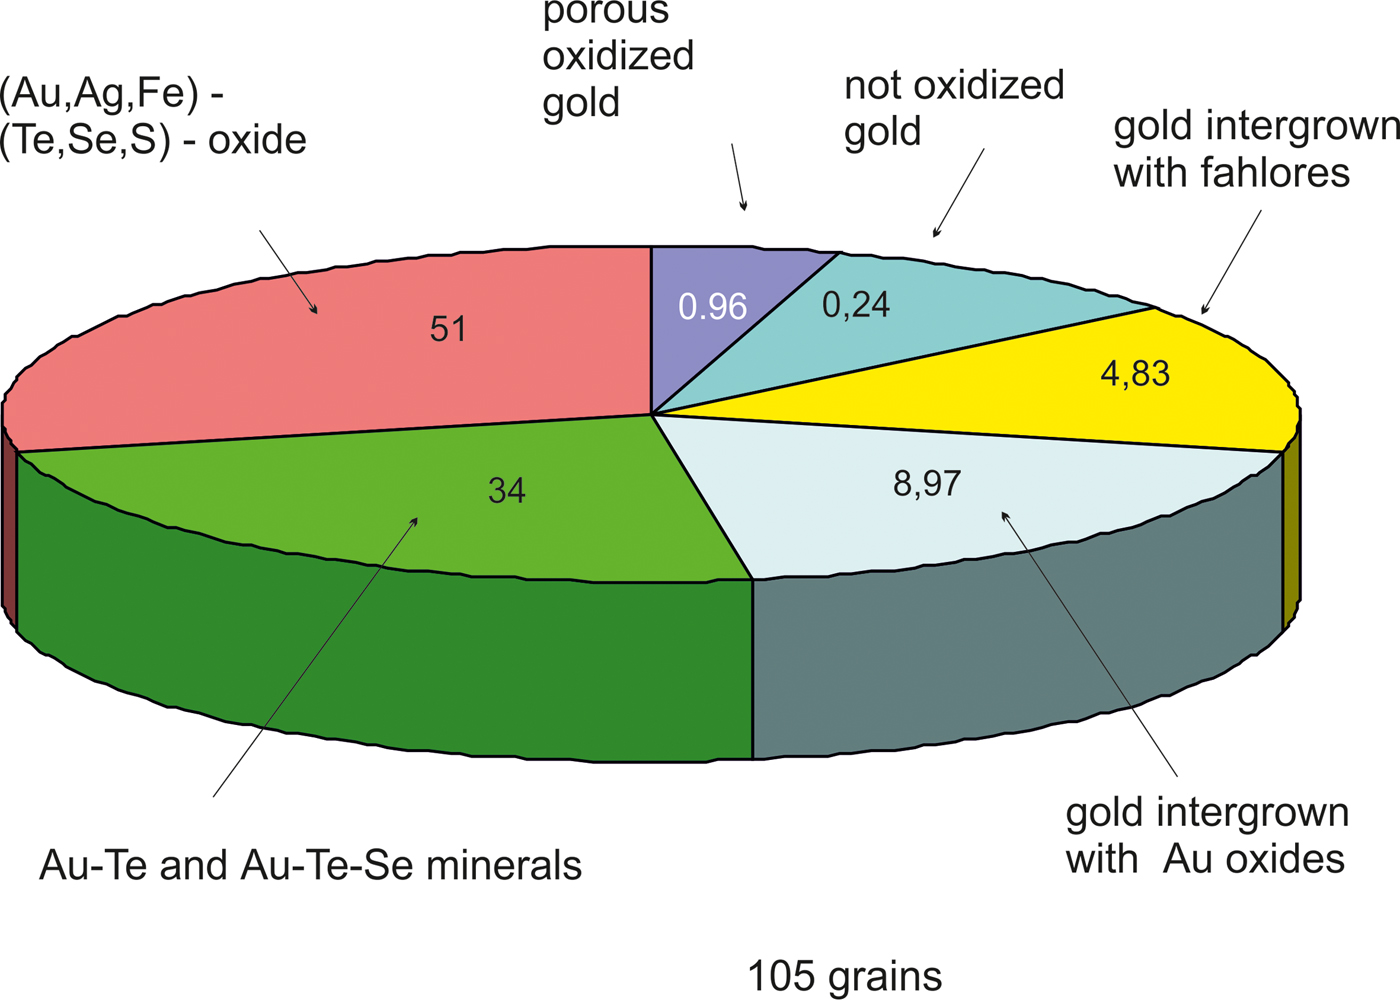
Native gold at the Gaching occurs in subordinate abundance (15%) compared to other Au- and Ag-bearing minerals. Colour varies from bright yellow to brown-yellow and brown under reflected light and occurs in grains up to 10–50 µm, or locally 60 µm, in diameter (Figs 3c–f and 4a–c). Native gold exhibits variable morphology. Grains of native gold are xenomorphic with a lumpy shape. Along with homogeneous grains, porous structured grains (mustard gold) are observed (Fig. 3f).
SEM images of Au (±Ag) minerals from the Gaching mineralization. (a–c) Native gold in intergrowths with unnamed phases of different compositions; (d) calaverite AuTe2 partly replaced by Au oxide; (e) unnamed Au2Te4(Se,S)3 in intergrowths with Te-Se solid solution; (f) unnamed Au3(Te,Se,S)10 in intergrowths with tetrahedrite; (g) grains of unnamed Au2Te4(Se,S)3; (h) calaverite AuTe2 partly replaced by Au–Te oxide and in intergrowths with tripuhyite FeSb2O6; (i) Au–Fe oxide.

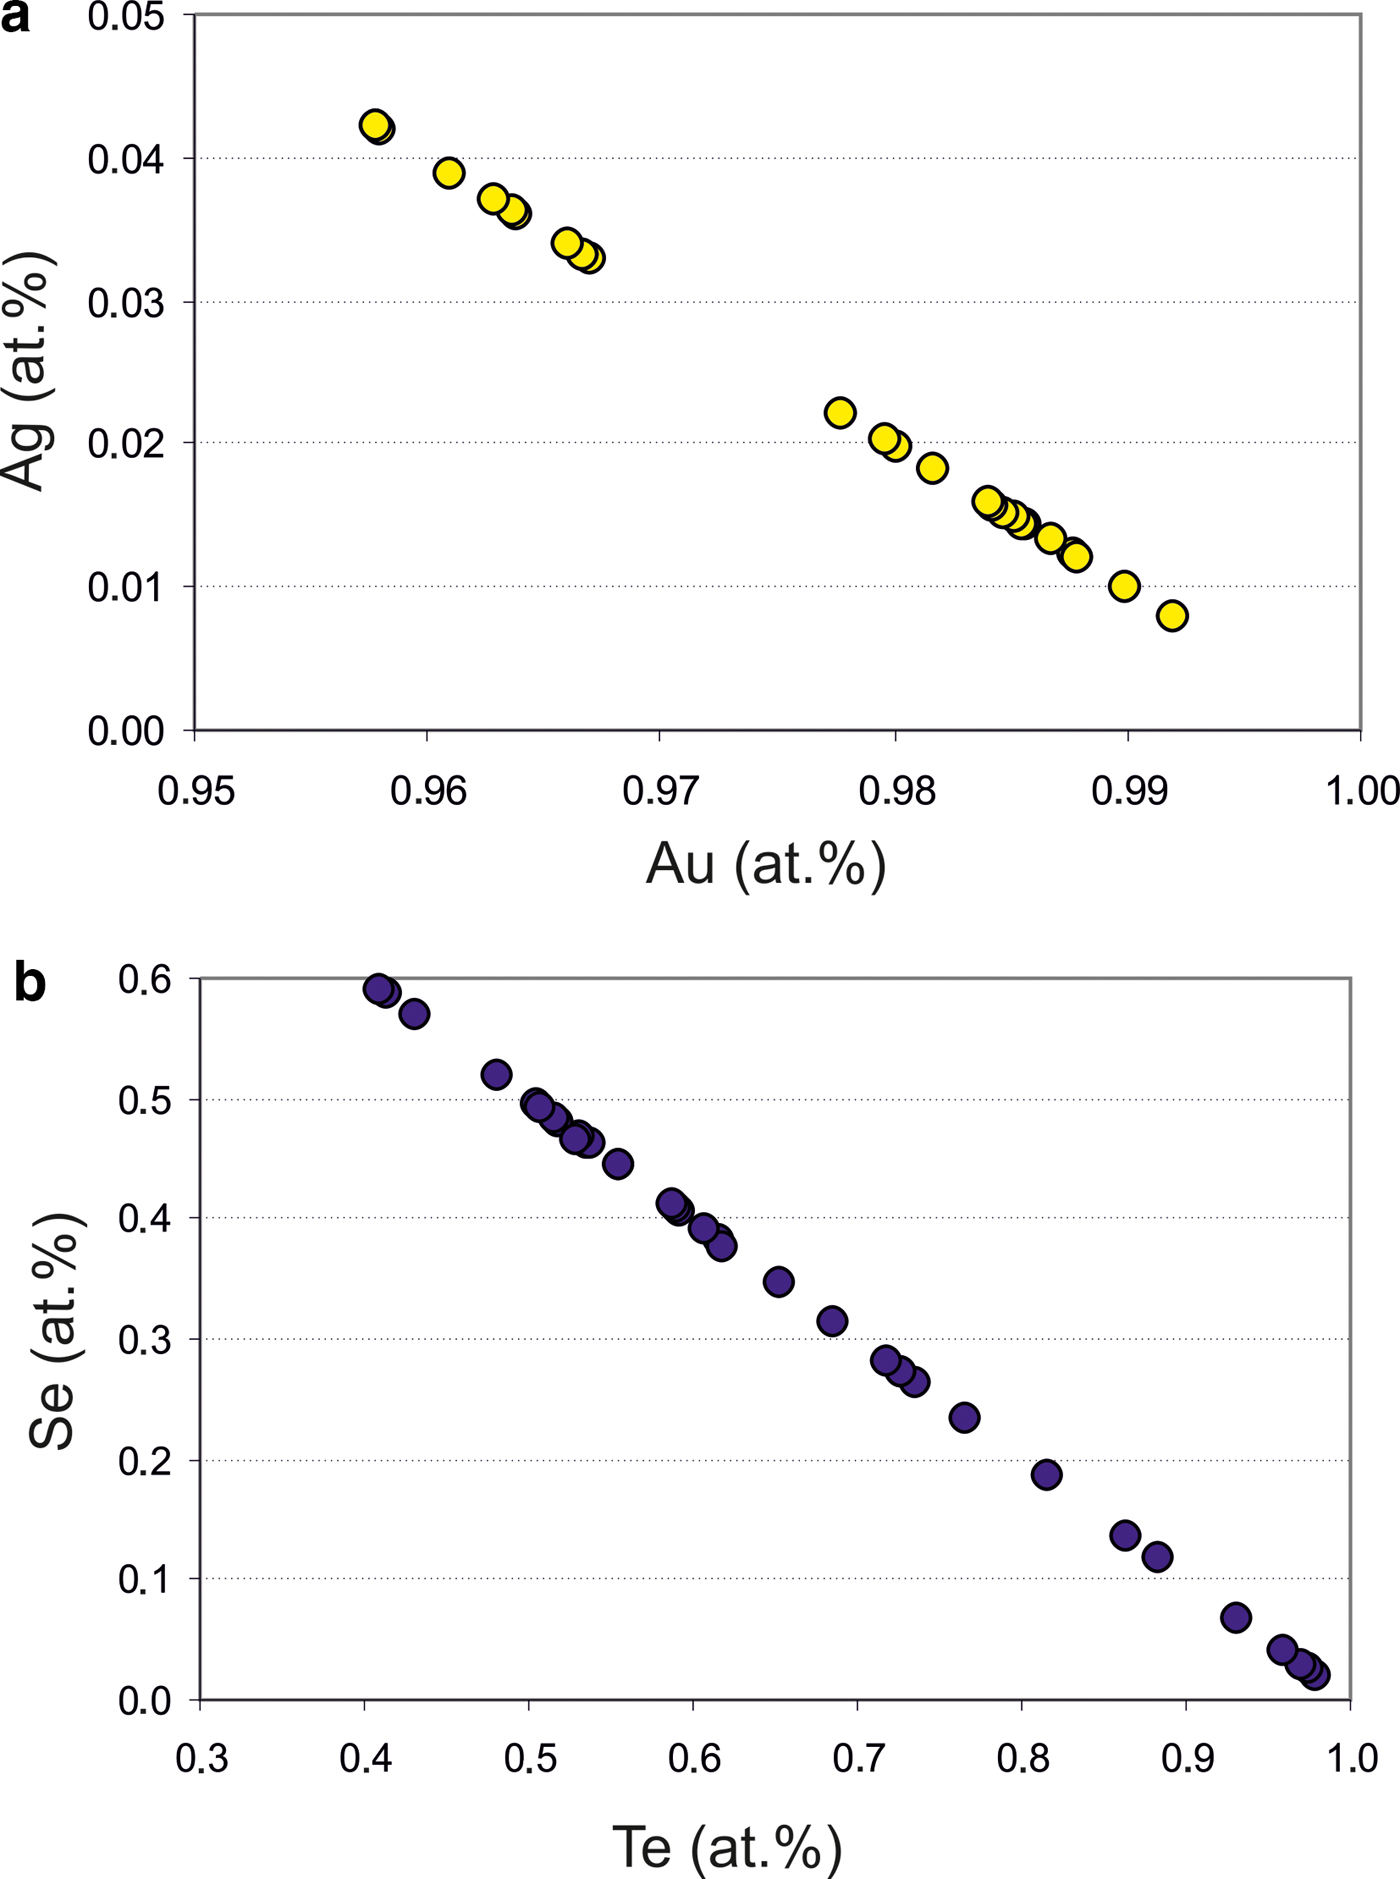
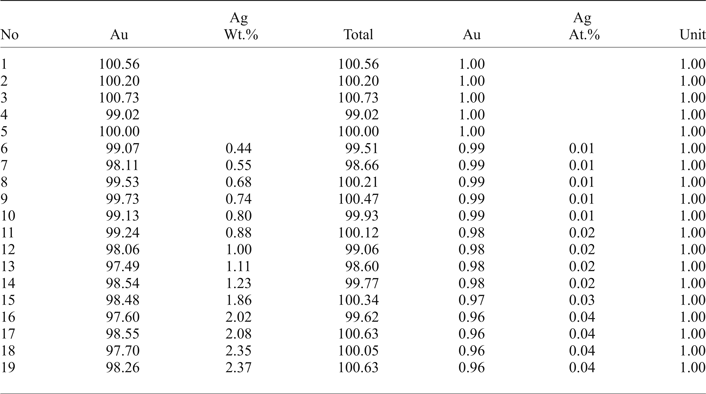
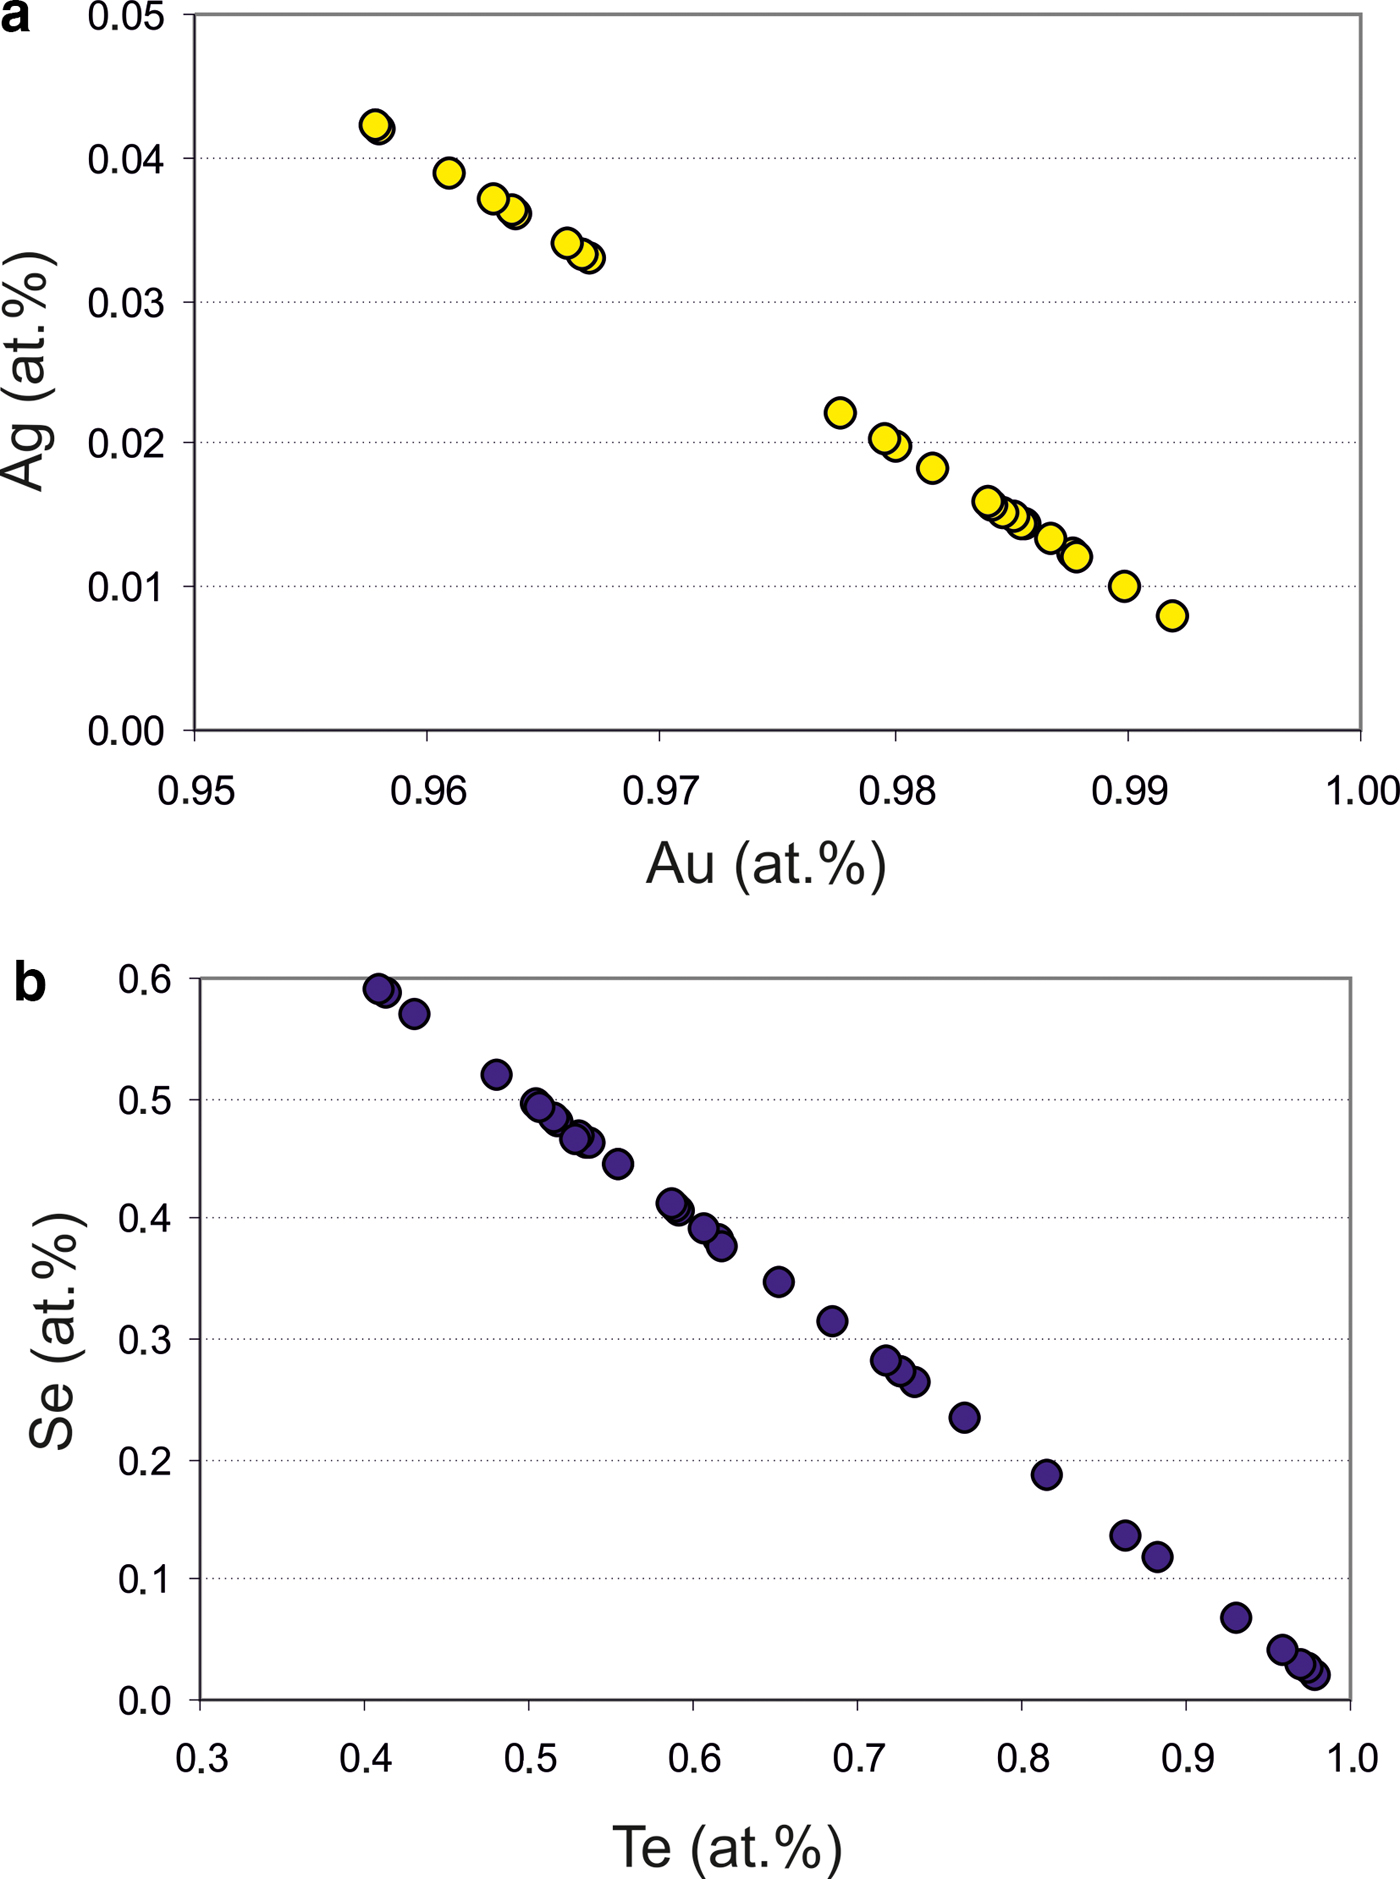
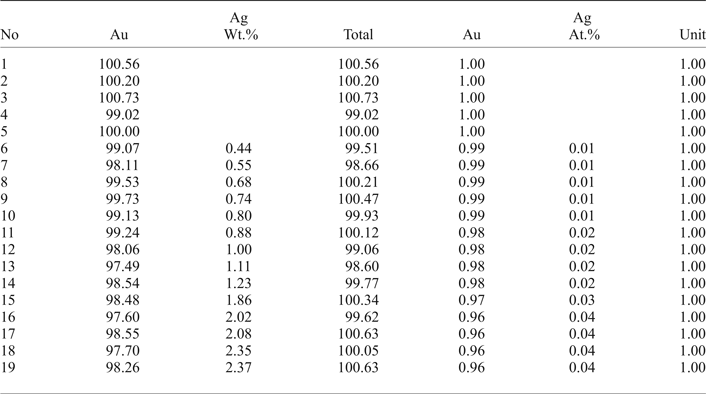
The native gold is common, but may contain minor Ag up to 2.37 wt.% (Table 2). Therefore, the fineness of gold varies in the range of 960–1000 (Fig. 5a). The mustard high-purity gold and oxidized gold contain impurities of Fe due to iron hydroxides localized in the thin cracks of grains. Native gold is predominantly intergrown with Au-selenotelluride and complex Au-bearing oxides and tetrahedrite or goldfieldite (Fig. 3c,f). The gold grains at the edges are surrounded by Au(Se,S) or Au(Te,Se,S) minerals (Fig. 4a–c) that have never been found before in nature.
Composition of Au–Ag (a) and Te–Se (b) solid solutions from the Gaching ore occurrence.
Compositions of Au-Ag solid solutions from Gaching ore occurrence.
Au-telluride and Au-sulfoselenotelluride
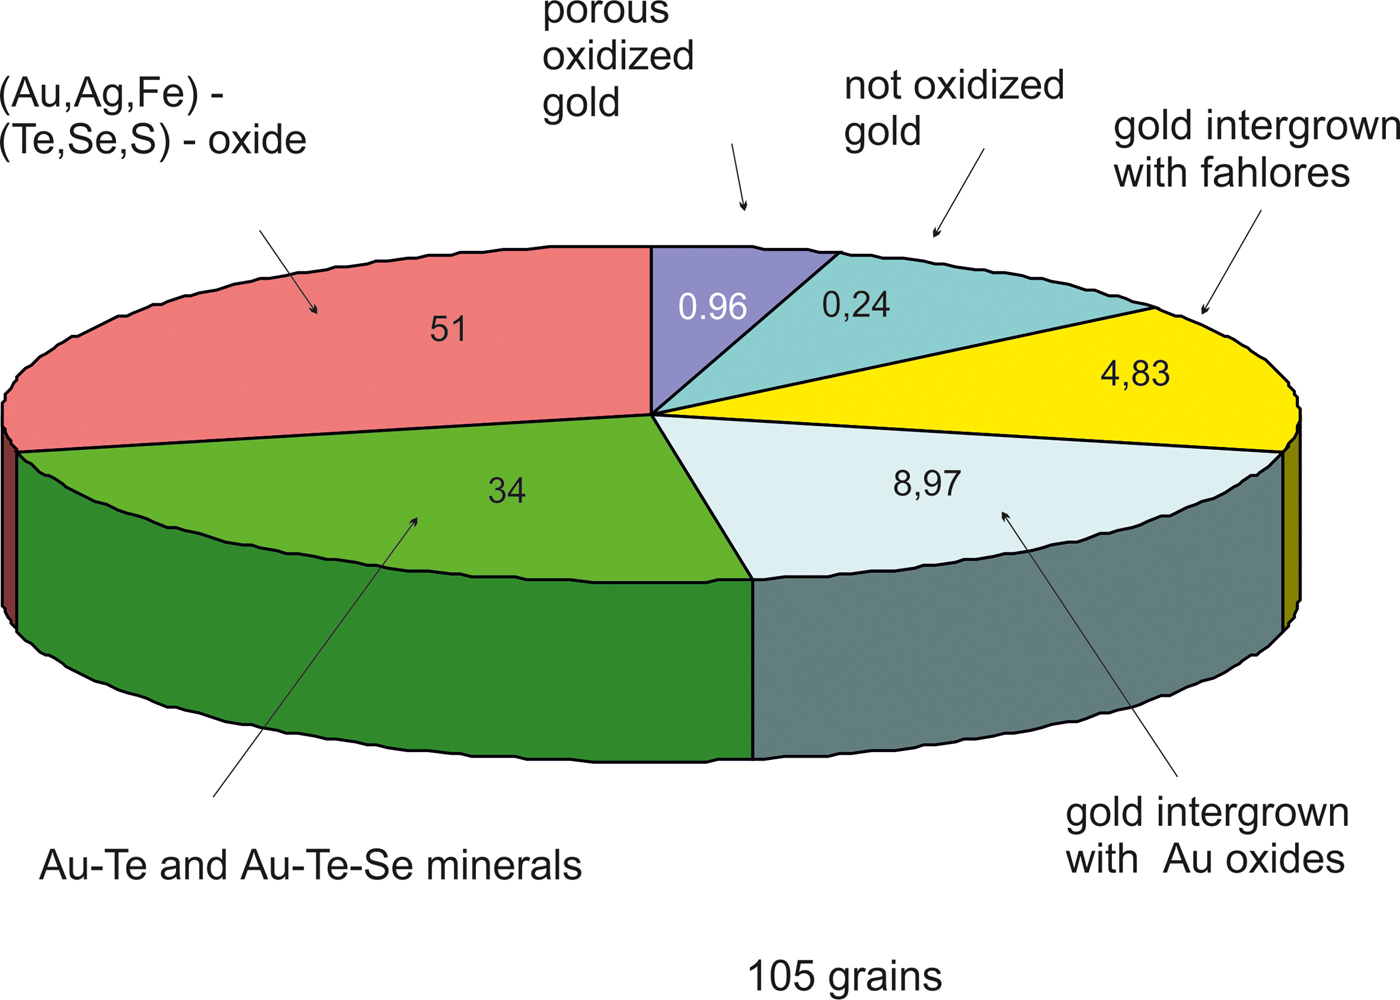
The main minerals from the Gaching Au ± Ag assemblage are Au(±Ag)-tellurides and Au-sulfoselenotellurides (Fig. 6) that include calaverite, krennerite, and an unnamed phase of varying composition (Table 1), oxidized to varying degrees (Fig. 4d,h). They are commonly intergrown with Se-rich tellurium (Fig. 4e), and occur in association with sulfosalts (Fig. 4f). The grain sizes for the Au(±Ag)-sulfoselenotellurides do not exceed 60 µm. Krennerite contains up to 2.84 wt.% Ag, and both minerals (calaverite, krennerite) are Se-rich, containing 0.73–2.08 wt.% Se (Table 3).
The proportion of Au-bearing minerals from the Gaching ore occurrence (in %).
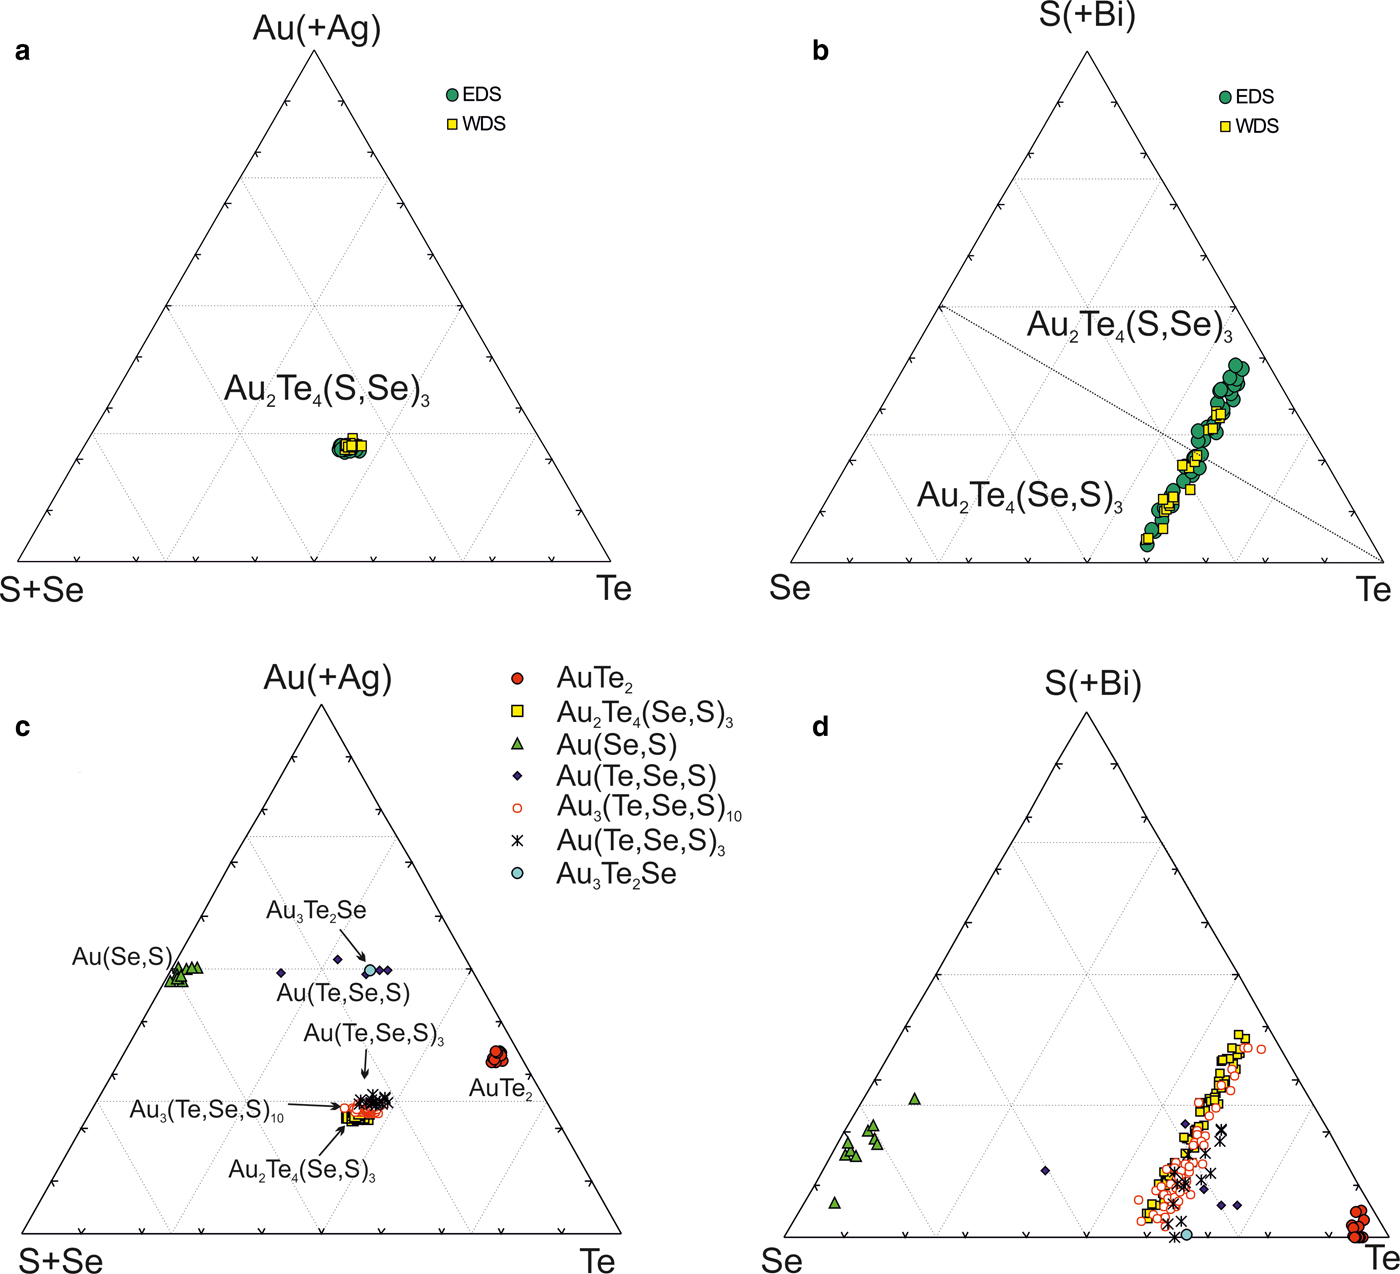
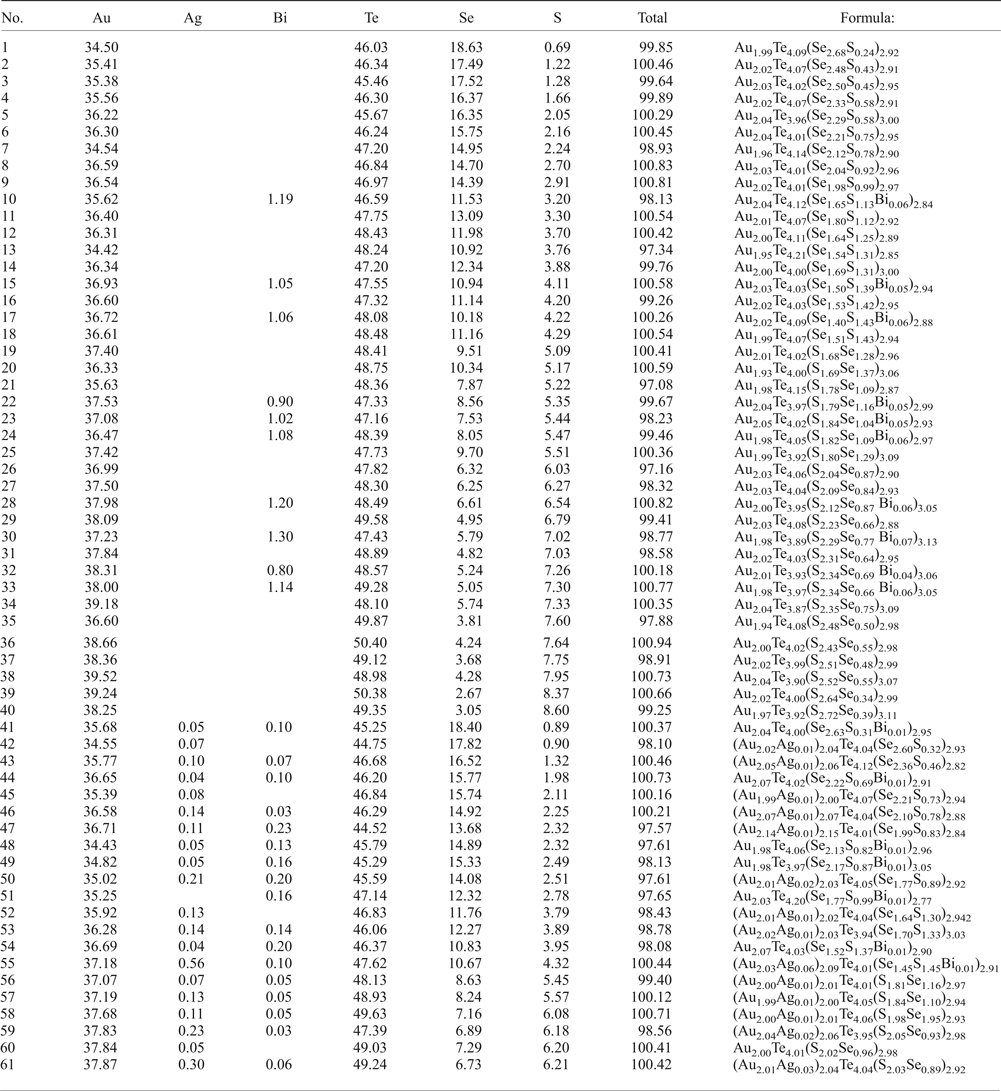
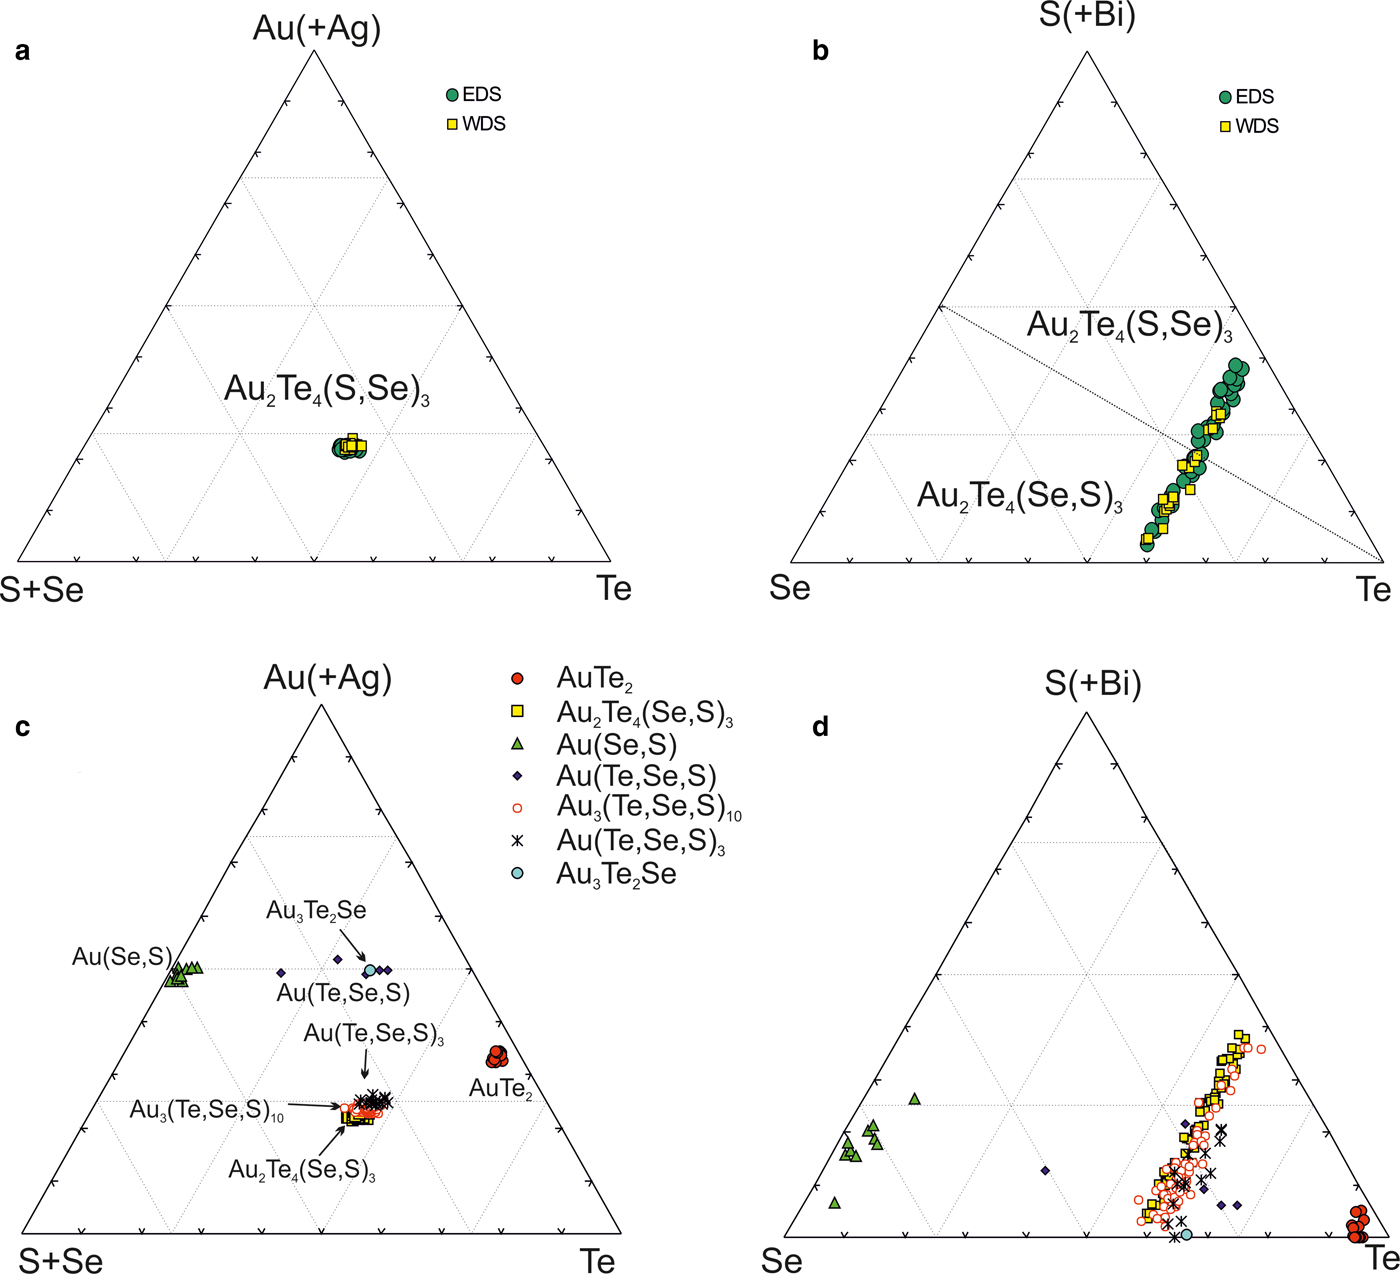
The new unnamed phase Au2Te4(Se,S)3 is the most common phase among the other Au minerals. It has not previously been found in nature. However, the synthetic phase Au2Te4Se3 was reported from the experimental study of Wang (Reference Wang2000). Hundreds of grains of this composition are found in the association under study. The Au2Te4(Se,S)3 phase occurs as distinct grains (Fig. 4g), intergrown with native gold (Fig. 4c), Te–Se solid solutions (Fig. 4e) and members of the tennantite–tetrahedrite solid-solution series (‘fahlores'). This phase was analysed by both microbeam methods (EDS and WDS, Table 3) with a convergence of results (Fig. 7a). This phase is a potentially new mineral that seems to have both Se- and S-rich end-members (Table 4, Fig. 7b). This comparison of the results obtained by different methods verifies the accuracy of EDS (SEM) analyses, also employed for numerous analyses of other minerals. Analysis of the numerous grains of the Au2Te4(Se,S)3 phase indicate some variation in Au(+Ag)/(Te + Se + S) ratio (Fig. 7c), allowing subdivision into three different phases: Au2Te4(Se,S)3, Au3(Te,Se,S)10 and the more Au-rich Au(Te,Se,S)3 (Fig. 7c). Both S-rich and Se-rich end-members of Au2Te4(Se,S)3 are found in the association. The complete isomorphic series between Au2Te4Se3 and Au2Te4S3 is shown (Fig. 7d). Unlimited substitution of sulfur for selenium is also observed in phase Au3(Te,Se,S)10 whereas for Au(Te,Se,S)3 only the Se-rich variety is characteristic. The existence of a continuous solid solution of Au–Ag–(S,Se) has been proved experimentally (Palyanova et al., Reference Palyanova, Seryotkin and Bakakin2016). All these three phases are close to each other in composition (see Fig. 7c,d). It is possible that they all belong to the same mineral species with some variations in the Au/(Te + Se + S) ratio.
Au minerals and unnamed phases from the Gaching mineralization. (a,b) Comparison of EDS and WDS analyses of unnamed Au2Te4(Se,S)3; (c,d) compositions of all minerals (EDS) in the systems: S + Se–Au (+ Ag) –Te (c) and Se–S + Bi-Te (d).
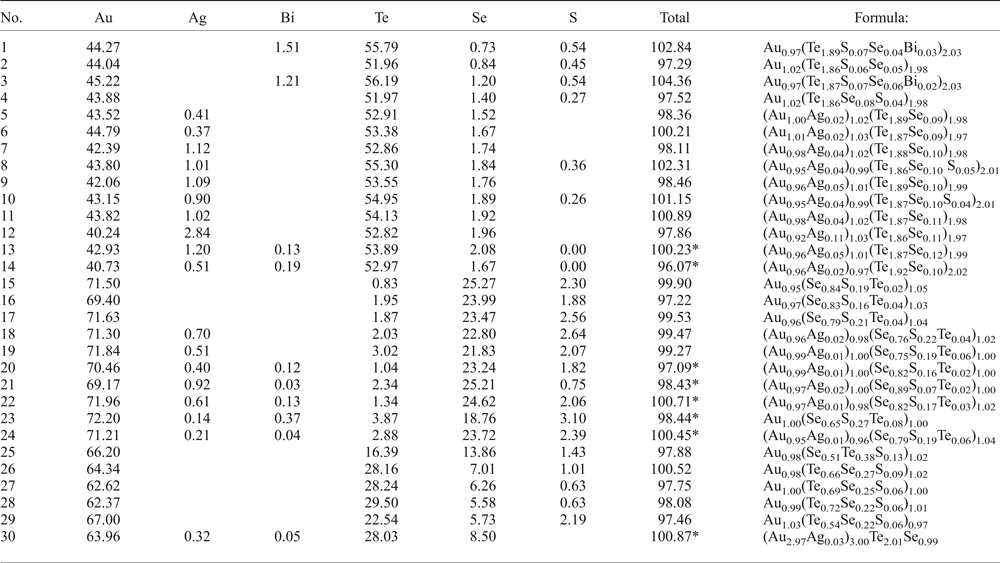
Au–Ag-telluride and -selenide from the Gaching mineralization.

1–4 − calaverite, 5–14 − krennerite, 15–30 − unnamed phases: 15–24 − AuSe, 25 − Au(Se,Te,S), 26–29 − Au(Te,Se), 30 − Au3Te2Se; * − WDS analyses, the rest are EDS analyses.
Composition (WDS and EDS) of unnamed Au2Te4(S,Se)3.

1–40 − EDS analyses, 41–61 − WDS anslyses; 1–18 and 41–55 − Se-rich, 19–40 and 56–61 − S-rich phases
The phases AuSe, or Au(Se,S,Te) and Au(Te,Se,S) were found in trace amounts in the Gaching occurrence. In all instances, these unnamed phases occur as intergrowths with the native gold (Fig. 4 a–c). The phase AuSe is the only known binary compound in the Au–Se system (Simon and Essene, Reference Simon and Essene1996; Xu et al., Reference Xu, Fan, Hu, Santosh, Yang, Lan and Wen2014), although it has not yet been identified as a discrete mineral, and the synthetic analogue of Au(Te,Se,S) is not known. Likewise, the compositions of these compounds were obtained by both EDS and WDS analyses. The AuSe includes up to 3.87 wt.% Te and 3.10 wt.% S, wherein Ag is present in trace amounts (Table 3). A wider range of Se–Te substitution exists in Au(Te,Se,S): concentration of Se varies from 5.58 to 13.86 wt.%. In the latter case the formula is Au(Se,Te,S). In these solid solutions we can also distinguish an unnamed phase Au3Te2Se (Table 3).
Au oxides
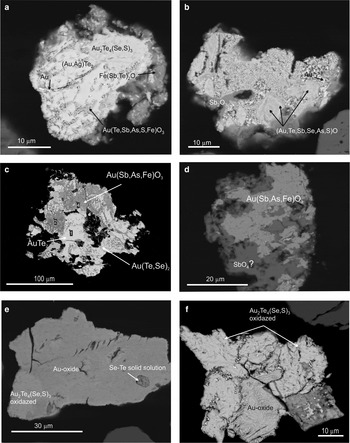
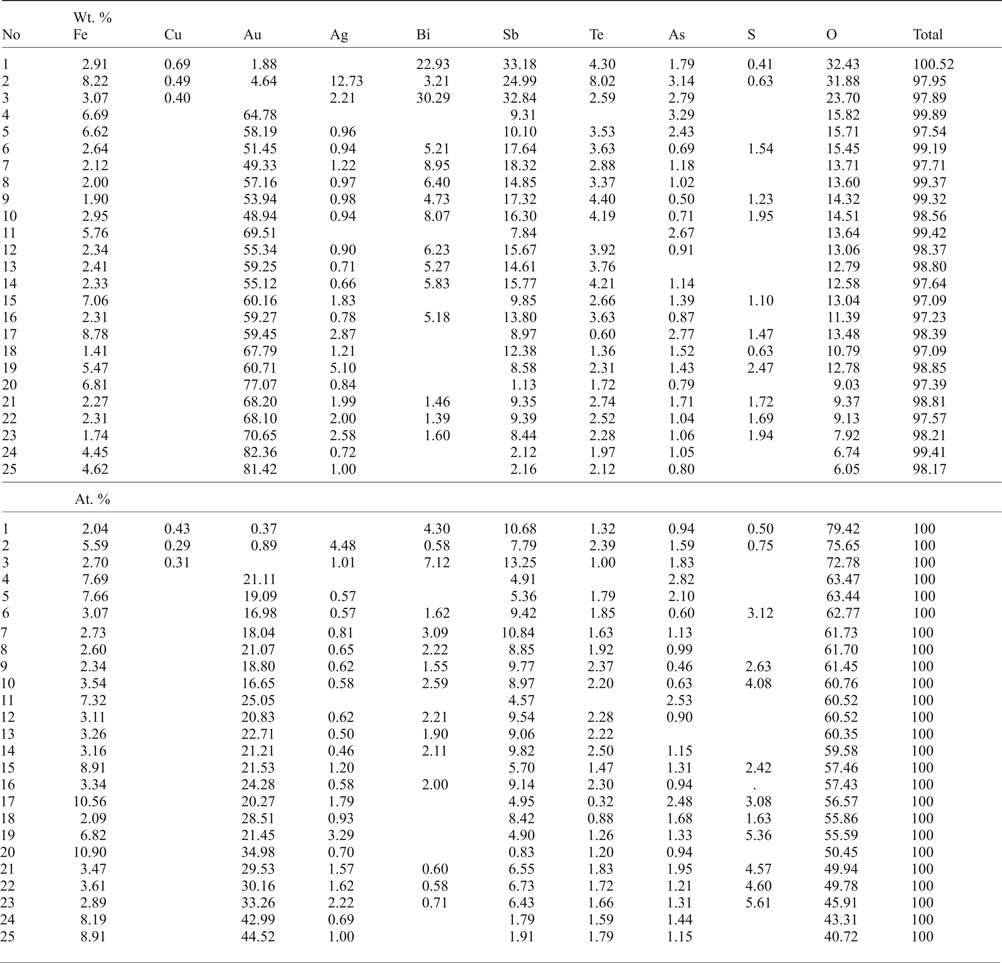
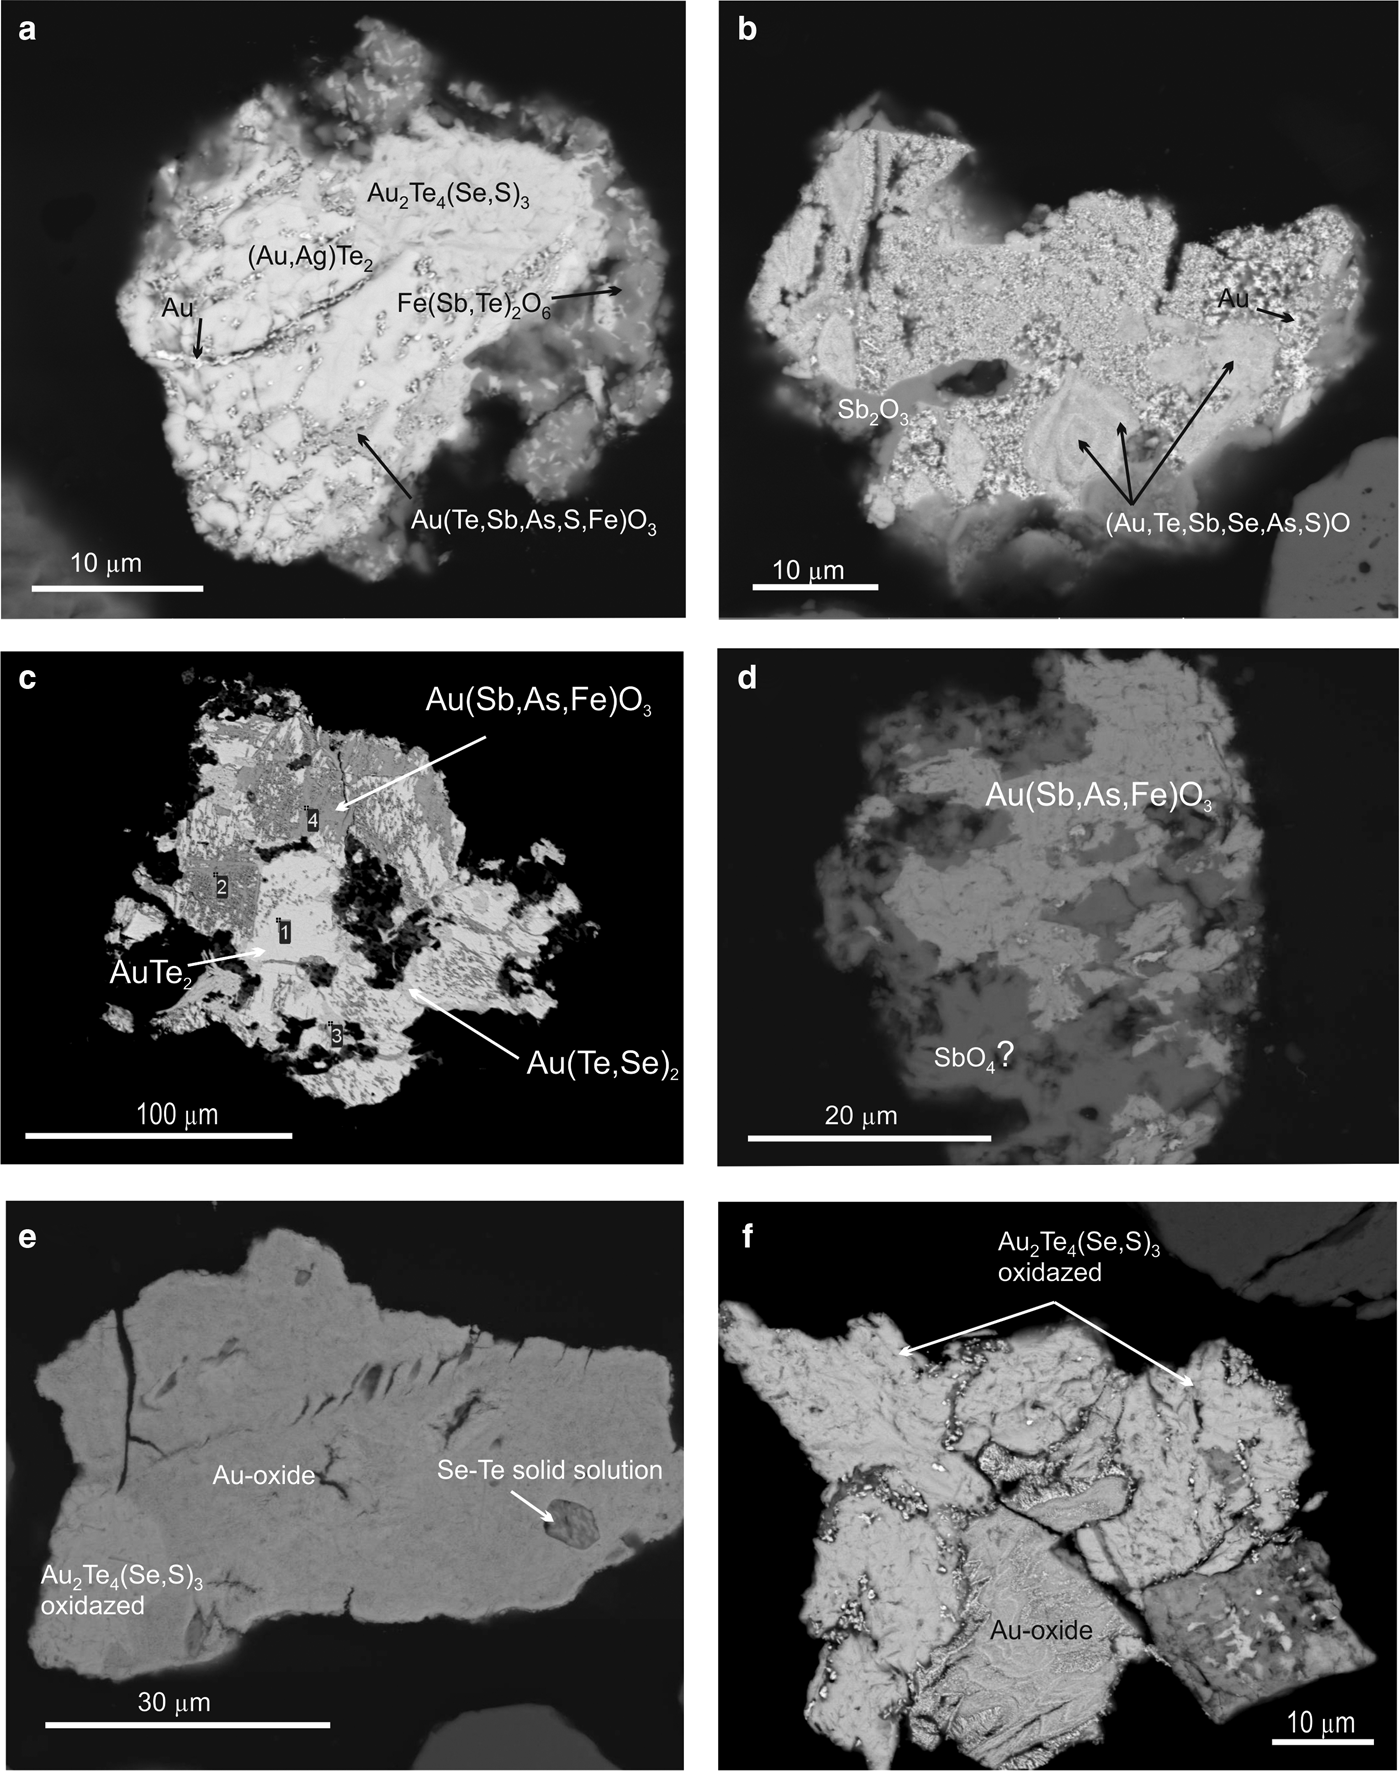
The majority of Au compounds occur in oxidized forms of complex composition (Au–Fe–Ag–Sb–As–Te–O) with variable element ratios (Table 5). They are characterized by replacement textures with relicts of primary minerals and occur as products of various stages of replacement of Au-minerals (calaverite, krennerite, etc.), vermicular intergrowths, rims along the primary minerals (Fig 8a,b,c,f) and complete pseudomorphs of them (Fig. 8d). Colloform aggregates of Au oxides are also common (Fig. 8e,f).
SEM images of minerals from the Gaching ore occurrence. (a) Replacement of krennerite and unnamed Au2(Te4(Se,S)3 by Au(Te,Sb,As,S)O3 with deposition of native gold particles; (b) zoned grains of Au oxide with complex composition (the lighter zones contain the more Au concentration) included in oxide-gold mixture with senarmontite (Sb2O3); (c) calaverite AuTe2, partly replaced by complex Au oxide; (d) unnamed Au2Te4(Se,S)3 partly replaced by Sb-oxide; (e) Au oxide with inclusions of Se–Te solid solution; (f) unnamed Au2Te4(Se,S)3 partly replaced by Au oxide.
Compositions (selective) of Au oxides from Gaching ore occurrence.
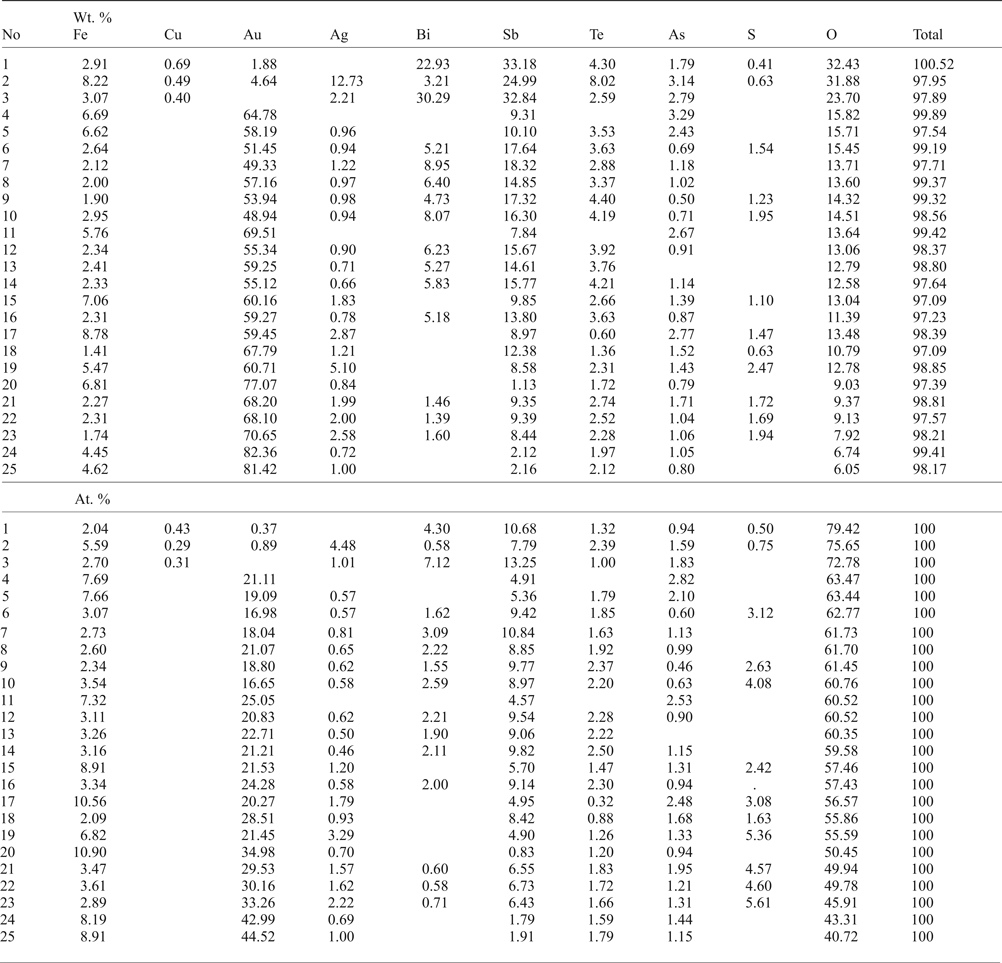
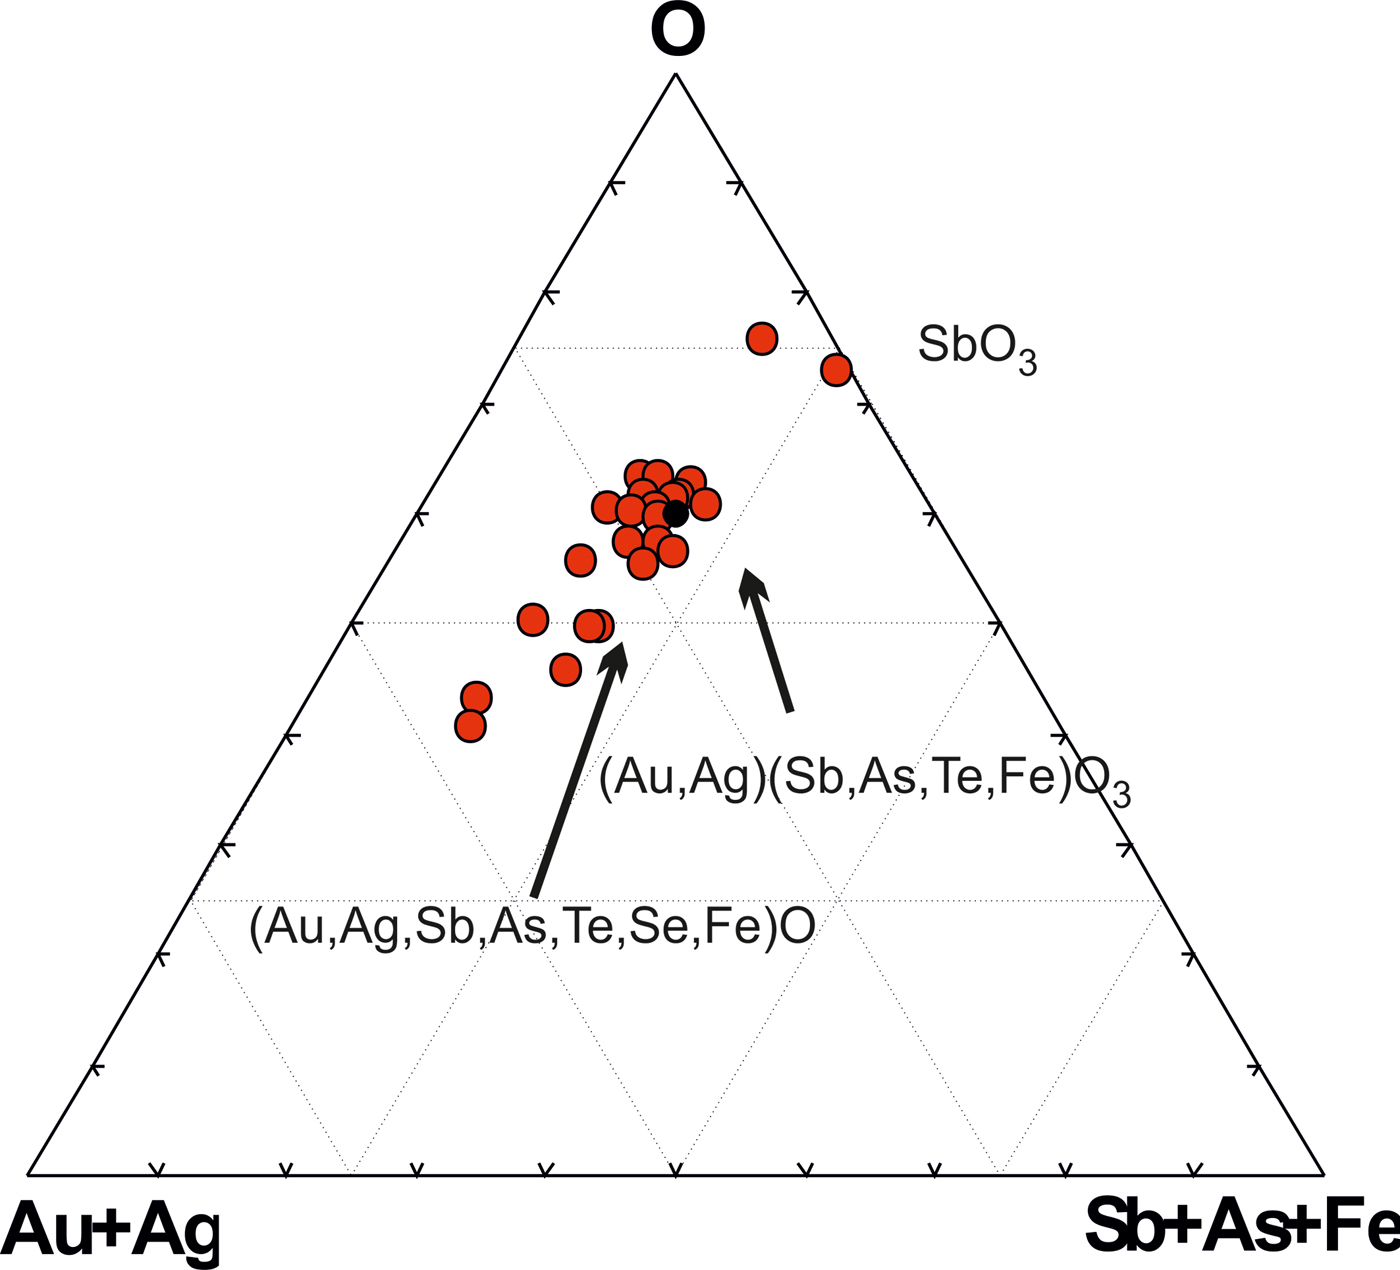
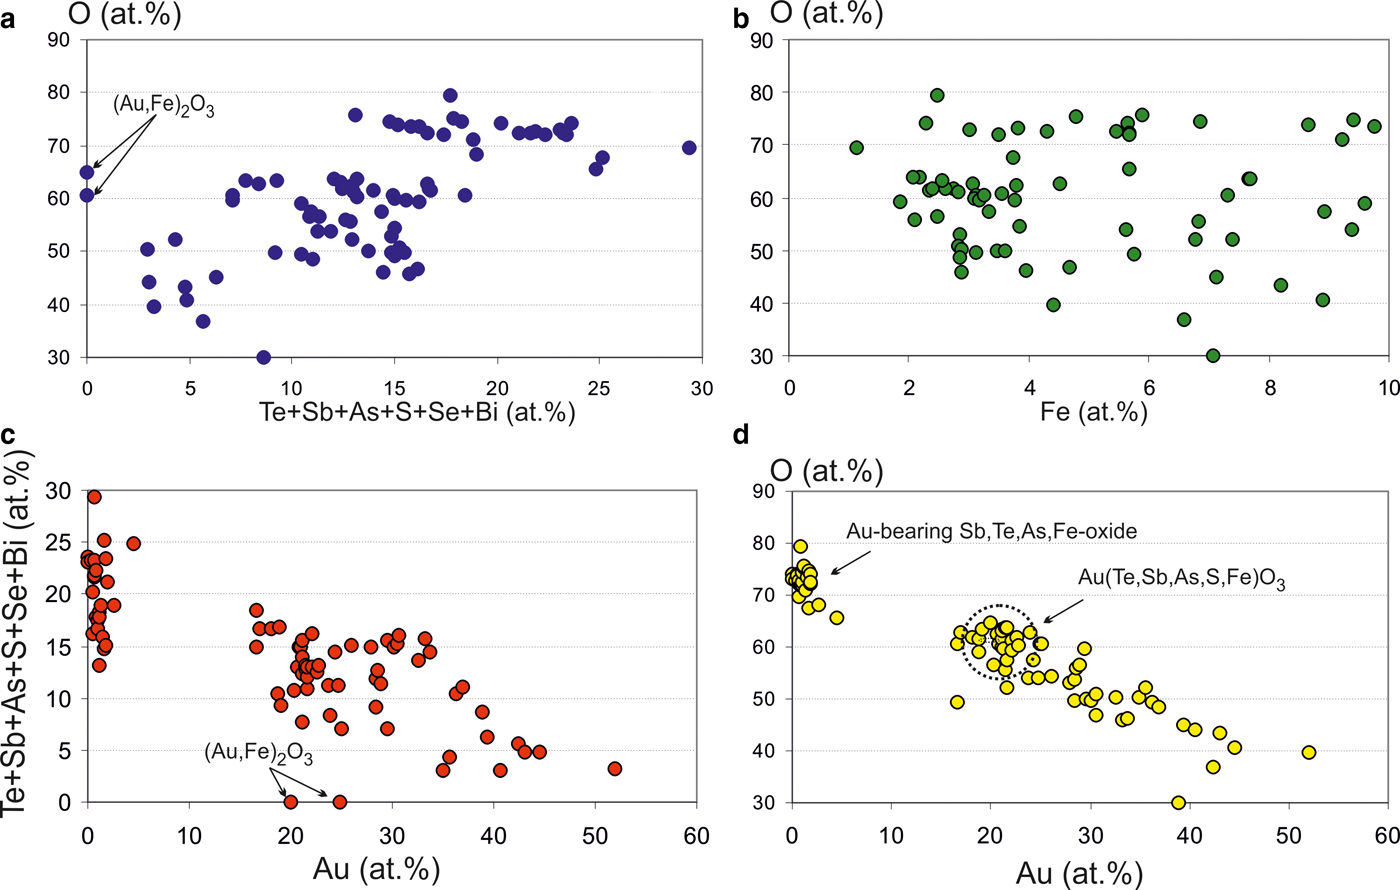
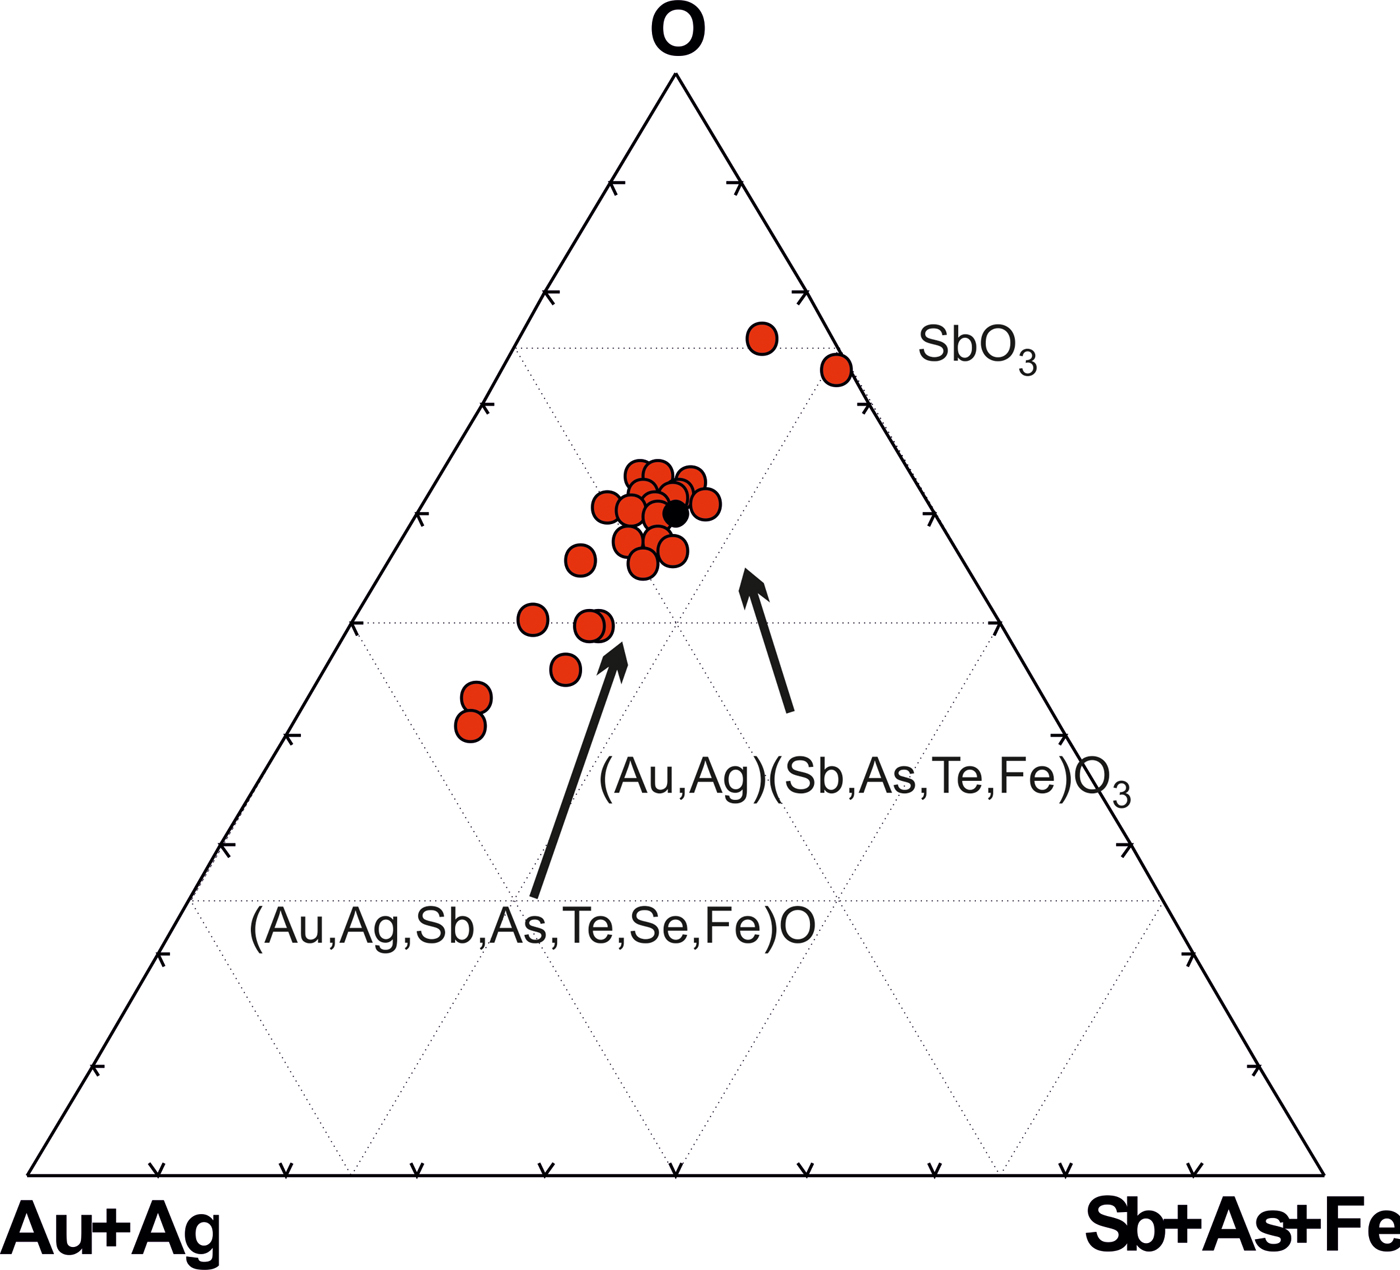
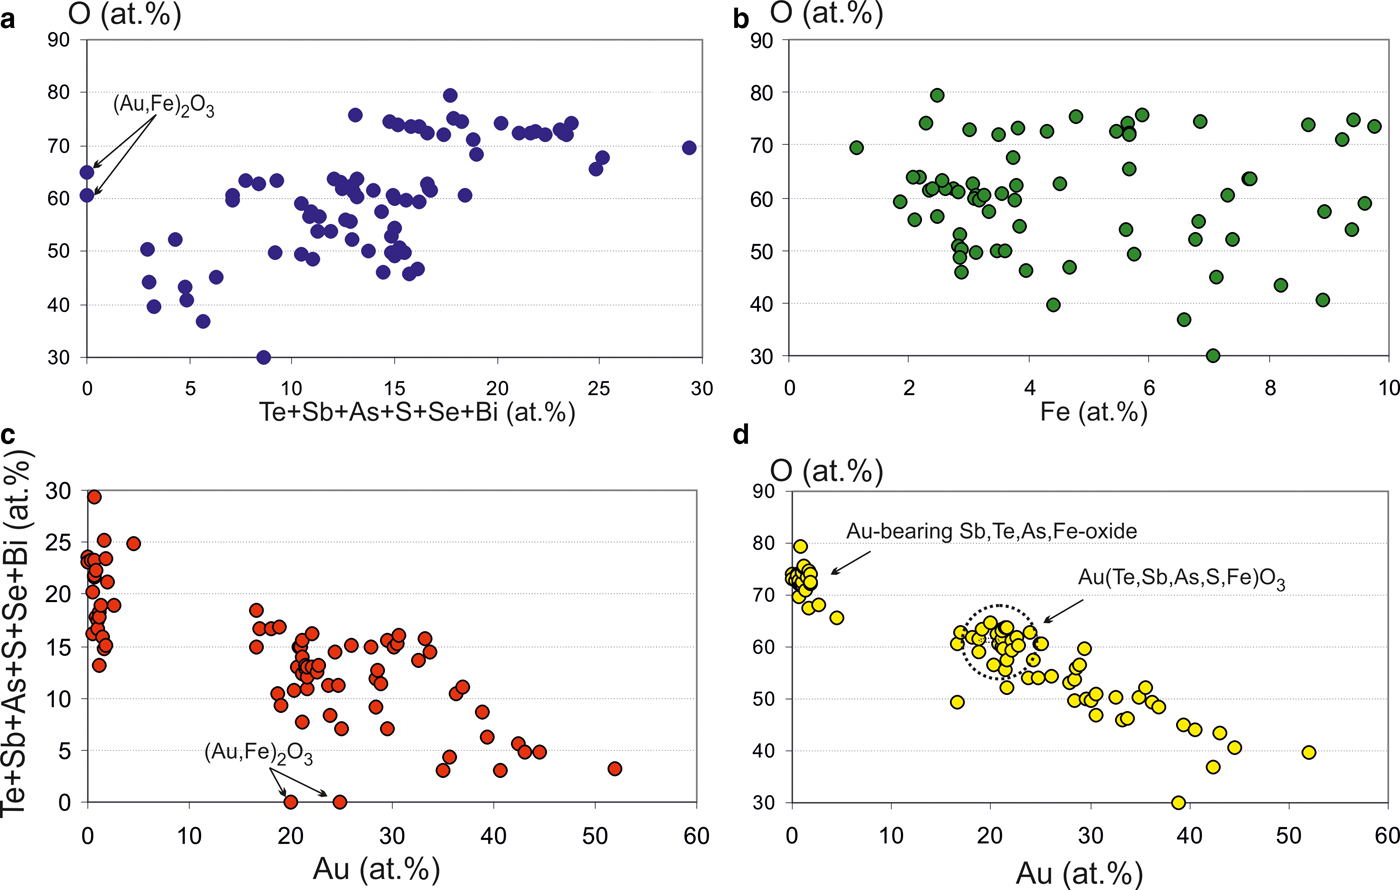
Some of the Au oxides are close to the stable formula Au(Sb,As,Te,Fe)O3, which refers to the new unnamed phase. Antimony predominates among the semimetals (SM) (Table 5). This phase has some variations in composition (Fig. 9) but in general the Au oxides form a trend of compounds directed to the Sb oxide (SbO3 or SbO4) which replace the Au oxides at the edge of grains as shown in Fig 8d. The ratios of elements in complex oxides show that oxidation is a continuous and long-duration process, because the oxidized phases form extended composition trends in the diagrams: the degree of oxidation positively correlates with the sum of the SM i.e. Te + Sb + As + S+Se + Bi (Fig. 10a), which are probably extracted from the dissolved sulfosalts and Au-tellurides. On the other hand, the concentration of Fe does not depend on the degree of oxidation (Fig. 10b). Contents of Fe correlate negatively with Au (Fig. 10c), due to substitution of Fe for Au in the structure of the complex oxides. The most significant negative correlation is shown for Au and oxygen (Fig. 10d), which indicates the sequential oxidation of Au-minerals during the hypergenic process. The most oxidized and conditionally stable phase is Au(Te,Sb,As,S,Fe)O3, which is the most often found in the association studied. These oxides include phase (Au,Fe)2O3 close to stable oxide (Au2O3) (Shi et al., Reference Shi, Asahi and Stampfl2007). The pores of the Au oxide grains are impregnated with iron hydroxides.
Trend of complex oxide compositions, showing the sequential replacement of Au-minerals.
Ratio of elements in complex Au oxides (at.%). (a) Te + Sb + As + S+Se + Bi vs. O; (b) Fe vs. O; (c) Au vs. Te + Sb + As + S+Se + Bi; and (d) Au vs. O.
Associated minerals
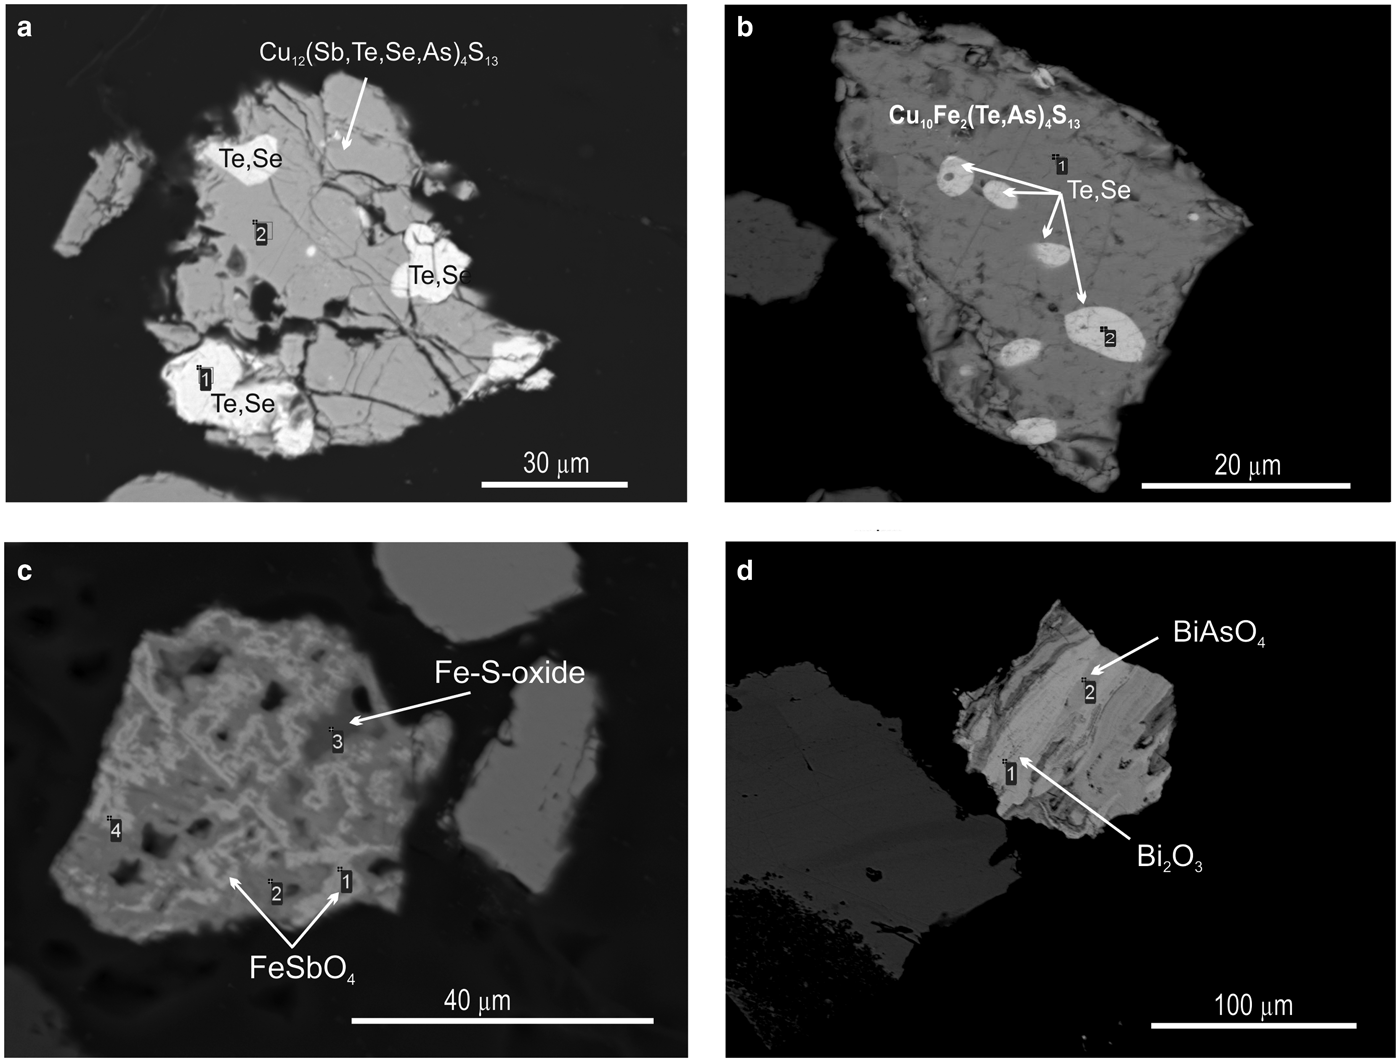
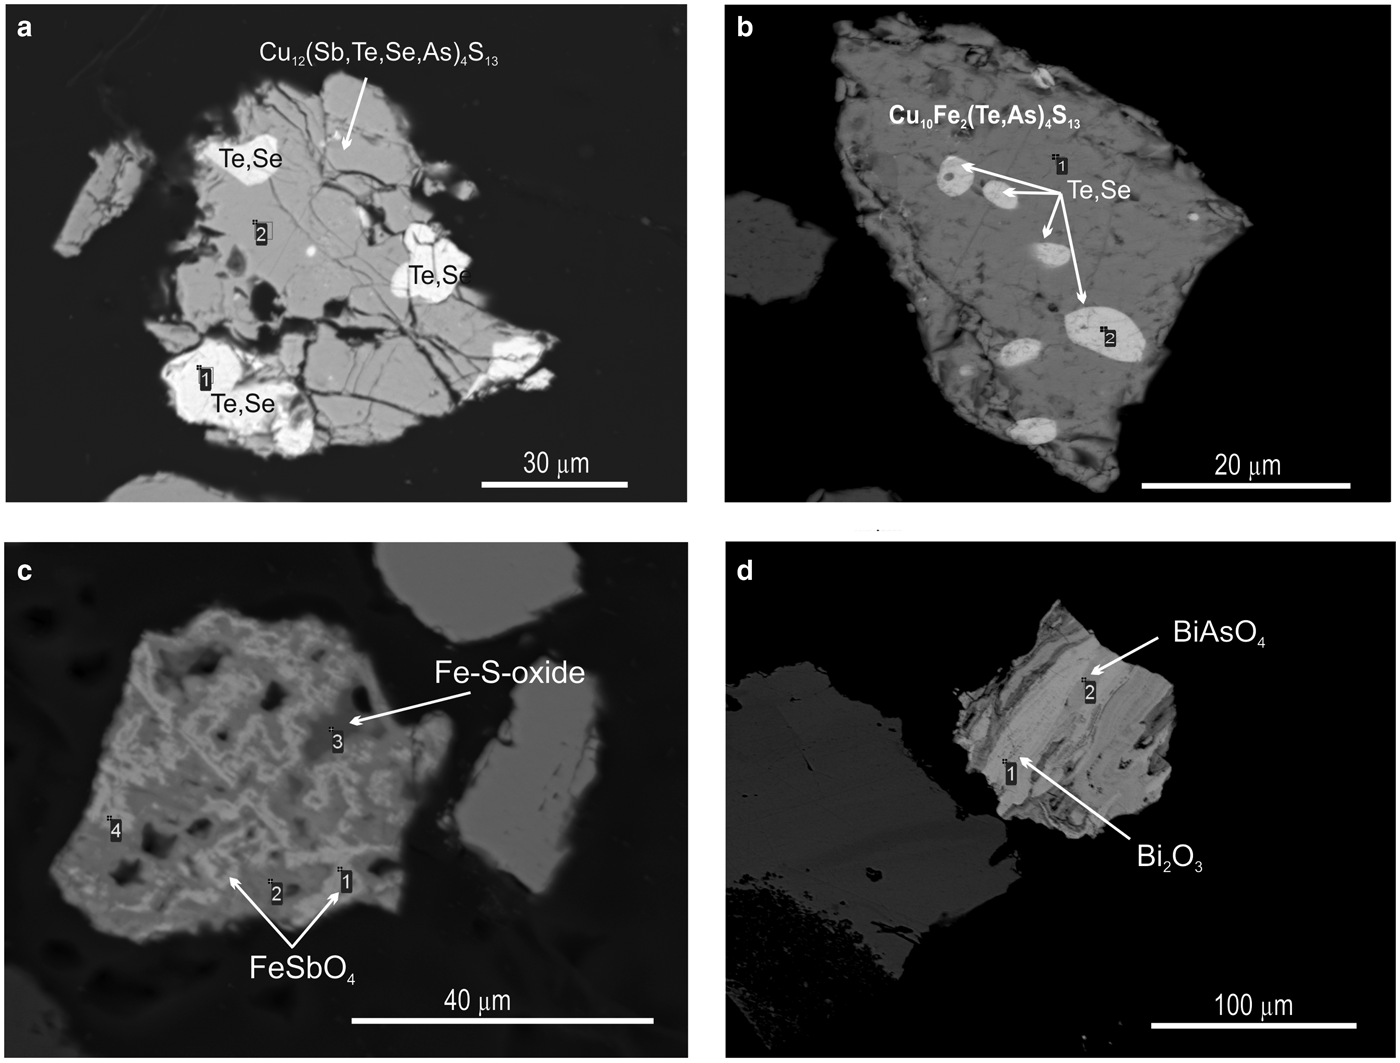
Pyrite is the most common mineral in all the samples studied and is characterized by an irregular distribution in quartzite. It may occur in the form of isolated single grains or as clustered disseminations (Fig. 3b). Intergrowths of pyrite with gold or Au- and Ag-bearing tellurides were not observed. However, Au-Ag-minerals were found in close association with sulfosalts: tetrahedrite (Cu10.61Zn0.13Fe0.15)11.96(Sb2.60As0.75Te0.63)3.98S12.82; tennantite (Cu9.89Fe0.07)9.96(As3.43Te0.49Sb0.22)4.14S13.90; enargite (luzonite) Cu2.96Ag0.02)2.98(As0.93Te0.10)1.03S3.99; goldfieldite Cu10.97(Te1.91As1.42Sb0.71)4.04(S11.13Se1.86)12.99; and watanabeite Cu4.07(Sb1.06Se1.83As0.34Bi0.05)2.28S4.64 as well as with other rare minerals such as bismite (Bi2O3), guanajuatite (Bi2Se3), rooseveltite (BiAsO4), tripuhyite (FeSbO4), native tellurium, Te–Se solid solutions and others (Table 1).
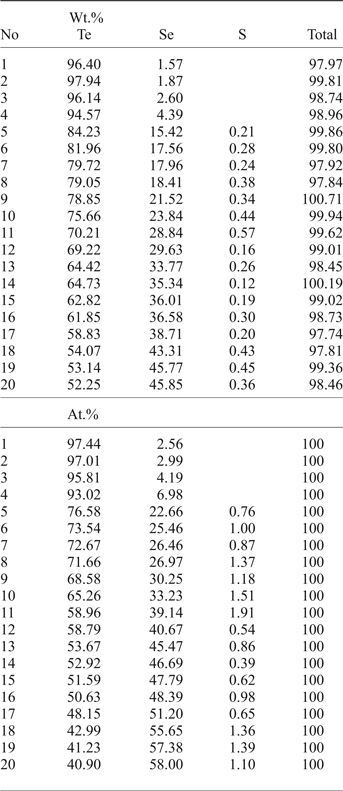
Native tellurium generally forms isometric or droplet inclusions in sulfosalts and Au oxides (Fig. 4e, 11a,b) or intergrowths with Au-minerals (Fig. 4e). The composition of Te–Se solid solution are in range Te0.97Se0.23–Te0.41(Se0.58S0.01)0.59 (Fig. 5b). The most Se-rich compound has the formula Se3Te2. Sulfur concentration covaries with selenium in these solid solutions (Table 6).
Compositions of Te–Se solid solutions from the Gaching ore occurrence.

The following equilibrium associations (intergrowths of 2- to 6-phase paragenesis) we observed: sulfosalts–Au–Au2Te4(Se,S)3; Au–Au2Te4(Se,S)3–HgSe; sulfosalts–(Te,Se)–Bi2Se3 or (Bi,Sb)2(S,Se)3; sulfosalts–(Bi,Sb)2(S,Se)3–Au2Te4(S,S)3–Cu3AsS4–(Bi,As)2O3–(Sb,Bi)2O3; Au2Te4(S,S)3–(Te,Se); Au2Te4(Se,S)3–FeSb2O6; Au–AuSe–Au(Te,Se); Au–FeSb2O6; AuTe2–sulfosalts; BiAs4–Bi2O3. All phases are repeated in various combinations, which allows them to be assigned to one ore stage and considered conditionally as equilibrium. Pyrite, baryte and anglesite were not found in intergrowths with Au minerals therefore we assume that they belong to another stage.
Discussion
High-sulfidation deposits commonly contain pyrite, Au telluride and copper minerals, especially the high-sulfidation state sulfosalts: enargite–luzonite and tennantite–tetrahedrite along with minerals formed under relatively acidic conditions, such as kaolinite, alunite, Sr- and Pb-sulfate (White and Hedenquist, Reference White and Hedenquist1995; Hedenquist and Arribas, Reference Hedenquist and Arribas2017). All these minerals are found in the Gaching occurrence (Table 1). Therefore we conclude that the Gaching occurrence belongs to the HS style of epithermal deposits.
Nevertheless, in addition to minerals typical of the HS style, numerous rare species or previously unreported minerals have also been detected in the association under study. These include Au-sulfoselenotellurides [Au2Te4Se3, Au2Te4S3 and their solid solutions, AuSe, Au(Te,Se), Se–Te solid solution in which Se > Te, Au–Fe–Ag–Sb–As–Te-oxide]. These minerals probably, crystallized under unusual conditions, not reached at the other HS epithermal deposits. The observed mineral parageneses can be used to reconstruct the conditions of their formation.
Stages of mineralization
Ore formation in epithermal HS type Au-Ag deposits associated with continental volcanism occurs under moderately acidic to acidic conditions (Arribas, Reference Arribas and Thompson1995). As a rule, several stages of mineralization have been recognized in the most HS deposits during changes in thermodynamic conditions (Chouinard et al., Reference Chouinard, Williams-Jones, Leonardson, Hodgson, Silva, Tellez, Vega and Rojas2005; Plotinskaya, Reference Plotinskaya, Kovalenker, Seltmann and Stanley2006; Kilias et al., Reference Kilias, Naden, Paktsevanoglou, Giampouras, Stavropoulou, Apeiranthiti, Mitsis, Koutles, Michael and Christidis2013 and others). We can identify three main stages in the Gaching ore occurrence.
At early stages of the metallogenesis, both  $f_{{\rm O}_{\rm 2}}$ and
 $f_{{\rm S}{\rm e}_{\rm 2}}$ were relatively low (with
 $f_{{\rm S}_{\rm 2}}$/
 $f_{{\rm S}{\rm e}_{\rm 2}}$>1), as a result of which pyrite was precipitated and selenium was incorporated into the sulfides (Liu et al., Reference Liu, Zheng and Liu2000, Reference Liu, Zhai, Wang and Liu2016). Pyrite of the Gaching ore occurrence was probably formed during an early stage of the ore-forming process distinct from the main Au-ore stage. Pyrite is included in quartzites and quartz-alunite rocks, but intergrowths of pyrite with gold or Au- and Ag-bearing tellurides are not observed at his stage.
During the following Au-rich stage, the  $f_{{\rm S}{\rm e}_{\rm 2}}$/
 $f_{{\rm S}_{\rm 2}}$ increased with
 $f_{{\rm O}_{\rm 2}}$ being relatively high (Liu et al., Reference Liu, Zhai, Wang and Liu2016). These conditions favour the formation of the precipitation of Au-selenides (Au-selenotellurides), especially when SO42– is prevailing, thus leading to the separation of selenium from sulfur and forming the association of selenides–native gold–quartz–baryte as in the Cambrian stratabound deposits of the Western Qinling Mountains in China (Liu et al., Reference Liu, Zheng and Liu2000) and in the La'erma and Qiongmo gold deposits (Liu et al., Reference Liu, Zhai, Wang and Liu2016). This stage in general is associated with tennantite–tetrahedrite sulfosalts, Ag-bearing selenides, such as fischesserite Ag3AuSe2, penzhinite (Ag,Cu)4Au(S,Se)4 and petrovskaite AuAg(S,Se), which are typical for the main Au stage in the other deposits (Liu et al., Reference Liu, Zheng and Liu2000) but are not typical in the Gaching occurrence. The Gaching mineralization is very high in Se content, however, the other mineral species of Se-bearing minerals are characteristic. In addition to tiemannite (HgSe), antimonsilite (Sb2Se3) and guanajuatite (Bi2Se3), the series of Te–Se solid solutions up to Se3Te2 composition and Se-rich krennerite are present (Table 1). An oxidized metallogenic environment prevailed during formation of the minerals because the high
 $f_{{\rm O}_{\rm 2}}$ would favour the formation of selenides (Simon and Essene, Reference Simon and Essene1996; Simon et al., Reference Simon, Kesler and Essene1997; Liu et al., Reference Liu, Zhai, Wang and Liu2016). In order for the paragenetic enrichment of Au and Se to occur, there has to be an abundant source of Au and Se as well as a relatively oxidizing environment. The occurrence of a variety of selenide and telluride minerals, and especially the common intergrowths of native gold suggest that Au, Te and Se have similar geochemical behaviour during hydrothermal mobilization and transport.
The oxygen fugacity ( $f_{{\rm O}_{\rm 2}}$) as well as the acidity (pH) have a great influence on the ratio Se2–/S2– (Dyacchkova and Khodakovskiy, Reference Dyacchkova and Khodakovskiy1968; Yamamoto, Reference Yamamoto1976). Therefore, in reducing Au-bearing solutions, gold is transported mainly in the form of H[Au(HS)2] (Arribas, Reference Arribas and Thompson1995; Liu et al., Reference Liu, Zheng and Liu2000). In a strongly oxidizing environment (high index of pH and
 $f_{{\rm O}_{\rm 2}}$) Au–S complexes may be replaced by Au–S–Se and even Au–Se complexes (Liu et al., Reference Liu, Zheng and Liu2000). These complexes will dissociate, and gold appears intergrown with selenide minerals, or may even form selenides of Au (Liu et al., Reference Liu, Zheng and Liu2000) that is observed in the assemblage within this study. The coexistence of native gold with selenide minerals [AuSe, Au2Te4(Se,S)3] and the fact that Se substitutes in solid solution into the structure of other minerals [Au(Te,Se)2; Te,Se] at Gaching indicates that gold is transported in the form of Au–Se(Te,S) complexes. The conditions at which S and Se are present in mutual solid solution define a wide range under high temperature, whereas separate Se minerals will be favoured at low temperatures (Liu et al., Reference Liu, Zheng and Liu2000).
The final stage indicates higher acidity of the fluids. Oxidation of previously deposited minerals occurs at this stage. Experiments on the kinetics of transformation of Au-rich tellurides show that oxidation of calaverite (AuTe2) takes place at 220°C and Au is redeposited as secondary high-grade gold (Zhao et al., Reference Zhao, Bruger, Pascal and Gundler2009), whereas Te and Se are precipitated in native form. Tellurium-selenium solid solution includes Se-rich species in the Gaching occurrence (Se3Te2) whereas native tellurium in Kairagach HS epithermal deposit contain up to 10.3 wt.% Se (Plotinskaya et al., Reference Plotinskaya, Kovalenker, Seltmann and Stanley2006). This process is convincingly shown on an SEM image, where particles of secondary gold are embedded in oxidized minerals (Fig. 8a,b,f), while tellurium is leached into solution and then deposited arbitrarily (Fig. 11a,b). This process is most probably responsible for the formation of the mustard gold that is widespread in the Gaching ores. The primary Au-Ag-tellurides (krennerite, calaverite) are first oxidized to form complex oxides (Fig. 8c). The oxides involve the addition of Fe, Sb, As and (or) S, which were probably remobilized by the hydrothermal fluids. The mustard gold appears as a porous and powdery brown and brick-red mass, although with some more metallic-like fragments (Nekrasov, Reference Nekrasov1991). It is composed of aggregates of microparticles, up to 1–5 µm in diameter and with lower reflectivity (Fig. 3d,f). Iron hydroxides may form precipitates in numerous pores of mustard gold in the supergene zone, thus causing the formation of mechanical impurities in what can be termed ‘Fe-bearing gold’ (Petersen et al., Reference Petersen, Makovicky, Juiling and Rose-Hansen1999; Zhao et al., Reference Zhao, Bruger, Pascal and Gundler2009).
SEM images of minerals from the Gaching ore occurrence. Tetrahedrite (a) and goldfieldite (b) with inclusions of Te–Se solid solutions; (c) tripuhyite FeSbO4 in intergrowths with Fe-S oxide; and (d) interlayering of bismite (Bi2O3) and rooseveltite BiAsO4.
The study showed that the mineral association at the Gaching occurrence differs from the other previously studied deposits of the Central Kamchatka volcanic belt, such as Aginskoye and Ozernovskoye (Kudaeva and Andreeva, Reference Kudaeva and Andreeva2014) although in these deposits a significant proportion of the precious metals are hosted in Au-Ag-tellurides that are associated with sulfosalts and native mustard gold (Kudaeva and Andreeva, Reference Kudaeva and Andreeva2014). The ores of Aginskoye deposit lack selenides; they were formed from neutral solutions (unlike Gaching) and at temperatures of 250–260°C (Okrugin et al., Reference Okrugin, Andreeva, Yablokova, Okrugina, Chubarov and Ananiev2014). The Gaching occurrence is most comparable with the Cambrian stratabound deposits of the Western Qinling Mountains in China, which are high in Se content and within which coexistence of native gold with tiemannite was found (Liu et al., Reference Liu, Zheng and Liu2000).
Physical and chemical conditions of formation of Au-mineralization
The abundance and diversity of Se-containing unnamed phases including Au-selenide is evidence of the unique physico-chemical conditions that were realized in the Gaching ore occurrence of Maletoyvayam ore field. The formation of selenide minerals (AuSe) is only possible in solution with extremely high  $f_{{\rm S}{\rm e}_{\rm 2}}$/
 $f_{{\rm S}_{\rm 2}}$ ratios so some transition metal may form selenide minerals. Oxidation-reduction conditions are important controls on the presence of selenide minerals as well as the relative values of
 $f_{{\rm S}{\rm e}_{\rm 2}}$,
 $f_{{\rm T}{\rm e}_{\rm 2}}$ and
 $f_{{\rm S}_{\rm 2}}\!.$ Reducing conditions will not lead to an increase in selenium activity and Se/S ratios to form selenide minerals (Yuningsih et al., Reference Yuningsih, Matsueda and Rosana2016). Twenty two kinds of complexes of Au with oxygen, sulfur and tellurium are known in the oxygen–sulfur–selenium–tellurium group system, but the complexing of Au with Se has not been previously reported (Liu et al., Reference Liu, Zheng and Liu2000). The Au(Se,S) and Au(Te,Se,S) association of the Gaching assemblage always appear as fragments of grains of native gold (Fig. 4a–c), which is definitely due to the solely oxidizing environment.
Of the noble metals, gold is the most resistant to oxidation in air or molecular oxygen and its oxidation in nature is not well described. But gold oxide Au2O3 can be synthesized under hydrothermal conditions with pressures of several hundred MPa (Weiher et al., Reference Weiher, Willneff, Figulla-Kroschel, Jansen and Schroeder2003) and Au2O also has been observed according to the PubChem Compound Database [https://pubchem.ncbi.nlm.nih.gov/compound/1959144]. The oxide Au2O3 is more stable than Au2O. It is a thermally unstable solid that decomposes at 160°C (Greenwood and Earnshaw, Reference Greenwood and Earnshaw1997). However in this gold occurrence the Au oxides present in the assemblage owe their origin to the oxidation of the primary Au-tellurides but not gold. This requires a highly oxidized environment which was probably the case at the Gaching occurrence.
Assuming that the critical mineral assemblages formed at equilibrium, the conditions of  $f_{{\rm O}_{\rm 2}}$,
 $f_{{\rm S}_{\rm 2}}$,
 $f_{{\rm S}{\rm e}_{\rm 2}}$ and
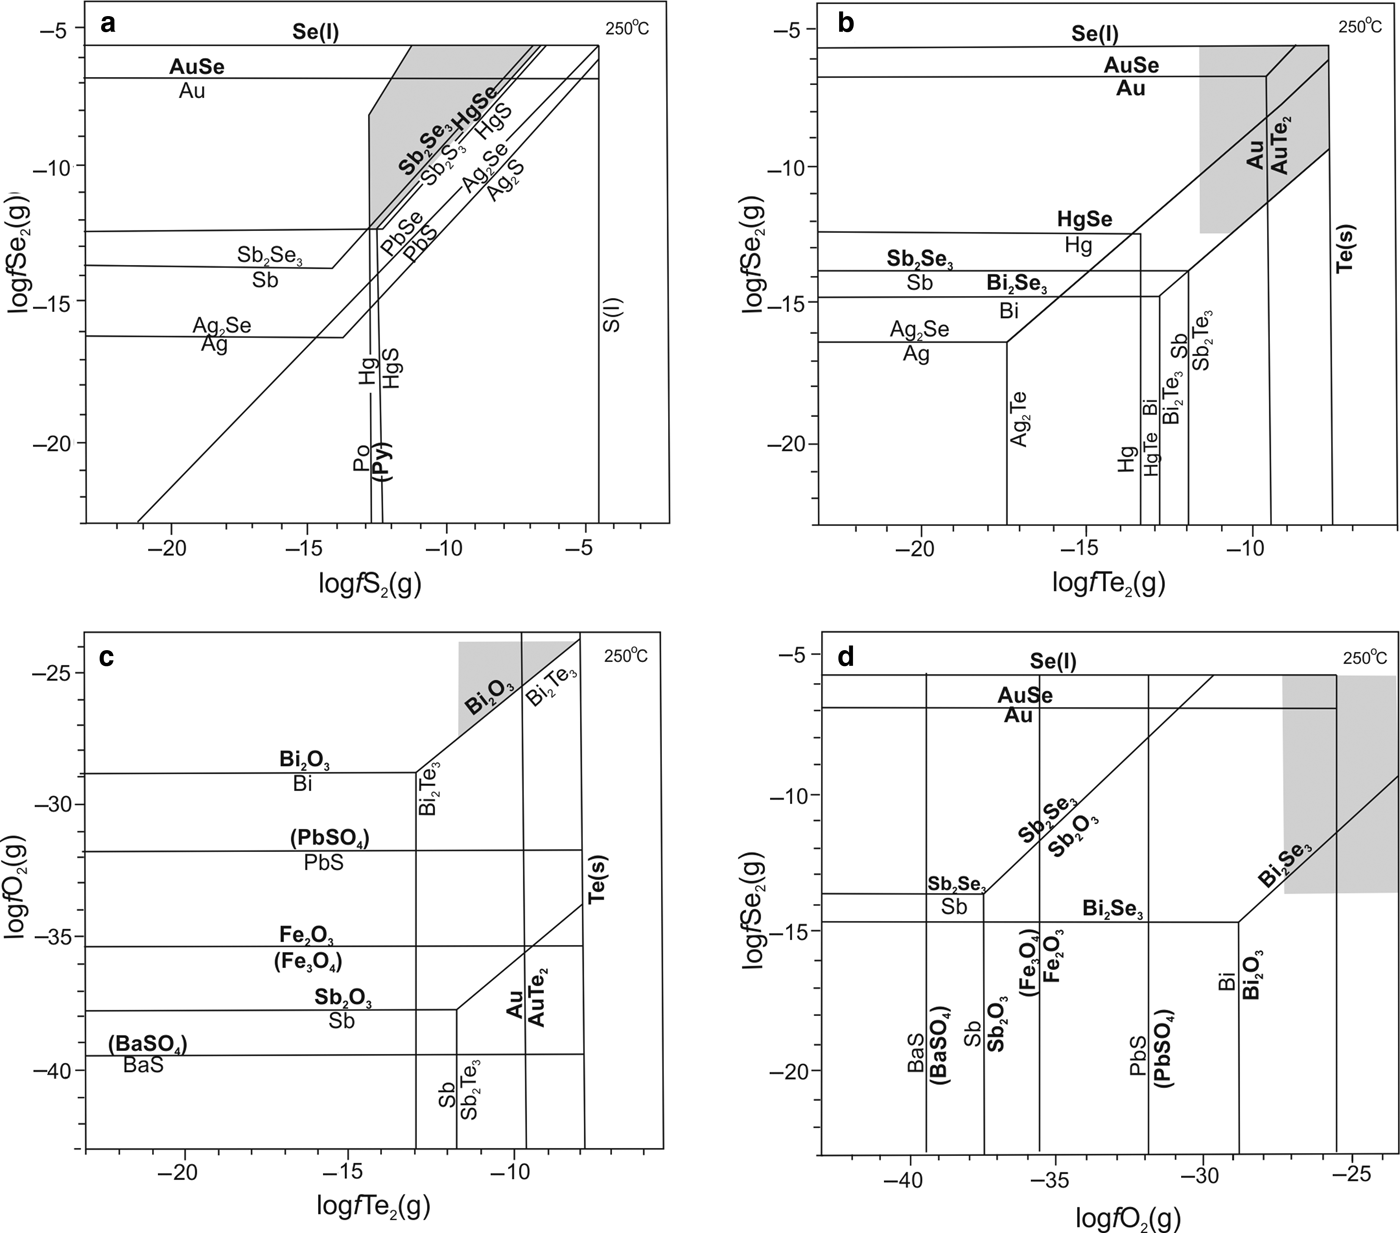
 $f_{{\rm T}{\rm e}_{\rm 2}}$ of formation of these assemblages can be estimated. For minerals that were not in contact (i.e. were from stages interpreted to be different in the same sample), the estimated conditions are listed in brackets in Fig. 12. Generally epithermal deposits form at temperatures around 170–260°C (Yuningsih et al., Reference Yuningsih, Matsueda and Fukuchi2013), therefore in interpreting conditions of formation of the Gaching mineral assemblage phase diagrams can provide limits on fugacities of S2, Te2, Se2 and O2 at 250°C (Fig. 12).
Diagrams showing the relative stability (shaded areas) of minerals of Au-paragenesis under study at 250°C in coordinates. (a) log $f_{{\rm S}{\rm e}_{\rm 2}}$–log
 $f_{{\rm S}_{\rm 2}}$; (b) log
 $f_{{\rm S}{\rm e}_{\rm 2}}$–log
 $f_{{\rm T}{\rm e}_{\rm 2}}$; (c) log
 $f_{{\rm O}_{\rm 2}}$–log
 $f_{{\rm T}{\rm e}_{\rm 2}}$; (d) log
 $f_{{\rm S}{\rm e}_{\rm 2}}$(g)–log
 $f_{{\rm O}_{\rm 2}}$. Diagrams (with simplification) taken from (Xu et al., Reference Xu, Fan, Hu, Santosh, Yang, Lan and Wen2014) on the basis of data therein. Bold indicates the phases for which the stability fields of the association were limited.

Sulfur fugacity
Sulfides in the Gaching Au-Ag ores include pyrite, tennantite, famatinite, enargite, watanaberite, goldfieldite and tetrahedrite. The phase diagrams (Fig. 12) show that pyrite is stable at log $f_{{\rm S}_{\rm 2}}$ higher than –12.8 (Fig. 12a) because there is no pyrrhotite in the ores. Early-stage pyrite was probably formed under these conditions. However goldfieldite Cu12(Te,As,Sb)4S13 of the Au-stage present in these ores is an indicator of high sulfur fugacity (Spiridonov et al., Reference Spiridonov, Filimonov, Kulikova, Naz'mova, Krivitskaya, Bryzgalov, Guseva and Korotaeva2008). The stability field of tiemannite (HgSe) at the maximum log
 $f_{{\rm S}{\rm e}_{\rm 2}}$ determines the upper limit of log
 $f_{{\rm S}_{\rm 2}}$ in this association, which is –6.6 (Fig. 12a). Gold and AuSe are stable together under these conditions. Furthermore, the limit of log
 $f_{{\rm S}_{\rm 2}}$ for Fe-tetrahedrite (similar to this study) but at 300°C was determined by Seal et al. (Reference Seal, Essene and Kelly1990) to be –2.
Selenium fugacity
Because Se is extremely high in the Gaching Au-Ag ores (based on the presence of unnamed phase AuSe and Se,Te solid solution) it is reasonable to assume a high limit of log $f_{{\rm S}{\rm e}_{\rm 2}}$ at Se(l)–AuSe binary, equal to –5.7 at 250°C (Fig. 12a,b,d). As the minerals guanajuatite Bi2Se3 and antimonselite Sb2Se3 are present in the ores, the lower limit is determined by the stability field of the latter (Fig. 12b,d). Because of the absence of Ag2Se and native Hg in the ores, the log
 $f_{{\rm S}{\rm e}_{\rm 2}}$ for HgSe must be higher than –12.4. The presence of AuSe and Se–Te solid solutions with a predominance of selenium determine the upper log
 $f_{{\rm S}{\rm e}_{\rm 2}}$ limit of the investigated parageneses of the ore stage. Thus, we obtain a range in log
 $f_{{\rm S}{\rm e}_{\rm 2}}$ for the Gaching Au-Ag ores between –12.4 and –5.7.
Tellurium fugacity
Tellurides in the Gaching Au-Ag ores include calaverite, Au-selenotelluride and native tellurium (Te–Se solid solution). The presence of tellurium indicates that the upper limit of log $f_{{\rm T}{\rm e}_{\rm 2}}$ is –7.8, defined by the phase equilibrium of AuTe2–Te(s) binary (Fig. 12b,c). The lower limit of log
 $f_{{\rm T}{\rm e}_{\rm 2}}$ is supported by the Au–Au2Te binary only. Because of the absence of Sb2Te3 and the abundance of native gold in the ores, the upper limit of the log
 $f_{{\rm T}{\rm e}_{\rm 2}}$ is not exactly fixed, but as it must be between –12.0 and –9.5 then an intermediate value ≈10.5 is taken conditionally (Fig. 12b,c). In this fugacity range, the presence of telluride minerals, including calaverite and gold, is also consistent with the fact that these minerals are widely distributed in ores.
Oxygen fugacity
Baryte, anglesite, magnetite, hematite and bismite are the metallic oxides in the Gaching ores and can be used to determine limits on oxygen fugacity. But the first two minerals belong to the pre-ore stage. Thus the lower limit of log $f_{{\rm O}_{\rm 2}}$ is estimated to be −28.9 at 250°C, the equilibrium oxygen fugacity for Bi–Bi2O3 as native bismuth and galena are absent in the ore (Fig. 12c,d). However taking into considering the lower limit of log
 $f_{{\rm T}{\rm e}_{\rm 2}}$, this boundary shifts up to –27.3. The higher limit is possibly up to atmospheric oxygen, although this condition is not attained during telluride and selenide deposition (Xu et al., Reference Xu, Fan, Hu, Santosh, Yang, Lan and Wen2014). Copper-enriched sulfosalts (goldfieldite), which is characteristic of the mineral association under study, also indicate high oxygen fugacity in the system (Spiridonov et al., Reference Spiridonov, Filimonov, Kulikova, Naz'mova, Krivitskaya, Bryzgalov, Guseva and Korotaeva2008).
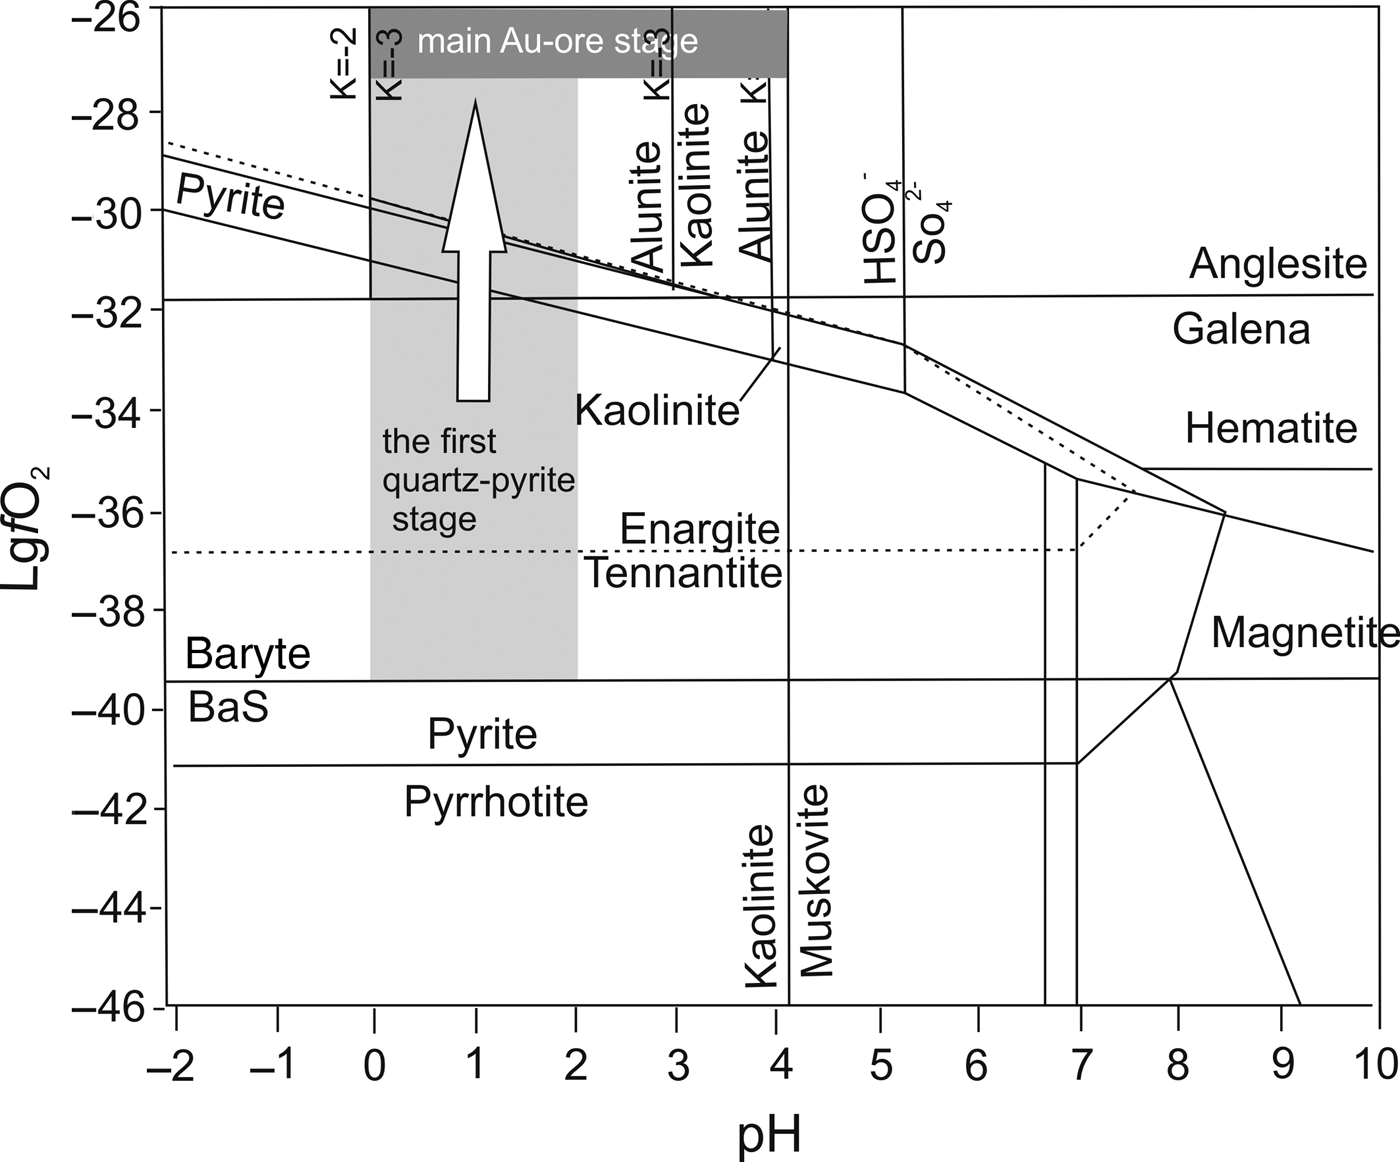
The diagram of acidity (pH) and oxygen fugacity ( $f_{{\rm O}_{\rm 2}}$) given for the Pascua HS deposit (Chouinard et al., Reference Chouinard, Williams-Jones, Leonardson, Hodgson, Silva, Tellez, Vega and Rojas2005) was used to estimate the stability fields of Gaching minerals (Fig. 13). It can be assumed that pH range for the Gaching is 0–4 based on the presence of alunite, kaolinite, anglesite and pyrite in the ore-bearing rocks. However Pascua HS deposits (Au–Ag–Cu–As style) were formed by acidic condensates of magmatic vapour (pH ≈ 1) (Hedenquist and Arribas, Reference Hedenquist and Arribas2017). In the range pH = 0–1 the
 $f_{{\rm O}_{\rm 2}}$ conditions were above those of anglesite stability (log
 $f_{{\rm O}_{\rm 2}}$ is more then –31.9) and up to –29.8 when pyrite becomes unstable at 250°C. Probably, these conditions corresponded to the early pyrite-containing stage of the Gaching occurrence. A further increase in log
 $f_{{\rm O}_{\rm 2}}$ to –27.3 and higher (see Fig. 12c,d) led to an increase of ratio Se2–/S2– (Dyacchkova and Khodakovskiy, Reference Dyacchkova and Khodakovskiy1968; Yamamoto, Reference Yamamoto1976) and the formation of Au mineral-parageneses belonging to the main ore stage. Pyrite is not stable under these conditions (Fig. 13) therefore its intergrowths with Au minerals were not detected.
Log $f_{{\rm O}_{\rm 2}}$–pH diagram at 250°C and saturated vapour pressure from Chouinard et al. (Reference Chouinard, Williams-Jones, Leonardson, Hodgson, Silva, Tellez, Vega and Rojas2005), showing the stability fields of the principal alteration and ore minerals in the Gaching ore occurrence. The shaded area is shown on the base of gangue and associated minerals (alunite, baryte, kaolinite, anglesite, enargite). The arrow indicates the evolution of the ore-forming system.

Conclusions
As the results showed, the Gaching ore occurrence of the Maletoyvayam ore field belongs to the high-sulfide type of epithermal deposits, but among the deposits of this type, it is distinguished by an increased role of selenium in the ore-forming system, and the consequent presence of Se minerals. Only some HS deposits include selenides (Arribas, Reference Arribas and Thompson1995). The mode of occurrence of Se in Gaching differs from those of other Se-rich gold deposits such as the Cambrian stratabound deposits of the Western Qinling Mountains in China (Liu et al., Reference Liu, Zheng and Liu2000); or Kochbulak and Kairagach, Uzbekistan (Plotinskaya et al., Reference Plotinskaya, Kovalenker, Seltmann and Stanley2006). In addition to known Se-containing minerals krennerite, tiemannite, guanajuatite and Se-containing tellurium the Gaching ores contain the unique unnamed phases Au2Te4(Se,S)3, Au(Te,Se), Au(Se,S), Se3Te2, that have never been found before. This assumes an environment for their formation not realized in other similar deposits. So the following two prerequisites were satisfied for the paragenetic enrichment of Au and Se: an abundant source of Au and Se and a strongly oxidizing environment, as selenides are only formed in these conditions.
Stage 1: Baryte, anglesite and pyrite are among the earlier main minerals of the Gaching metallogenesis, because the  $f_{{\rm O}_{\rm 2}}$ and
 $f_{{\rm S}{\rm e}_{\rm 2}}$ were relatively low, and
 $f_{{\rm S}_{\rm 2}}$ was relatively sufficient to pyrite to precipitate. Acidic conditions are implied by the stability of the host and gangue minerals (pH= 0–2).
Stage 2: Au and minor Ag during the main gold-rich ore stage are concentrated in two forms, as Au(Ag)-tellurides (selenotellurides) and Au–Ag alloys with low Ag content (1–3 wt.%) which relate to the primary mineralization deposited from the hydrothermal solutions. This stage is accompanied by an increase in the  $f_{{\rm S}{\rm e}_{\rm 2}}$/
 $f_{{\rm S}_{\rm 2}}$ ratio with increasing of
 $f_{{\rm O}_{\rm 2}}$ up to values of log
 $f_{{\rm S}{\rm e}_{\rm 2}}$ = –5.7 at which point the formation of unique compounds [Au2Te4(Se,S)3; Se3Te2 and AuSe] became possible.
The gold, tellurides and selenides of the Gaching Au(Ag) ores can be stable at 250°C when log $f_{{\rm O}_{\rm 2}}$(g) is more than –27.3; log
 $f_{{\rm S}{\rm e}_{\rm 2}}$(g) ranges between –12.4 and –5.7; log
 $f_{{\rm T}{\rm e}_{\rm 2}}$(g) ranges between –10.5 and –7.8; and log
 $f_{{\rm S}_{\rm 2}}$(g) has a range between –12.8 and –6.8.
Stage 3: The further evolution of mineral parageneses occurred under conditions of a significant increase of  $f_{{\rm O}_{\rm 2}}$ up to the stability limit of Au oxide the formation of which is possible only through the oxidation of Au-tellurides and native gold. The extended trend of variable compositions of complex Au oxides [(Au,Ag)–(Sb,As,Te,S)–O] shows that this process was prolonged. The newly formed high-grade mustard gold and native tellurium (or Te–Se solid solution) were the results of this process.
Acknowledgements
This article is dedicated to the memory of the late Professor Hazel M. Prichard, in recognition of her contributions to PGE and Au mineralogy and Exploration Geology. The authors are grateful to E. A. Petrova (Scientific-Production Company Elehim, Novosibirsk), N. Stenin (Interminerals Limited Liability Company, Moscow) for supplying samples from the Gaching deposit. We also thank the analysts who provided the analysis of minerals: V. Korolyuk (WDS) and Dr. N. Karmanov, M. Khlestov and V. Danilovskaya (EDS). We are grateful to John Milan Hora for correcting the English. Comments by Associate Editor Stephen Barnes, Principal Editor B. O'Driscoll, and reviewers M. Pearce and D. Holwell are greatly appreciated and helped to improve this paper. The research was carried out in IGM SB RAS and were supported by the project No 0330-2016-0003. This research was supported by the Grant Agency of the Czech Republic (project No. 18-15390S) and through an internal project 331400 from the Czech Geological Survey.