I. INTRODUCTION
In general, the development and implementation of new materials rely on proper knowledge of the response to external loading. As more advanced materials are developed the response to loading can begin to diverge from simple, accepted evaluation methods. One such situation is the case of thin film materials. The deposition of thin films has been used in a wide range of applications in the electronics, tribology, nuclear, and the biomedical fields, just to name a few.Reference Jung, Lawn, Martyniuk, Huang and Hu1 One concern with the development of thin films is the characterization of the mechanical properties of the films, this characterization is notoriously difficult as the thickness of the films prevents the use of traditional freestanding testing methodologies. One method that has been successful in characterizing hard and brittle thin film materials has been use of the nanoindentation approach.Reference Beegan, Chowdhury and Laugier2 With depth sensing indentation machines, load and displacement are measured, however, an area of residual impression is necessary for the analysis of modulus and hardness. For micrometer and larger scale indentation depths, ideal tip geometry can be assumed and an area function can be generated from simple geometric relationships. For thin films, indentation depths are required to be on the order of the nanometer and in this case, the ideal area function breaks down and greatly underestimates the residual area. To add to the complexity, the residual impression cannot be imaged or measured optically at this scale, necessitating the use of much costlier electron microscopy techniques. One method to determine residual area, developed by Oliver and Pharr,Reference Oliver and Pharr3 involves creating a series of indents of varying depths on a standard sample of known elastic modulus, typically fused quartz. From the data, a function can be generated to describe the contact area in terms of contact depth. This method has proven reliable for samples that exhibit high hardness with little plastic deformation; however, it greatly underestimates the contact area in samples that exhibit pile-up, leading to errors in the calculated hardness and modulus.Reference Saha and Nix4
For thin films that plastically deform and exhibit significant material pile-up during the indentation process, indentation hardness becomes difficult to measure as the contact area is both tip and material specific. This is especially true in the case of nanoindentation, where in the pile-up, height can be on the order of indentation depth. Multiple previous efforts have been used to address this problem, and can be characterized as either (i) modifications to the tip area function to account for increased contact area,Reference Bolshakov and Pharr5 (ii) ex situ analysis of contact area using additional analytical tools (SEM, AFM, etc.)Reference Fischer-Cripps6 or (iii) complex computational modeling.Reference Põdra and Andersson7 In each case, significant post-test analysis is needed to determine the mechanical properties. This article presents a simplified model based on the Winkler bed of springs in which plastic deformation is accounted for through the radial distribution of displaced volume. Using this modified Winkler approach, the indentation hardness and modulus of an example thin film were calculated using a simple MATLAB® script, using the tip area function and an estimation of film thickness. This process eliminates the need for the use of additional expensive analytical techniques or complex computational analysis to determine the area of contact and thus mechanical properties of thin films that exhibit significant plastic deformation and material pile-up.
As a proof of concept, the model was used to characterize gold thin films deposited using two different techniques, ranging in thickness between 100–500 nm, on Si substrates over a range of indentation depths. Results were compared with traditional nanoindentation analysis techniques, both the Oliver and Pharr and Stone methods and validated against hardness estimations using the Hall–Petch relationship.
II. METHODS
A. Film synthesis and characterization
Gold thin films were chosen as the material for the study for its wide range of applications in micro-electro-mechanical systems (MEMS) devices and tribological applications.Reference Jang and Kim8 An experimental matrix was designed to test various microstructures, film thicknesses, and depths of indentation of gold films on silicon substrates. The variety in microstructure and sample thickness was achieved using two deposition techniques; ion beam sputtering (IBS) and electron beam evaporation (EBE). Details on the deposition techniques can be found in previous literature.Reference Bourne9 The surface roughness of the prepared films was measured using an optical profilometer, results showed less than 2 nm roughness for all films.
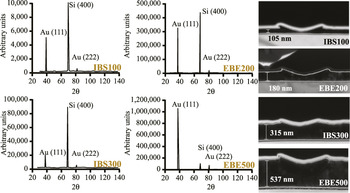
X-ray diffraction (XRD) was used to determine the grain size and the residual strain measurement of each film. A Philips APD 3270 diffractometer (Amsterdam, Netherlands) with a Cu Kα x-ray source was used to scan from 30° to 135° 2θ with a step size of 0.02°. Figure 1 shows 2θ scans for the four different gold coatings used in the test matrix. All four show a strong (111) texture with no other significant orientations. Often, during processing, a certain crystallographic orientation develops due to processing conditions. These variations may be due to mechanical processing, thermal gradients upon solidification, or preferred growth orientation. For thin films, the latter is often the case. Since most single crystals exhibit anisotropic mechanical properties, polycrystalline samples with a preferred orientation will also exhibit similar anisotropy.
XRD results for scans performed on each of the four Au films. All four scans show strong (111) texture. In addition FIB cross-sections of each film after indentation are shown with corresponding film thickness measurements.

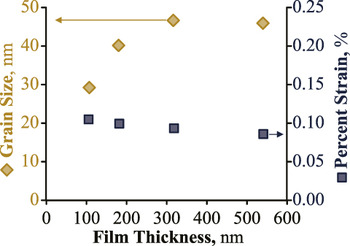
In addition, the diffractometer was set to scan ±2.5° at 38.2° 2θ and ±2.5° at 81.7° 2θ which correspond to the {111} and {222} peaks, respectively with a step size set at 0.05° for increased resolution. The data were entered in the Philips Line Profile software along with scans from standard samples with similar d-spacing, and the Warren–Averbach grain size and strain analysis was performed. Figure 2 shows the results of the film grain size and strain with respect to the film thickness. The grain size is increasing with film thickness up to 45 nm grains in films over 300 nm thick. All films show approximately 0.1% compressive strain.
Results of Warren–Averbach analysis on high resolution XRD scans of {111} and {222} peaks. Grain size is shown to increase with film thickness while compressive strain remains relatively constant at 0.1%.

Equiaxed polycrystalline gold has a Young's modulus of 78.5 GPa,Reference Brandes and Brook10 whereas single crystal gold is elastically anisotropic with the  $\left\langle {111} \right\rangle$ orientation being the stiffest. It is reasonable to assume that the textured film will exhibit the elastic properties of the single crystal rather than those of an equiaxed polycrystalline sample, therefore the Young's modulus is calculated to be
 ${E_{{\rm{Au}}\left\langle {111} \right\rangle }} = 117\;{\rm{GPa}}$ using Eq. (1) with the stiffness matrix for gold given in Eq. (2).
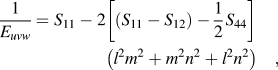 $${1 \over {{E_{uvw}}}} = {S_{11}} - 2\left[ {\left( {{S_{11}} - {S_{12}}} \right) - {1 \over 2}{S_{44}}} \right]\left( {{l^2}{m^2} + {m^2}{n^2} + {l^2}{n^2}} \right)\quad ,$$
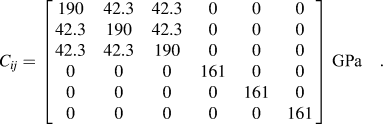 $${C_{ij}} = \left[ {\matrix{ {190} & {42.3} & {42.3} & 0 & 0 & 0 \cr {42.3} & {190} & {42.3} & 0 & 0 & 0 \cr {42.3} & {42.3} & {190} & 0 & 0 & 0 \cr 0 & 0 & 0 & {161} & 0 & 0 \cr 0 & 0 & 0 & 0 & {161} & 0 \cr 0 & 0 & 0 & 0 & 0 & {161} \cr} } \right]\;{\rm{GPa}}\quad {\rm{.}}$$
1. Tip preparation and area function calibration
As stated previously, accurate characterization of the tip is critical for nanoindentation experiments. A mounting fixture was developed to directly image a conospherical diamond tip to determine the geometry at high magnification. The indenter tip is fixed in a polymeric mounting device with a blind threaded hole as received from the equipment manufacturer. The polymeric fixture is glued into a transmission electron microscope (TEM) mounting fixture using a conductive adhesive. The mounting fixture is attached to the TEM sample holder with countersunk set screws.
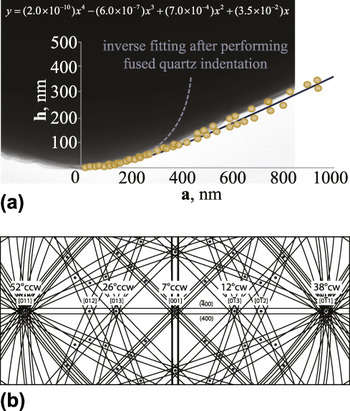
The normal loading axis of the indenter tip is oriented such that it is parallel with the sample holder α-tilt axis. The sample holder was inserted into a JEOL 200CX (Tokyo, Japan) TEM and the tip was imaged at 50 kx and 200 kV. The sample is adjusted so the normal loading axis and sample α-tilt axis are at the eucentric height. Figure 3 shows a representative image of the indenter tip at 0° tilt additional images were collected at 40° CCW and 40° CW and are not shown. The images were digitized and points were plotted along the profile. The data were fit to a curve to approximate an axisymmetric geometry to describe the tip shape. It is important to note that the inverse fitting method after performing fused quartz indentation does match well with the TEM results for indentation depths approaching 100 nm and therefore can be used with the modified Winkler approach detailed in this article as long as the width of the indent does not exceed 350 nm.
(a) TEM image of the indenter tip profile along with matching digitized points. (b) Schematic Kikuchi diffraction illustrating the orientation of the indenter loading axis.

B. Modified Winkler approach
A modified Winkler method was developed to determine the hardness and modulus of thin films for materials that exhibit large material pile-up. As shown in the characterization above, the indenter tip is assumed to have axisymmetric geometry and was fit to a fourth order polynomial from micrographs. The model is therefore axisymmetric and discretizes the film into a series of elements resembling a bed of springs, similar to the Winkler model.Reference Põdra and Andersson7 The model assumes that each differential element is constrained orthogonal to the loading direction due to surrounding material within the elastic regime. The justifications for this assumption are (i) the contact area radius is much larger than the film thickness and (ii) the Poisson ratio of gold is 0.42, which is nearly incompressible. This assumption of constraint results in no elastic strain in the directions orthogonal to the loading direction such that εxx = εyy = 0 and an equivalent modulus in the loading direction E zz that is defined in Eq. (3).
 $${E_{zz}} = {{\left( {1 - {\nu _{{\rm{Au}}}}} \right){E_{{\rm{Au}}\left\langle {111} \right\rangle }}} \over {\left( {1 + {\nu _{{\rm{Au}}}}} \right)\left( {1 - 2{\nu _{{\rm{Au}}}}} \right)}}\quad .$$
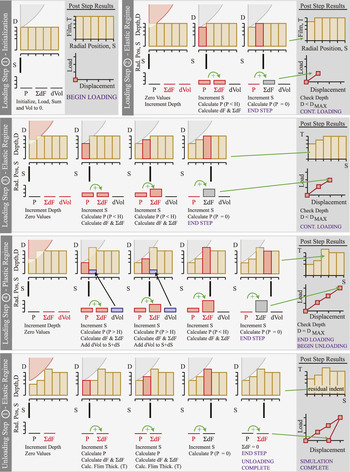
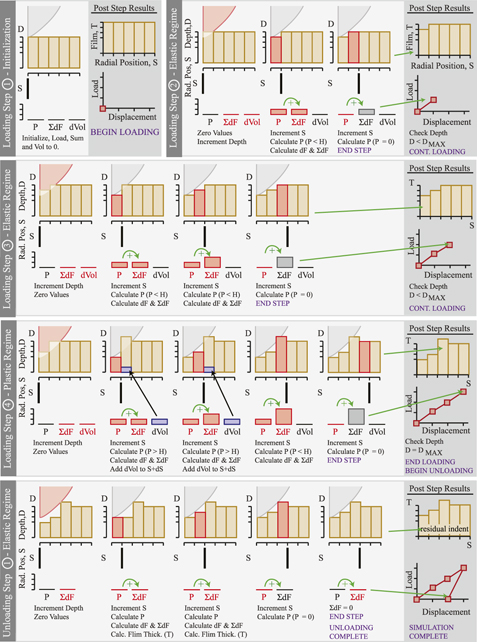
Figure 4 shows a representative schematic of the modified Winkler analysis process. The required initial conditions for the model are the tip geometry, maximum indentation depth (D MAX), film thickness (T 0), substrate compliance (S sub = 0.0107 nm/µN, estimated using E z = 130 GPa for a [100] Si wafer) and initial guesses for modulus and hardness, which are initialized in step 1 of the model. The variables that are used during the calculation process are; radial position (S), radial position increment (dS), indentation depth (D), depth increment (dD), incremental force (dP), total force (ΣdP), and displaced volume (dVol). At each displacement increment, the pressure on each discretized element is calculated using Eq. (4).
 $$\sigma = {D \over {{T_0}}}{E_{zz}}\quad .$$
A schematic illustrating the modified Winkler process. Step 1 is the initialization phase, Step 2 is the initial loading stage, Step 3 representative loading in the elastic regime, Step 4 representative loading in the plastic regime, and finally unloading.

In the first loading step, step 2, the indentation depth and radial position are incremented by dS and dD, respectively. The incremental force is calculated for each radial position, moving outward from the center and summed to determine the total force between the indenter tip and the film. The output of force–displacement and incremental film depth (with an adjustment for the compliance of the substrate) are plotted as post step results. Finally, a check is completed to determine if the current depth is greater than or equal to the maximum indentation depth.
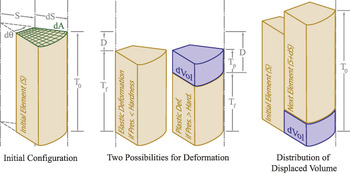
While the indentation depth is less than the maximum amount, two possibilities exist for continued loading steps, outlined in step 3 (for the elastic regime) and step 4 (for the plastic regime). Each step begins with the re-zeroing of the radial position, summed forces, and displaced volumes. Next, the depth is incremented and the load on each differential element is calculated. If the calculated load within a differential element is less than the hardness, the analysis follows step 3 for the elastic regime. The analysis in step 3 proceeds outward from the center as prescribed in step 2 until an incremental force of zero is measured within a radial differential element. If the calculated load within any differential element is greater than the hardness, the analysis follows step 4 for the plastic regime. To account for pile-up and plastic deformation neglected in the Oliver and Pharr model, the required displaced volume is calculated and transferred to the next outward differential element using Eq. (5).
 $${\rm{dVol}} = {T_{\rm{p}}}{\rm{d}}A\quad \quad {\rm{where}}\,{T_{\rm{p}}} = {{{T_0} - d} \over {1 - {H \over {{E_{zz}}}}}}\quad ,$$
where T p is the thickness of the plastically displaced volume. The incremental pressure in this case is set to equal the hardness and it is assumed that the remaining displaced material, dVol, is transferred outward to the next radial differential element, as shown in Fig. 5. The process proceeds outward radially until the force equals zero within a differential element. Again, the post step analysis is completed by summing the forces on each element and the indentation depth (with an adjustment for the compliance of the substrate) is checked against the maximum.
Representative images for the initial configuration, elastic regime loading, and plastic regime loading.

Upon reaching the maximum indentation depth, the loading process stops and the unloading process begins which is illustrated in unloading step 1. The indentation depth is subsequently incremented in the reverse direction and the incremental force is calculated for each differential element. The forces are summed and plotted versus indentation depth (with an adjustment for the compliance of the substrate) until the total force calculated is zero. Finally, the calculated load displacement graph is compared with the experimental results. If necessary, the initial guesses for E and H are updated and the simulation is re-run until the results coincide.
III. RESULTS AND DISCUSSION
A. Static indentation testing
A series of fifty displacement control indents were performed from 10 to 100 nm on each sample, varying the displacement incrementally from test to test using a Hysitron TI 900 TriboIndenter (Minneapolis, MN). Post-test, results were modified by initially subtracting the compliance of the machine from the experimentally determined load displacement curves using the manufactures procedure of indenting on fused quartz. The load–displacement curves were analyzed using Oliver and Pharr, Stone, and modified Winkler (MW) analysis methods and compared with the hardness determined using the Hall–Petch equation, details of the Oliver and Pharr method and Stone method have been outlined elsewhere.Reference Oliver and Pharr3,Reference Jakes, Frihart, Beecher, Moon and Stone11,Reference Stone, Yoder and Sproul12
B. Oliver and Pharr model
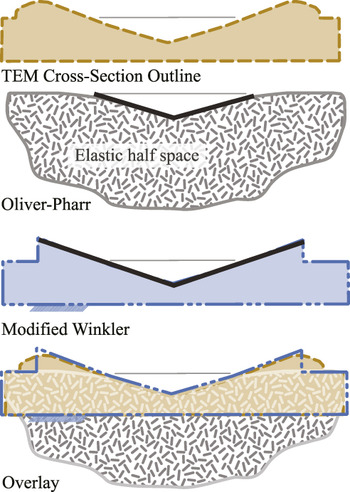
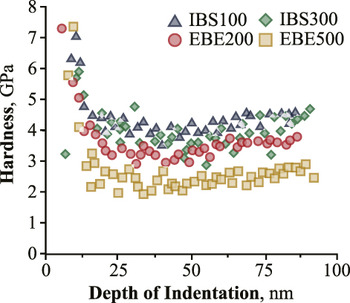
As mentioned previously, the Oliver and Pharr model assumes no pile-up, which can lead to an overestimation of hardness of materials that exhibit significant plastic flow. For indentation on materials that exhibit large plastic flow resulting in pile-up, the load is supported by a portion of the material that has been exuded from the area calculation, as shown in Fig. 6. A plot of the hardness results based on the Oliver and Pharr (O–P) model is shown in Fig. 7. Indentation tests analyzed with the O–P model results show an increase in hardness for each sample below 15 nm in maximum displacement. This result could arise from an inaccurate tip area function for these low displacements or from excessive scatter observed at indentation tests performed below 15 nm maximum displacement. Figure 7 shows the hardness for the remainder of the samples ranging from over 2 GPa for sample EBE 500 up to 5 GPa for sample IBS 100. Although the general “rule of thumb” for indentation suggests limiting the contact radius to less than 10% of the film thickness to avoid substrate contribution, the hardness values are not greatly affected by indentation depth for samples other than the IBS 100 sample with a film thickness of 105 nm. Though even in this case at a maximum displacement of 85% of the film thickness, the hardness has only increased by 25%.
Representative images of residual area calculations for the Oliver and Pharr method as well as the modified Winkler method overlaid with TEM cross-sections.

Hardness calculations for each individual indent using the Oliver and Pharr approach.

C. Stone's model
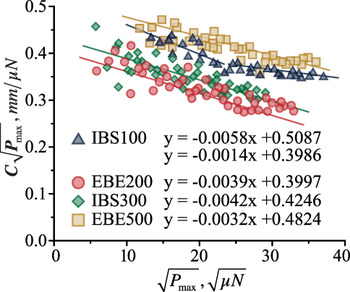
The same load displacement data that were used in the Oliver and Pharr method above are also analyzed using Stone's approach. Stone's approach assumes no indentation size effect and unloading as an isotropic elastic half-space. If these assumptions are valid, the plots of the product of compliance and the square root of load versus the square root of load should fall on one line as described in Ref. Reference Jakes, Frihart, Beecher, Moon and Stone11. Figure 8 shows Stone plots for each sample. IBS 100 film plots do not fit well to a single line indicating a mismatch between results and model assumptions.
Plots of the product of compliance and the square root of load versus the square root of load for each individual indent. The data for IBS 100 appear to be bimodal indicating a mismatch between results and model assumptions.

The assumption of isotropic elastic half-space is questionable for multiple reasons. It is reasonable to expect some contribution from the substrate on both of these samples considering the ratio of indentation depth to film thickness is 19–84% on sample IBS 100. The assumption of isotropy is problematic in that single crystals and textured surfaces are often elastically anisotropic. A measure of the degree of anisotropy is given by.Reference Spalvins and Buzek13
 $${{{C_{11}} - {C_{12}}} \over {2{C_{44}}}}\quad .$$
The compliance matrix for gold is given in Eq. (2), and the value for C 11, C 12, and C 44 for silicon are 165, 64, and 79.2 GPa, respectively.Reference Nye14 Calculating the degree of anisotropy for gold and silicon gives 0.46 and 0.64, where 1.0 is the result for an isotropic material. In addition to these factors, there exists a pressure induced phase transformation in silicon which may occur in the upper bounds of the maximum displacement.Reference Hebbache15
The data from the three remaining samples from Fig. 8 fit reasonably well to linear curves suggesting the assumption of no indentation size effect may be valid for these samples. The hardness for IBS 100 was calculated from the curve fit for the lower values of the square root of P max as these values correspond to smaller indentation depths.
D. Modified Winkler
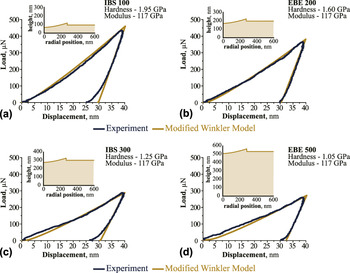
Again, the same load displacement data were used to determine the indentation hardness and reduced modulus of each film using the modified Winkler approach. The model was run for every indent and fit to the experimental data, subsequently, the hardness and modulus are reported. An example output from each film at an indentation depth of 40 nm is shown in Fig. 9.
Example load displacement curves for the experimental data and the modified Winkler approach for an indentation depth of 40 nm. The model is fit to the experimental data and the resulting hardness and modulus are reported.

Comparison of the indentation cross-section reveals that the modified Winkler method can accurately simulate the residual area for a specific loading case and film thickness. The average of indentation hardness and modulus is reported in the figure.
E. Hall–Petch
For materials that exhibit significant plastic deformation, hardness is frequently approximated by the yield strength with the equation:
 $$H = 3{\sigma _{\rm{y}}}\quad ,$$
where H is the hardness and σy is the yield strength.Reference Kelly16 Yield strength values for bulk gold range from 100 to 200 MPaReference Nye14 giving a hardness range of 300–600 MPa, well below the values calculated from Oliver and Pharr's model shown in Fig. 7. However, the published yield strength values from handbooks are for coarse-grained microstructures. It is well documented that yield strength increases with decreasing grain size by the Hall–Petch equationReference Dieter17:
 $${\sigma _{\rm{y}}} = {\sigma _0} + k{D^{ - {1 \mathord{\left/ {\vphantom {1 2}} \right. \kern-\nulldelimiterspace} 2}}}\quad ,$$
where σy is the yield strength, σ0 and k are material dependent parameters, and D is the grain size. Combining Eqs. (7) and (8) gives:
 $$H = 3\left( {{\sigma _0} + k{D^{ - {1 \mathord{\left/ {\vphantom {1 2}} \right. \kern-\nulldelimiterspace} 2}}}} \right)\quad .$$
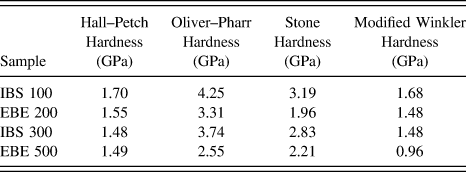
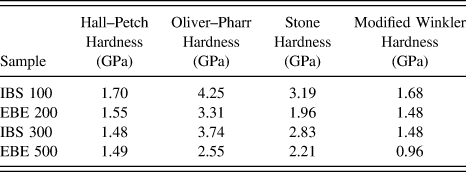
Conrad and Jung found σ0 = 216 MPa and k = 0.06 MPa m1/2 for gold.Reference Conrad and Jung18Table I shows Hall–Petch calculated hardness using Conrad and Jung's constants and the grain size of the sample measured by XRD from Fig. 2. The values for hardness range from 1.48 to 1.70 GPa.
A comparison of analysis techniques for identification of indentation hardness in thin films.
F. Comparison of techniques
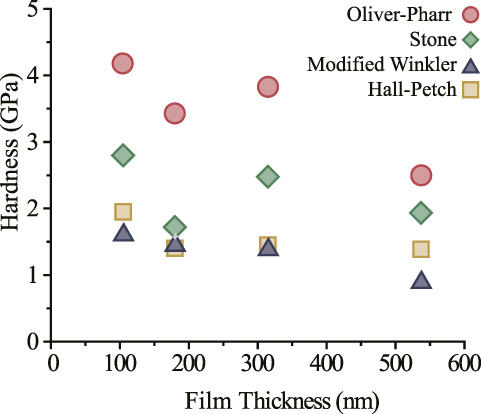
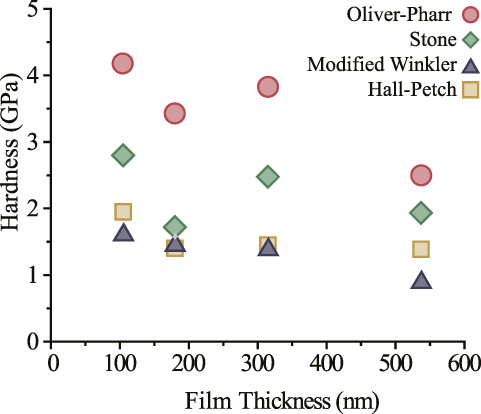
The values in Table I and Fig. 10 compare the calculated indentation hardness with the Hall–Petch method. The results from the Stone analysis are lower than the values determined by Oliver and Pharr, but they are still higher than those predicted by the Hall–Petch equation. The reduction in grain size does not justify the high hardness values obtained from the Oliver and Pharr analysis method. Thus, an inaccurate approximation of contact area due to material pile-up is the likely cause of overestimation of hardness. Figure 10 shows a plot of the hardness versus the sample thickness for the Oliver and Pharr method, the Stone method, the modified Winkler model, and the predicted values based on the Hall–Petch equation and sample grain size. The modified Winkler predictions show excellent agreement with Hall–Petch for sample IBS 100, EBE 200, and IBS 300. As mentioned previously, the assumptions for Stone's model are questionable for large displacement depth to film thickness ratios. The more likely agreement shows up on sample EBE 500 where modified Winkler determines a value somewhat lower than Hall–Petch, and Stone calculates a higher value. The larger thickness of EBE 500 at 537 nm gives an indentation depth to film ratio from 3.7 to 16.6% making the elastic half-space assumption much more reasonable.
A comparison of analysis techniques for identification of indentation hardness in Au thin films.
IV. CONCLUSIONS
A variety of characterization techniques including nanoindentation, x-ray diffraction, ion beam milling, and electron microscopy were used to analyze Au thin films. Established indentation models overestimate hardness in materials that exhibit pile-up especially in very thin films 100 nm in thickness. An alternative model was formulated and using only the load displacement data, tip characterization and film characterization, indentation hardness, and reduced modulus were calculated. The results of this alternative model show good agreement with analytical techniques and the Hall–Petch relationship for the grain size of the films tested.
The novelty of this method is that it can be applied to many systems that exhibit significant plastic deformation and material pile-up, the method can be applied in a very short amount of time without the need for additional microscopy or complex computational methods. In fact, the MATLAB script that was developed along with this method could easily be implemented within the analysis tool kit in many commercial nanoindentation systems as an alternate solution methodology.
ACKNOWLEDGMENT
The authors would like to acknowledge Dr. W. Greg Sawyer for his many helpful discussions and insights into nanoindentation mechanics.