There is an increased risk of cognitive decline as life span extends and therefore a potential for increased prevalence of cognitive impairment as world populations age. Cognitive function is an important aspect of quality of life among older adults, and maintaining cognitive functioning is critical to the maintenance of independence in old age (Langa et al., Reference Langa2009). Longitudinal studies show that, on average, there is some degree of cognitive decline in normal aging (Albert et al., Reference Albert1995). One prospective study found that cognitive scores declined significantly over ten years in those aged 45–70 years at baseline and decline was faster in older people (Singh-Manoux et al., Reference Singh-Manoux2012). Although age is the strongest predictor of cognitive decline (Salthouse, Reference Salthouse2009) there is considerable heterogeneity within older aged cohorts in the rate, type, or occurrence of cognitive decline (Callow and Alpass, Reference Callow and Alpass2014). Several studies have focused on identifying the factors that predict cognitive change to contribute to the optimization of successful aging (Albert et al., Reference Albert1995).
Important predictors of cognitive decline identified in this literature include educational attainment, income, health, health behaviors, activity level, and depression. Educational history has been the most consistent predictor of cognitive change, with higher levels of educational attainment associated with greater maintenance of cognitive function (e.g. Albert et al., Reference Albert1995; Freitas et al., Reference Freitas, Simoes, Alves and Santana2012). There is also considerable evidence that physical activity has a protective effect against cognitive decline (Anstey and Christensen, Reference Anstey and Christensen2000). For example, in a large prospective study in the US, higher levels of physical activity were associated with lower rates of cognitive decline (Albert et al., Reference Albert1995). Physical health is also associated with cognitive health. A number of age-related conditions have been shown to be related to cognitive decline such as cardiovascular disease, obesity, hypertension, and diabetes (e.g. Kivipelto et al., Reference Kivipelto2001; Kumari and Marmot, Reference Kumari and Marmot2005). Health related behaviors have also been linked to cognitive health with smoking and alcohol consumption receiving most attention (Anstey et al., Reference Anstey, von Sanden, Salim and O’Kearney2007; Reference Brandt, Spencer and Folstein2009). There is increasing evidence that depressive symptoms are associated with poorer cognitive functioning performance (Bunce et al., Reference Bunce, Batterham, Mackinnon and Christensen2012), and higher risk of cognitive decline (Rosenberg et al., Reference Rosenberg, Mielke, Xue and Carlson2010). Income has been shown to provide secondary benefits (Albert et al., Reference Albert1995) and may be a proxy for other life advantages.
Differences in the prevalence of cognitive impairment among older people across different countries of similar cultural and economic background may provide an opportunity to compare the influence of these factors. For example, the HRS in the United States found an estimated 6% of people aged 70 years and older in the community had moderate to severe cognitive impairment (Suthers et al., Reference Suthers, Jung and Crimmins2003). Studies in the United Kingdom have estimated impairment ranging from 2.3% (65–74 years old), 7.2% (75–84 years old) and 21.9% (85+), (Melzer et al., Reference Melzer, Ely and Brayne1997). An early New Zealand study suggested that for people aged over 65 years, the prevalence of severe impairment was 7.7% and 30% for those over 85 years (Campbell et al., Reference Campbell, McCosh and Reinken1983). Langa et al. (Reference Langa2009) made the first direct cross-country comparisons between the US and the UK. They assessed cognitive performance in non-hispanic whites aged 65 years and over using the same tests of memory and orientation to show that US adults scored significantly higher. This was despite US adults having a significantly higher prevalence of cardiovascular risk factors and disease. Langa et al. (Reference Langa2009) suggest that other demographic and social trends in different countries have some impact on these apparent differences.
Studies that aim to identify the important factors that predict cognitive decline in older adults will make important and valuable contributions to the prevention and delay of cognitive decline and the promotion of successful aging. Cross national studies are one approach to identify these important factors (Langa et al., Reference Langa2009) as they provide an opportunity to explore any differences and shed light on etiological factors. We compared the cognitive health of national samples of older adults in New Zealand and the USA using the same measures, and sought to account for any differences using a range of known risk factors. Specific research questions were:
-
1. Do older adults in New Zealand and the USA differ in their cognitive health?
-
2. Do they differ in known risk factors for cognitive dysfunction?
-
3. How are the risk factors related to cognitive function when the national samples are combined?
-
4. To what extent do differences in risk factors account for national difference in cognitive health?
Methods
Samples
The New Zealand Longitudinal Study of Aging (NZLSA) is a biennial, longitudinal postal survey of older adults in New Zealand. Participants were sampled via equal probability random sampling from the New Zealand Electoral Roll to achieve a nationally-representative survey sample of New Zealanders aged 48–84 years, (for methodology see Alpass et al., Reference Alpass2007; Towers and Stevenson, Reference Towers and Stevenson2014). Over-sampling of Māori (indigenous New Zealanders) was specifically undertaken during participant selection for NZLSA to combat the historically poor research participation rates found in older ethnic minority populations (Moreno-John et al., Reference Moreno-John2004). A sub-sample of 1,001 participants aged 49–84 years was drawn from those who participated in the first NZLSA postal survey (N = 3,311) in 2010 to participate in face-to-face interviews. For the present study listwise deletion of cases due to missing data resulted in a final sample of 953. Participants were assessed on a number of cognitive measures as described below and risk factor indicators were drawn from their postal survey data.
The HRS is a biennial, longitudinal survey of older adults in the USA. A sample of 3,746 respondents was selected from the 21,233 who participated in the 2010 wave of the HRS. These respondents were chosen because they were aged between 49 and 84 years in 2010 (the age range in the NZLSA); and had provided data on all the variables included in the present study. The variables were those indicators of cognitive health or of potential risk factors that had been measured in the same way in both studies, or that could be made comparable by recoding. The greatly reduced sample size is mainly explained by the fact that in the HRS not all respondents are asked all questions.
Population weights are applied to all data in the NZLSA and the HRS so that statistical estimates can be made for the national populations that have been sampled probabilistically. For the NZLSA, proportional weights are applied that compensate for the oversampling of Māori (indigenous) respondents and for response biases due to age, gender or ethnicity. The HRS uses a two-stage weighting scheme that adjusts for similar variables, first at the household level and then at the respondent level. Unlike the NZLSA, the HRS weights are also scaled up so that population estimates reflect population numbers. For the present analyses, we used the NZLSA proportional weights for the NZLSA cases, but the unscaled version of the HRS proportional weights for the HRS cases. This strategy was necessary to make the samples comparable in the weighted analyses. The weighted sample sizes in these analyses were 1,018 for NZLSA cases and 3,325 for HRS cases. Details on the sampling strategies and weighting schemes used by the two studies can be found in Towers and Stevenson (Reference Towers and Stevenson2014) and in Ofstedal et al. (Reference Ofstedal, Weir, Chen and Wagner2011).
Measures
The NZLSA and HRS measures of cognitive health, sex, age, income, education, disease prevalence, physical exercise, alcohol consumption, smoking, depression, and self-reported health were sufficiently similar that they could be made directly comparable by recoding the HRS data where necessary. All responses coded as “don't know,” “not asked,” or “refused to answer” were treated as missing data.
Cognitive health was measured with six subscales: vocabulary, numeracy, orientation, serial 7s, immediate recall, and delayed recall. The scales were derived from existing measures, including the Weschler Intelligence Scale-Revised (WAIS-R, Wechsler, Reference Wechsler1981) and the Telephone Interview for Cognitive Status (TICS, Brandt et al., Reference Brandt, Spencer and Folstein1988). For a full description see Ofstedal et al. (Reference Ofstedal, Fisher and Herzog2005). Respondents’ vocabulary was tested on the meaning of five words. Each response was coded as 0 for wrong, 1 for partially correct and 2 for fully correct, and summed to give a total score out of 10. Numeracy was assessed using three questions that required the respondent to apply simple arithmetic to a real world situation such as winning a lottery and earning interest in a bank account. The number of correct answers provided a score on a 0–3 scale. To assess orientation, respondents were asked to name the current day, date, month, year, and (in the NZLSA only) the season. Correct response scored 1 and was summed to form an orientation score. The NZLSA orientation scores were divided by 1.25 so that scores for all cases were on a 0–4 scale. Working memory was assessed by asking respondents to report the numerical outcomes of incrementally subtracting 7 five times from 100. Each correct response was scored 1, and summed to form a total serial 7s score on a 0–5 scale. To test immediate recall, respondents were asked to repeat ten words immediately after hearing them, producing a score of 0–10 according to the number of words correctly recalled. Delayed recall was assessed and scored in the same way, except that recall was tested after a delay of five minutes. A total cognitive health score was the sum of the six subscale scores on a 0–42 scale.
Age was measured in years, and then categorized: “49–64,” “65–74,” and “75–84,” to enable pre-/post-retirement comparisons. For the regression analyses, these categories were converted into two dummy variables with the youngest group as the reference category. Income was measured as before tax income in US dollars, using the average NZ–US exchange rate for 2010 to make the incomes of NZLSA participants comparable with those in the HRS. Income was then trichotomized as: $0–25,230; $25,231–53,280; and >$53,280. For regression purposes, two dummy variables used the lowest income group as the reference category. Given differences in the structure of the New Zealand and US education systems, Education was coded, in terms of highest qualification completed, as: “no qualifications,” “high school qualification,” “post high school qualification,” and “university degree.” These categories were used to construct three dummy variables with “no qualifications” as the reference category.
Self-reported health was assessed with one question: “In general do you feel your health is excellent (5), very good (4), good (3), fair (2) or poor (1)?” This five point scale was used in the analyses without any transformation. To assess Chronic disease prevalence, respondents were asked: “Has a doctor ever told you that you had. . .?” with respect to cancer, diabetes, heart disease, hypertension, and stroke. A yes/no response represented the presence or absence of each disease. The assessment of Physical Exercise focused on the frequency of moderate exercise which provided the greatest variability. Responses were coded as: “hardly ever,” “1–3 times a month,” “once a week,” or “more often than once a week.” For regression purposes, these were represented as three dummy variables with “hardly ever” as the reference category. Alcohol consumption was categorized in terms of frequency as: “never,” “weekly or less,” “2–3 times a week,” “or more often than three times a week.” Smoking was measured as a current smoker or not.
Depression was measured using six items from the CES-D scale (Radloff and Locke, Reference Radloff, Locke and Rush2000): feeling depressed, things are an effort, restless sleep, feeling happy, feeling lonely, and cannot get going. Responses were coded as 1 for yes and 0 for no, with the happy item reverse coded. Responses were summed to provide a depression score on a 0–6 scale. Given the highly skewed distribution of this variable, scores were categorized as 0, 1–2, and 3–6. For the regression analyses these categories were represented as two dummy variables with 0 as the reference category.
In the NZLSA, all measures were administered face to face whilst in the HRS, telephone interviews were used for some participants. No attempt was made to statistically control for this difference as there is an evidence that the two modes of administering the cognitive tests produce similar scores (Herzog and Wallace, 1997).
Analyses
National differences in cognitive function were analyzed using independent t tests and 95% confidence intervals of mean differences on the cognitive subscales and total scale scores. National differences in all other variables were then assessed using independent t tests and χ2 analyses where appropriate. The remaining analyses combined the two national samples and focused on the total cognitive score as the dependent variable. As a preliminary to the main analyses, appropriate bivariate correlations were computed for all pairs of variables.
A hierarchical regression approach following Langa et al. (Reference Langa2009) was used to construct an incremental series of ordinary least squares (OLS) regression models with total cognitive score as the dependent variable. The first model contained only country as a dummy predictor, and its unstandardized regression coefficient used to estimate the national cognitive score mean difference. Subsequent models added in subsets of predictors, to test how the magnitude of the country regression coefficient changed from model to model. The greater the change between two models, the more likely that the additional predictors play some role in accounting for the cognitive score difference. Accordingly, the additional predictors are seen as “explanatory factors” that attenuate the differences in cognitive health between the HRS and NZLSA. The statistical significance of the relationships between the predictors and the cognitive score also attested to the risk factor status of each predictor.
A power analysis (using G*Power3) to estimate the required sample size for this type of hierarchical regression analysis showed that the sample size requirements were more than satisfied. To detect a small effect size (f2 = 0.02) with power of 0.80, an α of 0.05 and using 24 predictors, a sample of approximately 1,150 was required. Since the actual sample size was nearly four times this number, it was apparent that the analyses were sufficiently powerful, even if more stringent criteria were applied.
Winship and Radbill (Reference Winship and Radbill1994) have argued that regression analyses using weighted data can produce misleading results, and recommend that weighted and unweighted analyses should be compared. Because the pattern of results in the present analyses was very similar using weighted and unweighted data, we report only the results of the weighted analyses for two reasons beyond their broad similarity. First, the unweighted analyses tended to produce slightly higher estimates of effects, so the weighted ones provide a more conservative and cautious picture. Second, it means that all of the following analyses focus on the same sample.
Another issue that was tested was the age differences between the two samples which threatened a serious confound even though age was controlled for. To test sensitivity of the effect, age was included in the models as a linear variable, with a quadratic trend. There was no quadratic effect. In addition all participants below 65 years were excluded and age was recoded into 5 year categories. The reduced sample and finer age coding produced smaller mean differences, but within the same confidence intervals for the final models. Given these small differences which provide the same conclusions, the decision was made to retain the full N for both samples.
Results
National differences in cognitive function
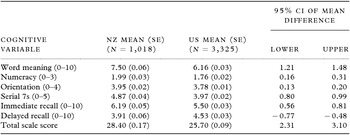
Table 1 shows the means and standard deviations for the two samples on the cognitive subscales and total scale. They indicate that on average the NZ sample scored 2.7 points higher than the US sample on the total scale, and that this positive difference is reliably present for all of the subscales except for delayed recall.
Mean cognitive scores in the NZ and US samples adjusted for age

Note: All mean differences are statistically significant (p < 0.001) using analysis of covariance to control for age in years.
Because some of the scores on the tests were ordinal, we also ran Mann–Whitney tests on the differences between the seven scores. The results were the same as for the ANCOVAs, except for delayed recall which became non-significant.
National differences in risk factors
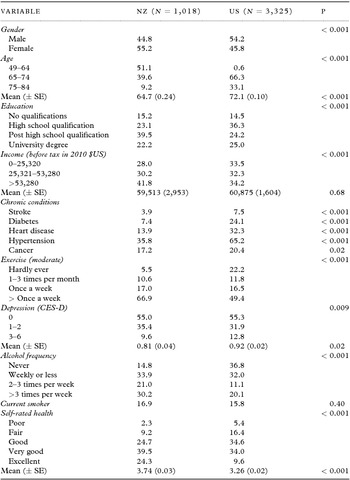
Table 2 shows national differences in the measured risk factors. For categorical variables, the table provides the percentage of cases in each category and the p value associated with a χ2 test of independence. For continuous variables, the table shows national means and standard errors and the p value derived from an independent t test. These results show that the two samples differ on all variables except for smoking status. The NZ sample has more women, is younger, has fewer disease conditions, takes more exercise, suffers less depression and has better self-rated health.
Differences in risk factors between the NZ and US samples

Bivariate relationships between risk factors and cognitive health
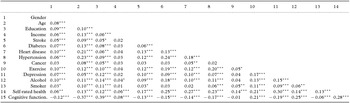
Table 3 shows the simple correlations among all variables for the combined sample. The type of coefficient varies according to the measurement scale of the variables (Pearson's r, phi, Cramer's V and eta), to give a comparable estimate of each effect size. The bottom row of Table 3 shows that all of the variables except cancer are significantly related (p < 0.001) to cognitive function. The independent variables are interrelated (so that no conclusions about strength of relationship may be made without multivariate analyses).
Simple correlations among all variables for combined sample (N = 4,343)

Note: p < 0.05* p < 0.01** p < 0.001***.
Regression analyses of multivariate relationships
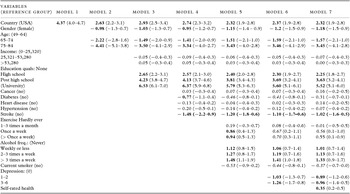
A hierarchical regression consisting of seven cumulative models was conducted. The standard OLS regression assumptions of multivariate normality, homoscedasticity, linearity, independence, and absence of multicollinearity were assessed and no violations were detected. Model 1 contained only the country dummy variable (New Zealand = 1, USA = 0). The predictors were then added as follows: Model 2, sex and age; Model 3, income and education; Model 4, chronic diseases; Model 5, exercise, alcohol, and smoking; Model 6,depression; Model 7, self-rated health. Table 4 shows the results for these seven models in the form of unstandardized regression coefficients and their 95% confidence interval. With the exception of self-rated health, the coefficients can be interpreted as mean differences in cognitive score between categories, adjusted for all other variables in the model.
Unstandardized coefficients from cumulative regressions of total cognitive score on all predictors (N = 4,319)

Notes: Bold = p < 0.001 Italics = p < 0.05.
Model 7 provides statistical control of all of the relationships among the predictors. It thus shows the independent effect of each predictor net of all other effects. Using the more stringent α of 0.001, the results suggest that poorer cognitive function is found in participants who are male, are older, are more poorly educated, have suffered a stroke, consume alcohol less frequently, are more depressed, and report worse overall health.
The results shown in Table 4 also address the main study question of how far national differences in risk factors account for the difference in cognitive function by examining change in the regression coefficient for country across the models. Model 1 shows the New Zealand advantage of 4.4 points on the cognitive scale. In Model 2, the difference drops to 2.6 when sex and age are controlled. The country difference changes as further sets of predictors are entered, however, after accounting for all risk factors in the final model it remains at 2.3. In terms of explained variance using adjusted R 2, country explains about 11% of the variance in cognitive scores. The inclusion of all other variables (after age and sex) adds only a further 3% of explained variance.
Discussion
As observed by Langa et al. (Reference Langa2009), there is an apparent difference in cognitive functioning scores between national samples of older people indicating differences between countries. The present findings show that older people in New Zealand, after accounting for age and gender differences in the samples, have a higher average cognitive functioning score of 2.6 which translates to a relative difference of 9%. This difference is comparable with that of Langa et al. (Reference Langa2009) who reported a 12% relative difference between the US and the UK.
The NZ sample had fewer disease conditions, reported higher levels of moderate exercise, suffered less depression, reported higher alcohol use, and better self-rated health. These factors might suggest a variety of possible reasons for the better cognitive functioning of the New Zealand sample. However, this sample was also significantly younger on average and included more women. While controlling for the age and sex differences, we found that all significant risk factors could only explain an additional 3% of variance, leaving a substantial country variance of 11% in cognitive functioning scores and a mean difference in scores of 2.3 unexplained. Thus, the additional risk factors we included as explanatory variables, account for little of the observed national difference in cognitive function.
All of the significant risk factors were related to cognitive functioning in the expected direction and supported the role of education, self-rated health, stroke, diabetes, depression, smoking, exercise, and alcohol use as explanatory variables for differences in cognitive functioning among older adults. The New Zealand sample showed significantly higher levels of alcohol use and this factor deserves comment. Although alcohol use has been included in studies of cognitive functioning as a risk factor, both Langa's (Reference Langa2009) national comparison and the present study showed that drinking (compared to abstinence) was positively associated with cognitive performance. This finding is in accord with current understandings of the relationship between alcohol use and cognitive functioning; light to moderate alcohol use does not impair cognitive functioning. A meta-analysis of longitudinal studies of alcohol consumption and cognitive function (Anstey et al., Reference Anstey, Mack and Cherbuin2009) showed reduced risk of dementia (but not cognitive decline) for drinkers across time. In studies not included in the meta-analysis, four showed no effect on cognitive function, while four showed a protective effect for some aspects of cognitive function. Findings such as these remain controversial as to their basis, but do lead to suggestions that light to moderate alcohol use may be protective. For example, Elwood et al. (Reference Elwood2013) included light to moderate alcohol use in a set of healthy behaviors predicted to reduce cognitive decline. The present results support this view in regard to cross sectional associations while controlling for other factors such as education and income that may explain the association.
The limitations of this study include the demographic differences in the sample. Although we were able to statistically control for age and gender differences, more directly comparable samples would assist future comparisons. A second limitation is the measurement of the risk factors considered. Large scale observational studies may not be able to assess the detailed effects of factors such as exercise or a diagnosis of diabetes. Although such factors are known to be related to cognitive functioning and our observed effects were in the expected direction, more reliable and focused measurement might explain more of the variance and highlight the important factors. Third, as all variables in the present regression equations explained only about a third of the variance in cognitive score, another limitation must be in the potential risk factors which were not included in this study. For example, several studies have reported on the efficacy of social support or social engagement. However, Plassman et al. (Reference Plassman, Williams, Burke, Holsinger and Benjamin2010) conducted a systematic review of the literature and found no consistent association for marital status, social support, or social engagement. The other important factors related to cognitive decline which were noted by these authors are beyond the scope of the present study and must be pursued with alternative methods. Plassman et al. (Reference Plassman, Williams, Burke, Holsinger and Benjamin2010) found low quality but positive evidence for the effect of diet (particularly consumption of vegetables), and data from both observational studies and randomized controlled trials supported the efficacy of cognitive training in reducing cognitive decline.
As the population of the world ages rapidly, national health services and policy-makers must be concerned with the prevention of unnecessary cognitive decline. Cognitive functioning is a significant aspect of health and many skills of daily living become disrupted with the progression of cognitive impairment. Stuck et al. (Reference Stuck1999) reviewed the literature to show that reduced cognitive functioning is a primary predictor of functional decline which increases the likelihood of an older person entering a residential setting (Perry and Hodges, Reference Perry and Hodges2000). The present study has supported the role of education, self-rated health, stroke, diabetes, depression, smoking, exercise, and alcohol use as explanatory variables for differences in cognitive functioning among older adults, and additionally shown that there are country based differences. Despite some contribution of differences in physical health, alcohol use, depression and exercise, this contribution did not explain most of the differences in cognitive functioning scores between US and New Zealand populations. Future cross-national research should consider additional factors that might explain such cross-country differences. Furthermore, the question of cross-national differences in the relationships between such risk factors and cognitive functioning is an important topic for considered enquiry.
Conflict of interest
None
Description of authors’ roles
Christine Stephens designed the study, co-supervised the data collection and wrote the paper.
John Spicer was responsible for the statistical design of the study and for carrying out the statistical analysis. He also contributed to the writing.
Claire Budge assisted with preparation of variables for analysis and carrying out the statistical analysis.
Brendan Stevenson was responsible for data collection and data preparation and assistance with preparation of variables for analysis.
Fiona Alpass co-supervised the data collection and contributed to designing the study and writing the paper.
Acknowledgments
The National Institute on Aging (NIA) provided funding for the Health and Retirement Study (HRS) (U01 AG09740). The HRS is directed at the Institute for Social Research, University of Michigan, USA. The New Zealand Foundation for Research in Science and Technology (FRST) provided funding for the New Zealand Longitudinal Study of Ageing (NZLSA) (MAUX0401). NZLSA was directed by a collaboration between Massey University, Otago University, and the Family Centre Social Policy Research Unit, all of New Zealand. None of the funding sources had a role in the design and conduct of the study; collection, management, analysis, and interpretation of the data; and preparation, review, approval, or the decision to submit the manuscript for publication. Data from both studies is publicly available for research purposes.