





1. Introduction
We stabilize the wake behind a fluidic pinball using a hierarchy of model-free self-learning control methods from a one-parametric study of open-loop control to a gradient-enriched machine learning feedback control. Flow control is at the heart of many engineering applications. Traffic alone profits from flow control via drag reduction of transport vehicles (Choi, Jeon & Kim Reference Choi, Jeon and Kim2008), lift increase of wings (Semaan et al. Reference Semaan, Kumar, Burnazzi, Tissot, Cordier and Noack2016), mixing control for more efficient combustion (Dowling & Morgans Reference Dowling and Morgans2005) and noise reduction (Jordan & Colonius Reference Jordan and Colonius2013).
The control logic is a critical component for performance increases after the actuators and sensors have been deployed. The hardware is typically determined from engineering wisdom (Cattafesta & Shelpak Reference Cattafesta and Shelpak2011). The control law may be designed with a rich arsenal of mathematical methods. Control theory offers powerful methods for control design with large success for model-based stabilization of low-Reynolds-number flows or simple first- and second-order dynamics (Rowley & Williams Reference Rowley and Williams2006). Transport-related engineering applications are at high Reynolds numbers and, thus, associated with turbulent flows. So far, turbulence has eluded most attempts for model-based control albeit for a few simple exceptions (Brunton & Noack Reference Brunton and Noack2015). Examples relate to first- and second-order dynamics, e.g. the quasi-steady response to quasi-steady actuation (Pfeiffer & King Reference Pfeiffer and King2012), opposition control near walls (Choi, Moin & Kim Reference Choi, Moin and Kim1994; Fukagata & Nobuhide Reference Fukagata and Nobuhide2003), stabilizing phasor control of oscillations (Pastoor et al. Reference Pastoor, Henning, Noack, King and Tadmor2008) and two-frequency crosstalk (Glezer, Amitay & Honohan Reference Glezer, Amitay and Honohan2005; Luchtenburg et al. Reference Luchtenburg, Günter, Noack, King and Tadmor2009). In general, control design is challenged by the high dimensionality of the dynamics, the nonlinearity with many frequency crosstalk mechanisms and the large time delay between actuation and sensing.
Hence, most closed-loop control studies of turbulence resort to a model-free approach. A simple example is extremum seeking (Gelbert et al. Reference Gelbert, Moeck, Paschereit and King2012) for online tuning of one or few actuation parameters, like amplitude and frequency of periodic actuation. More complex examples involve high-dimensional parameter optimization with methods of machine learning, such as evolutionary strategies (Koumoutsakos, Freund & Parekh Reference Koumoutsakos, Freund and Parekh2001) and genetic algorithms (Benard et al. Reference Benard, Pons-Prats, Periaux, Bugeda, Braud, Bonnet and Moreau2016). Even regression problems for nonlinear feedback laws have been learned by genetic programming (Ren, Hu & Tang Reference Ren, Hu and Tang2020) and reinforcement learning (Rabault et al. Reference Rabault, Kuchta, Jensen, Réglade and Cerardi2019).
Genetic programming control (GPC) has been pioneered by Dracopoulos (Reference Dracopoulos1997) over 20 years ago and has been proven to be particularly successful for nonlinear feedback turbulence control in experiments. Examples include the drag reduction of the Ahmed body (Li et al. Reference Li, Noack, Cordier, Borée, Kaiser and Harambat2018) and the same obstacle under yaw angle (Li et al. Reference Li, Borée, Noack, Cordier and Harambat2019), mixing layer control (Parezanović et al. Reference Parezanović, Cordier, Spohn, Duriez, Noack, Bonnet, Segond, Abel and Brunton2016), separation control of a turbulent boundary layer (Debien et al. Reference Debien, von Krbek, Mazellier, Duriez, Cordier, Noack, Abel and Kourta2016), recirculation zone reduction behind a backward facing step (Gautier et al. Reference Gautier, Aider, Duriez, Noack, Segond and Abel2015) and jet mixing enhancement (Zhou et al. Reference Zhou, Fan, Zhang, Li and Noack2020), just to name a few. Genetic programming control has consistently outperformed existing optimized control approaches, often with unexpected frequency crosstalk mechanisms (Noack Reference Noack2019). Genetic programming control has a powerful capability to find new mechanisms (exploration) and populate the best minima (exploitation). Yet, the exploitation is inefficient leading to increasing redundant testing of similar control laws with poor convergence to the minimum. This challenge is well known and will be addressed in this study.
As a benchmark control problem, we chose the fluidic pinball, the flow around three parallel cylinders one radius apart from each other (Noack et al. Reference Noack, Stankiewicz, Morzyński and Schmid2016; Chen et al. Reference Chen, Ji, Alam, Williams and Xu2020; Deng et al. Reference Deng, Noack, Morzyński and Pastur2020). The triangle of centres points in the direction of the flow. The actuation is performed by rotating each cylinder independently. The flow is monitored by nine velocity probes downstream. The control goal is the complete stabilization of the unstable symmetric steady Navier–Stokes solution. This choice is motivated by several reasons. First, already the unforced fluidic pinball shows a surprisingly rich dynamics. With increasing Reynolds number the steady wake becomes successively unstable in a Hopf bifurcation, a pitchfork bifurcation, another Hopf bifurcation before, eventually, a chaotic state is reached. Second, the cylinder rotations may encapsulate the most common wake stabilization approaches, such as Coanda forcing (Geropp & Odenthal Reference Geropp and Odenthal2000), base bleed (Wood Reference Wood1964; Bearman Reference Bearman1967), low-frequency forcing (Pastoor et al. Reference Pastoor, Henning, Noack, King and Tadmor2008), high-frequency forcing (Thiria, Goujon-Durand & Wesfreid Reference Thiria, Goujon-Durand and Wesfreid2006), phasor control (Roussopoulos Reference Roussopoulos1993) and circulation control (Cortelezzi, Leonard & Doyle Reference Cortelezzi, Leonard and Doyle1994). Third, the rich unforced and controlled dynamics mimics nonlinear behaviour of turbulence while the computation of the two-dimensional flow is manageable on workstations. To summarize, the fluidic pinball is an attractive all-weather plant for non-trivial multiple-input multiple-output (MIMO) control dynamics.
This study focuses on the stabilization of the unstable symmetric steady solution of the fluidic pinball in the pitchfork regime, i.e. for asymmetric vortex shedding. This goal is pursued under symmetric steady actuation, general non-symmetric steady actuation and general nonlinear feedback control. We aim to physically explore the actuation mechanisms in a rich search space and to efficiently exploit the performance gains from gradient-based approaches. This multi-objective optimization leads to innovations of hitherto employed parameter optimizations and regression solvers as a beneficial side effect.
The manuscript is organized as follows. Section 2 introduces the fluidic pinball problem and the corresponding direct numerical simulation. Section 3 reviews and augments machine learning control strategies. In § 4 a hierarchy of increasingly more complex control laws is optimized for wake stabilization. Section 5 discusses design aspects of the proposed methodology. Section 6 summarizes the results and indicates directions for future research.
2. The fluidic pinball – a benchmark flow control problem
In this section we describe the fluid system studied for the control optimization – the fluidic pinball. First we present the fluidic pinball configuration and the unsteady two-dimensional Navier–Stokes solver in § 2.1, then the unforced flow spatio-temporal dynamics in § 2.2 and finally the control problem for the fluidic pinball in § 2.3.
2.1. Configuration and numerical solver
The test case is a two-dimensional uniform flow past a cluster of three cylinders of same diameter  $D$. The centre of the cylinders form an equilateral triangle pointing upstream. The flow is controlled by the independent rotation of the cylinders along their axis. The rotation of the cylinders enables the steering of incoming fluid particles, like a pinball machine. Thus, we refer to this configuration as the fluidic pinball. In our study we choose the side length of the equilateral triangle equal to
 $1.5D$. The distance of one radius gives rise to an interesting flip-flopping dynamics (Chen et al. Reference Chen, Ji, Alam, Williams and Xu2020).
The flow is described in a Cartesian coordinate system, where the origin is located midway between the two rearward cylinders. The  $x$-axis is parallel to the streamwise direction and the
 $y$-axis is orthogonal to the cylinder axis. The velocity field is denoted by
 $\boldsymbol {u}=(u,v)$ and the pressure field by
 $p$. Here,
 $u$ and
 $v$ are, respectively, the streamwise and transverse components of the velocity. We consider a Newtonian fluid of constant density
 $\rho$ and kinematic viscosity
 $\nu$. For the direct numerical simulation, the unsteady incompressible viscous Navier–Stokes equations are non-dimensionalized with cylinder diameter
 $D$, the incoming velocity
 $U_{\infty }$ and the fluid density
 $\rho$. The corresponding Reynolds number is
 . Throughout this study, only
 $Re_D =100$ is considered.
The computational domain  $\varOmega$ is a rectangle bounded by
 $[-6,20]\times [-6,6]$ and excludes the interior of the cylinders,
 \begin{align} \varOmega &= \{[x,y]^\intercal \in \mathcal{R}^2 \colon [x,y]^\intercal \in [{-}6,20]\times[{-}6,6] \land (x-x_i)^2\nonumber\\ &\quad +(y-y_i)^2 \geq 1/4,\ i=1, 2, 3 \}. \end{align}
Here  $[x_i,y_i]^\intercal$, with
 $i=1,2,3$, are the coordinates of the cylinder centres, starting from the front cylinder and numbered in a mathematically positive direction,
 \begin{equation} \begin{array}{ll} x_1 ={-}3/2\cos(30^{{\circ}}), & y_1= 0,\\ x_2 = 0, & y_2={-}3/4,\\ x_3 = 0, & y_3= 3/4. \end{array} \end{equation}
The computational domain  $\varOmega$ is discretized on an unstructured grid comprising 4225 triangles and 8633 nodes. The grid is optimized to provide a balance between computation speed and accuracy. Grid independence of the direct Navier–Stokes solutions has been established by Deng et al. (Reference Deng, Noack, Morzyński and Pastur2020).
The boundary conditions for the inflow, upper and lower boundaries are  $U_{\infty }=\boldsymbol {e}_x$ while a stress-free condition is assumed for the outflow boundary. The control of the fluidic pinball is carried out by the rotation of the cylinders. A non-slip condition is adopted on the cylinders: the flow adopts the circumferential velocities of the front, bottom and top cylinder specified by
 $b_1 = U_F$,
 $b_2 = U_B$ and
 $b_3 = U_T$. The actuation command comprises these velocities,
 $\boldsymbol {b} = [b_1,b_2,b_3]^\intercal$. A positive (negative) value of the actuation command corresponds to counter-clockwise (clockwise) rotation of the cylinders along their axis. The numerical integration of the Navier–Stokes equations is carried out by an in-house solver using a fully implicit finite-element method. The time integration is performed with an iterative Newton–Raphson-like approach. The chosen time step of 0.1 corresponds to about 1 % of the characteristic shedding period. The method is third-order accurate in time and space and employs a pseudo-pressure formulation. The solver has been employed in recent fluidic pinball investigations for reduced-order modelling (Noack et al. Reference Noack, Stankiewicz, Morzyński and Schmid2016; Deng et al. Reference Deng, Noack, Morzyński and Pastur2020) and for control (Ishar et al. Reference Ishar, Kaiser, Morzynski, Albers, Meysonnat, Schröder and Noack2019). We refer to Noack et al. (Reference Noack, Afanasiev, Morzyński, Tadmor and Thiele2003, Reference Noack, Stankiewicz, Morzyński and Schmid2016) for further information on the numerical method. The code is accessible on GitLab upon email request.
The initial condition for the numerical simulations is the symmetric steady solution. The symmetrical steady solution is computed with a Newton–Raphson method on the steady Navier–Stokes. An initial short and small rotation of the front cylinder is used to kick-start the transient to natural vortex shedding in the first period (Deng et al. Reference Deng, Noack, Morzyński and Pastur2020). This rotation has a circumferential velocity of  $+$0.5 at
 $t<6.25$ and of
 $-$0.5 at
 $6.25<t<12.5$. The transient regime lasts around 400 convective time units. Figure 1 shows the vorticity field for the symmetric steady solution and the natural unforced flow after 400 convective units. The snapshot at
 $t=400$ in figure 1(b) will be the initial condition for all the following simulations.
Vorticity fields for the unforced fluidic pinball at  $Re_D=100$. Blue (red) regions bounded by dashed lines represent negative (positive) vorticity. Darker regions indicate higher values of vorticity magnitude. (a) Symmetric steady solution, (b) unforced flow at
 $t=400$.

2.2. Flow characteristics
The fluidic pinball is a geometrically simple configuration that comprises key features of real-life flows such as successive bifurcations and frequency crosstalk between modes. Deng et al. (Reference Deng, Noack, Morzyński and Pastur2020) shows that the unforced fluidic pinball undergoes successive bifurcations with increasing Reynolds number before reaching a chaotic regime. The first Hopf bifurcation at Reynolds number  $Re\approx 18$ breaks the symmetry in the flow and initiates the von Kármán vortex shedding. The second bifurcation at Reynolds number
 $Re \approx 68$ is of a pitchfork type and gives rise to a transverse deflection of jet-like flow between the two rearward cylinders. The bistability of the jet deflection has been reported by Deng et al. (Reference Deng, Noack, Morzyński and Pastur2020). At a Reynolds number
 $Re = 100$, the jet deflection is rapid and occurs before the vortex shedding is fully established. Figure 2(a) shows an increase of the lift coefficient
 $C_L$ before oscillations set in and the lift coefficient converges against a periodic oscillation around a slightly reduced mean value. Those bifurcations are a consequence of multiple instabilities present in the flow: there are two shear instabilities, on the top and bottom cylinder, and a jet bistability originating from the gap between the two back cylinders. The shear-layer instabilities synchronize to a von Kármán vortex shedding.
Characteristics of the unforced natural flow starting from the steady solution ( $t=0$). The transient spans until
 $t \approx 400$. (a) Time evolution of the lift coefficient
 $C_L$, (b) phase portrait, (c) time evolution of the instantaneous cost function
 $j_a$ and (d) power spectral density (PSD) showing the natural frequency
 $f_0=0.116$ and its first harmonic. The phase portrait is computed during the post-transient regime
 $t \in [900,1400]$ and the PSD is computed over the last 1000 convective time units,
 $t \in [400,1400]$.

Figure 2 illustrates the dynamics of the unforced flow from the unstable steady symmetric solution to the post-transient periodic flow. The phase portrait in figure 2(b) and the power spectral density (PSD) in figure 2(d) show a periodic regime with frequency  $f_0=0.116$ and its harmonic. Figure 2(a) shows that the mean value of the lift coefficient
 $C_L$ is not null. This is due to the deflection of the jet behind the two rearward cylinders during the post-transient regime. During this regime, the deflection of the jet stays on one side as it is illustrated in figure 3(a–h) over one period and in figure 3(j) in the mean field. This deflection explains the asymmetry of the lift coefficient
 $C_L$. Indeed, the upward oriented jet increases the pressure on the lower part of the top cylinder leading to an increase of the lift coefficient. In figure 2(a) the initial downward spike on the lift coefficient is due to the initial kick. The unforced natural flow is our reference simulation for future comparisons.
Vorticity fields of the unforced flow. (a)–(f) Time evolution of the vorticity field in the last period of the simulation, (i) the objective symmetric steady solution and (j) the mean field of the unforced flow. The colour code is the same as figure 1. Here  $T_0$ is the natural period associated to the natural frequency
 $f_0$. The mean field has been computed by averaging the flow over 100 periods.

Thanks to the rotation of the cylinders, the fluidic pinball is capable of reproducing six actuation mechanisms inspired from wake stabilization literature and exploiting distinct physics. Examples of those mechanisms can be found in Ishar et al. (Reference Ishar, Kaiser, Morzynski, Albers, Meysonnat, Schröder and Noack2019). First, the wake can be stabilized by shaping the wake region more aerodynamically – also called fluidic boat tailing. Here, the shear layers are vectored towards the centre region with passive devices, such as vanes (Flügel Reference Flügel1930) or active control through Coanda blowing (Geropp Reference Geropp1995; Geropp & Odenthal Reference Geropp and Odenthal2000; Barros et al. Reference Barros, Borée, Noack, Spohn and Ruiz2016). In the case of the fluidic pinball we can mimic this effect by using counter-rotating rearward cylinders which accelerate the boundary layers and delay separation. This fluidic boat tailing is typically associated with significant drag reduction. Second, the two rearward cylinders can also rotate oppositely ejecting a fluid jet on the centreline. Thus, interaction between the upper and lower shear layer is suppressed, preventing the development of a von Kármán vortex in the vicinity of the cylinders. Such a base bleeding mechanism has a similar physical effect as a splitter plate behind a bluff body and has been proved to be an effective means for wake stabilization (Wood Reference Wood1964; Bearman Reference Bearman1967). Third, phasor control can be performed by estimating the oscillation phase and feeding it back with a phase shift and gain (Protas Reference Protas2004). Fourth, unified rotation of the three cylinders in the same direction gives rise to higher velocities, and, thus, larger vorticity, on one side at the expense of the other side, destroying the vortex shedding. This effect relates to the Magnus effect and stagnation point control (Seifert Reference Seifert2012). Fifth, high-frequency forcing can be effected by symmetric periodic oscillation of the rearward cylinders. With a vigorous cylinder rotation (Thiria et al. Reference Thiria, Goujon-Durand and Wesfreid2006), the upper and lower shear layers are re-energized, reducing the transverse wake profile gradients and, thus, the instability of the flow. Thus, the effective eddy viscosity in the von Kármán vortices increases, adding a damping effect. Sixth and finally, a symmetrical forcing at a lower frequency than the natural vortex shedding may stabilize the wake (Pastoor et al. Reference Pastoor, Henning, Noack, King and Tadmor2008). This is due to the mismatch between the anti-symmetric vortex shedding and the forced symmetric dynamics whose clock-work is distinctly out of sync with the shedding period. High- and low-frequency forcing lead to frequency crosstalk between actuation and vortex shedding over the mean flows, as described by the low-dimensional generalized mean-field model (Luchtenburg et al. Reference Luchtenburg, Günter, Noack, King and Tadmor2009).
The fluidic pinball is an interesting MIMO control benchmark. The configuration exhibits well-known wake stabilization mechanisms in physics. From a dynamical perspective, nonlinear frequency crosstalk can easily be enforced. In addition, even long-term simulations can easily be performed on a laptop within an hour.
2.3. Control objective and optimization problem
Several control objectives related to the suppression or reduction of undesired forces can be considered for the fluidic pinball. We can reduce the net drag power, increase the recirculation bubble length, reduce lift fluctuations or even mitigate the total fluctuation energy.
In this study we aim to stabilize the unstable steady symmetric Navier–Stokes solution at  $Re_D=100$. The associated objectives are
 $J_a$, quantifying the closeness to the symmetric steady solution and
 $J_b$, the actuation power. The cost
 $J_a$ is defined as the temporal average of the residual fluctuation energy of the actuated flow field
 $\boldsymbol {u}_{\boldsymbol {b}}$ with respect to the symmetric steady flow
 $\boldsymbol {u}_s$,
 \begin{equation} J_a=\frac{1}{T_{ev}}\int_{t_0}^{t_0+T_{ev}} j_a(t) \,\mathrm{d} t, \end{equation}
with the instantaneous cost function
 \begin{equation} j_a(t) =\Vert \boldsymbol{u}_{\boldsymbol{b}}(t)-\boldsymbol{u}_s \Vert_\varOmega^2 \end{equation}
based on the  $L_2$-norm
 \begin{equation} \Vert \boldsymbol{u} \Vert_\varOmega = \sqrt{ \iint_{\varOmega} {u}^2 + {v}^2\,\mathrm{d} \boldsymbol{x}}. \end{equation}
The control is activated at  $t_0=400$ convective time units after the starting kick on the steady solution. Thus, we have a fully established post-transient regime. The cost function is evaluated until
 $T_{ev}=1400$ convective time units. Thus, the time average is effected over 1000 convective time units to make sure that the transient regime has far less weight as compared with the actuated regime. Yet, a faster stabilizing response to actuation is clearly desirable and factors positively into the cost.
Here  $J_b$ is naturally chosen as a measurement of the actuation energy investment. Evidently, a low actuation energy is desirable. The actuation power is computed as the power of the torque applied by the fluid on the cylinders. Here
 $J_b$ is the time-averaged actuation power over
 $T_{ev} = 1000$ time units,
 \begin{equation} J_b(\boldsymbol{b})=\frac{1}{T_{ev}}\int_{t_0}^{t_0+T_{ev}} \sum_{i=1}^{3}\mathcal{P}_{act,i} \,\mathrm{d} t, \end{equation}
where  $\mathcal {P}_{act,i}$ is the actuation power supplied integrated over cylinder
 $i$,

where  $( F^{\theta }_{s,i} \,\mathrm {d}s )$ is the azimuthal component of the local fluid forces applied to cylinder
 $i$. The negative sign denotes that the power is supplied and not received by the cylinders. The numerical value of
 $J_b$ may be compared with the unforced drag coefficient
 $c_D=3.75$ which is also the non-dimensionalized parasitic drag power.
In this study optimization is based on the cost function  $J=J_a$ and the actuation investment
 $J_b$ is evaluated separately. We refrain from a cost function
 $J$ which employs the objective function
 $J_a$ and penalizes the actuation investment
 $J_b$ with suitable weight
 $\gamma$, i.e.
 $J = J_a + \gamma J_b$. The procedure has three reasons. First, the distance between two flows and actuation energy belong to two different worlds, kinematics and dynamics. Any choice of the penalization parameter
 $\gamma$ will be subjective and implicate a sensitivity discussion. Moreover, a strong penalization would constrain the search space and may rule out relevant actuation mechanisms. In this study we look for stabilization mechanisms rather than the most power-efficient solutions. Second, the complete stabilization of the steady solution would lead to a vanishing actuation
 $\boldsymbol {b} \equiv 0$ and, thus, vanishing energy
 $J_b$. Thus, the optimization problem without actuation energy can be expected to be well posed. Third, a Pareto front of
 $J_a$,
 $J_b$ reveals how much actuation power is required for which closeness to the steady solution. Using Pareto optimality, there is no need to decide in advance on the subjective weight
 $\gamma$. Foreshadowing the results, the best performance
 $J_a$ turns out to be achieved with the least actuation energy
 $J_b$. This result corroborates a posteriori the decision not to include actuation energy in the cost.
The instantaneous cost function  $j_a$ of the unforced flow is shown in figure 2(c). We notice a slight overshoot around
 $t=200$ before converging to a post-transient fluctuating regime. The post-transient regime shows the expected periodic behaviour from von Kármán vortex shedding. The cost averaged over 1000 convective time units is
 $J_0=39.08$ and serves as reference to actuation success.
To reach the steady symmetric solution, the flow is controlled by the rotation of the three cylinders. The actuation command  $\boldsymbol {b}=[b_1,b_2,b_3]^\intercal$ is determined by the control law
 $\boldsymbol {K}$. This control law may operate open loop or closed loop with flow input. Considered open-loop actuations are a steady or harmonic oscillation around a vanishing mean. Considered feedback includes velocity sensor signals in the wake. Thus, in the most general formulation, the control law reads as
 \begin{equation} \boldsymbol{b}(t)=\boldsymbol{K}(\boldsymbol{h}(t), \boldsymbol{s}(t)), \end{equation}
with  $\boldsymbol {h}(t)$ and
 $\boldsymbol {s}(t)$ being vectors comprising respectively time-dependent harmonic functions and sensor signals. The sensor signals include the instantaneous velocity signals as well as three recorded values over one period as elaborated in § 4.3. In the following,
 $N_b$ represents the number of actuators,
 $N_h$ the number of time-dependent functions and
 $N_s$ the number of sensor signals. Then the optimal control problem determines the control law which minimizes the cost
 \begin{equation} \boldsymbol{K}^* = \underset{\boldsymbol{K}\in \mathcal{K}}{\operatorname{arg\,min}} \; J(\boldsymbol{K}), \end{equation}
with  $\mathcal {K}:X \mapsto Y$ being the space of control laws. Here,
 $X$ is the input space, e.g. the space of sensor signals, and
 $Y$ is the space of all possible outputs. In general, (2.9) is a challenging non-convex optimization problem.
3. Control optimization framework
In this section we present the control optimization for stabilizing the fluidic pinball. This constitutes a challenging nonlinear non-convex optimization problem in which the possibility of several local minima must be expected. Hence, we specifically address how to explore new minima while keeping the convergence rate and efficiency of gradient-based approaches. In § 3.1 the principles of exploration and exploitation are discussed for parameter and control law optimization. Then, the employed algorithms are described: the explorative gradient method (EGM) for parametric optimization (§ 3.2) and the gradient-enriched machine learning control (gMLC) for control law optimization (§ 3.3).
3.1. Optimization principles – exploration vs exploitation
The two algorithms, EGM and gMLC, enable model-free control optimization. These algorithms combine the advantages of exploitation and exploration. Exploitation is based on a downhill simplex method with the best performing of all tested control laws, also called ‘individuals’. The goal is to ‘slide down’ the best identified minimum.
Exploration is performed with another algorithm using all previously tested individuals. The goal is to find potentially new and better minima, ideally the global minimum. The method for exploration depends on the search space. For a low-dimensional parameter space, a space-filling version of the Latin hypercube sampling (LHS) guarantees optimal geometric coverage of the search space. For a high-dimensional function space, genetic programming is found to be efficient.
The EGM and gMLC start with an initial set of individuals to be evaluated. Then, exploitive and explorative phases iterate until a convergence criterion is reached. The iteration hedges against several worst-case scenarios. The control landscape may have only a single minimum accessible from any other point by steepest descend. In this case, exploration is often inefficient, although it might help in avoiding slow marches through long shallow valleys (Li et al. Reference Li, Cui, Jia, Li, Yang, Morzyński and Noack2020). The control landscape may also have many minima accessible by gradient-based searches. In this case, exploitation is likely to incrementally improve performance in suboptimal minima and the search strategy should have a significant investment in exploration. The minima of the control landscape may also have narrow basins of attractions for gradient-based iterations and extended plateaus. This is another scenario where iteration between exploitation and exploration is advised.
Many optimizers balance exploration and exploitation and gradually shift from the former to the latter. This strategy sounds reasonable but is not a good hedge against the described worst-case scenarios where almost all exploitative or almost all explorative algorithms are doomed to fail.
Note that the chances of exploration landing close to a new better minimum are small. Yet, the explorative phases may find new basins of attractions for successful gradient-based descents. This is another argument for the alternating execution of exploration and exploitation.
Finally, we note that the proposed explorative–exploitive schemes allows both kinds of iterations to be adjusted to the control landscape. For instance, LHS in a high-dimensional search space will initially explore only the boundary and may better be replaced by Monte Carlo or a genetic algorithm. We refer to Li et al. (Reference Li, Cui, Jia, Li, Yang, Morzyński and Noack2020) for a thorough comparison of EGM and five common optimizers and to Duriez, Brunton & Noack (Reference Duriez, Brunton and Noack2016) for GPC. The next two sections detail both optimizers, EGM and gMLC.
3.2. Parameter optimization with the EGM
The EGM optimizes  $N_p$ parameters
 $\boldsymbol {b} = [ b_1, \ldots , b_{N_p} ]^\intercal$ with respect to cost
 $J(\boldsymbol {b})$ and comprises exploration and exploitation phases. In the context of parameter optimization, we do not differentiate between the control law
 $\boldsymbol {K}=\text {const.}$ and the associated actuation command
 $\boldsymbol {b}=\boldsymbol {K}$. The search space, or actuation domain, is a compact subset
 $\mathcal {B}$ of
 $\mathbb {R}^{N_p}$, typically defined by upper and lower bounds for each parameter. The exploration phase is based on a space-filling variant of LHS (McKay, Beckman & Conover Reference McKay, Beckman and Conover1979) whereas the exploitation phase is carried out by Nelder–Mead's downhill simplex (Nelder & Mead Reference Nelder and Mead1965).
The first  $N_p+1$ initial individuals
 $\boldsymbol {b}_m$,
 $m=1,\ldots , N_p+1$ define the first ‘amoeba’ of the downhill simplex method. The first individual
 $\boldsymbol {b}_1$ is typically placed at the centre of
 $\mathcal {B}$. The
 $N_p$ remaining vertices are slightly displaced along the
 $b_m$ axes. In other words,
 $\boldsymbol {b}_m = \boldsymbol {b}_1 + h_m \boldsymbol {e}_{m-1}$ for
 $m=2, \ldots , N_p+1$. Here,
 $\boldsymbol {e}_m := [ \delta _{m,1},\ldots ,\delta _{m,N_p} ]^\intercal$ is the unit vector in the
 $m$th direction and
 $h_m$ is the corresponding step size. The increment
 $h_m$ is chosen to be small compared with the range of the corresponding dimension.
The exploitation phase employs the downhill simplex method. This method is robust and widely used for data-driven optimization in low- and moderate-dimensional search spaces that require neither analytical expression of the cost function nor local gradient information. The new individual is a linear combination of the simplex individuals and follows a geometric reasoning. The vertex with the worst performance is replaced by a point reflected at the centroid of the opposite side of the simplex. This step leads to a mirror-symmetric version of the simplex where the new vertex has the best performance if the cost function depends linearly on the input. Subsequent operations like expansion, single contraction and global shrinking ensure that iterations exploit a favourable downhill behaviour and avoid getting stuck by nonlinearities. We refer to Li et al. (Reference Li, Cui, Jia, Li, Yang, Morzyński and Noack2020) for a detailed description.
The explorative phase of EGM is inspired by the LHS method. Latin hypercube sampling aims to fill the complete domain  $\mathcal {B}$ optimally. The predefined number
 $m$ of individuals maximizes the minimum distance of its neighbours,
 \begin{equation} \{ \boldsymbol{b}^{LHS}_1, \ldots, \boldsymbol{b}^{LHS}_m \}:= \underset{\boldsymbol{b}_1,\ldots,\boldsymbol{b}_m \in \mathcal{B}}{\arg \max}\, \min_{i \in \{ 1, \ldots, m-1 \}, \atop j \in \{ i +1, \ldots, m \}} \Vert \boldsymbol{b}_i - \boldsymbol{b}_j \Vert . \end{equation}
Here,  $\Vert \cdot \Vert$ denotes the Euclidean norm. The number of individuals has to be determined in advance and cannot be augmented. This static feature is incompatible with the iterative nature of the EGM algorithm. Thus, we resort to a recursive ‘greedy’ version. Let
 $\boldsymbol {b}^{\bullet }_1$ be the first individual. Then,
 $\boldsymbol {b}^{\bullet }_2$ maximizes the distance from
 $\boldsymbol {b}^{\bullet }_1$,
 \begin{equation} \boldsymbol{b}^{{\bullet}}_2 := \underset{\boldsymbol{b} \in \mathcal{B}}{\arg \max} \,\Vert \boldsymbol{b} - \boldsymbol{b}^{{\bullet}}_1 \Vert . \end{equation}
The  $m$th individual maximizes the minimum distance to all previous individuals,
 \begin{equation} \boldsymbol{b}^{{\bullet}}_m := \underset{\boldsymbol{b} \in \mathcal{B}}{\arg \max}\, \min_{i \in \{ 1, \ldots, m-1 \}} \Vert \boldsymbol{b} - \boldsymbol{b}^{{\bullet}}_i \Vert . \end{equation}
This recursive definition allows for adding explorative phases from any given set of individuals.
Exploitation and exploration are iteratively continued until the stopping criterion is reached. In our study, the stopping criterion is the total number of cost function evaluations, i.e. a given budget of simulations. This criterion is validated after the run by checking the convergence of the performance. The EGM phases are summarized in algorithm 1.
Explorative Gradient Method

3.3. Multiple-input multiple-output control optimization with gMLC
In this section we cure a challenge of linear GPC – the suboptimal exploitation of gradient information. Starting point is machine learning control (MLC) based on linear genetic programming (LGP). Machine learning control optimizes a control law without assuming a polynomial or other structure of the mapping from input to output. The only assumption is that the law can be expressed by a finite number of mathematical operations with a finite memory, i.e. is computable. The optimization process relies on a stochastic recombination of the control laws, also called evolution. Machine learning control has been amazingly efficient in outperforming existing optimal control laws – often with surprising frequency crosstalk mechanisms – in dozens of experiments (Noack Reference Noack2019). Machine learning control demonstrates a good exploration of actuation mechanisms but a slow convergence to an optimum despite an increasing testing of redundant similar control laws.
The proposed gMLC departs in two aspects from MLC. First, the concept of evolution from generation to generation is not adopted. The genetic operations include all tested individuals. One can argue that the neglection of previous generations might imply loss of important information. Second, the exploitation is accelerated by downhill subplex iteration (Rowan Reference Rowan1990). The best  $k+1$ individuals are chosen to define a
 $k$-dimensional subspace and a downhill simplex algorithm optimizes the control law in this subspace.
Machine learning control and gMLC share a representation of the control laws used for LGP (Brameier & Banzhaf Reference Brameier and Banzhaf2006). The individuals are considered as little computer programs, using a finite number  $N_{inst}$ of instructions, a given register of variables and a set of constants. The instructions employ basic operations (
 $+$,
 $-$,
 $\times$,
 $\div$,
 $\cos$,
 $\sin$,
 $\tanh$, etc.) using inputs (
 $h_i$ time-dependent functions and
 $s_i$ sensor signals) and yielding the control commands as outputs. A matrix representation conveniently comprises the operations of each individual. Every row describes one instruction. The first two columns define the register indices of the arguments, the third column the index of the operation and the fourth column the output register. Before execution, all registers are zeroed. Then, the first registers are initialized with the input arguments, while the output is read from the last registers after the execution of all instructions. This leads to a
 $N_{inst}\times 4$ matrix representing the control law
 $\boldsymbol {K}$. We refer to Li et al. (Reference Li, Noack, Cordier, Borée, Kaiser and Harambat2018) for details.
The algorithm begins with a Monte Carlo (MC) initialization of  $N_{MC}$ individuals, i.e. the indices of the matrix. The cost of these randomly generated functions are evaluated in the plant. The number of individuals
 $N_{MC}$ needs to balance exploration and cost. Too few individuals may lead to descent into a suboptimal local minimum. Too many individuals may lead to unnecessary inefficient testing, as Monte Carlo sampling is purely explorative.
Once the initial individuals are evaluated, an exploration phase is carried out. New individuals are generated thanks to crossover and mutation operations. Thus, this phase is also referred to as the evolution phase. These operations are performed on the matrix representation of the individuals. As for MLC, crossover combines two individuals by exchanging lines in their matrix representation, whereas mutation randomly replaces values of some lines by new ones. In this approach, we no longer consider a population but the database of all the individuals evaluated so far. Thus, we no longer need the replication and elitism operators of MLC. This choice is justified by the fact that we want to learn as much as possible from what we already know and avoid re-evaluating individuals. To perform the crossover and mutation operation, individuals are selected from the database thanks to a tournament selection. A tournament selection of size 7 for a population of 100 individuals is used in Duriez et al. (Reference Duriez, Brunton and Noack2016). That means that for a population of 100 individuals, 7 individuals are selected randomly and among the 7, the best one is chosen for the crossover or mutation operation. For gMLC, as the individuals are selected among all the evaluated individuals, the tournament size is properly scaled at each call to preserve the  $7/100$ ratio between the tournament size and the size of the database. The crossover and mutation operation are repeated randomly following
 $P_c$, the crossover probability, and
 $P_m$, the mutation probability, until
 $N_G$ individuals are generated. The probabilities
 $P_c$ and
 $P_m$ are such that
 $P_m+P_c=1$.
Once the evolution phase is achieved,  $N_G$ new individuals are generated thanks to downhill subplex iterations. Being in an infinite dimension function space, Nelder–Mead's downhill simplex is impractical as an exploitation tool. Thus, we propose a variant of downhill simplex inspired by Rowan (Reference Rowan1990), commonly called downhill subplex. Just as downhill simplex, the strength of this approach is to exploit local gradients to explore the search space. In the original approach of Rowan (Reference Rowan1990), downhill simplex is applied to several orthogonal subspaces. However, in order to limit the number of cost function evaluations, we apply downhill simplex to only one subspace. This subspace is initialized by selecting
 $N_{sub}$ individuals. Two ways to build the subspace after the Monte Carlo process are listed below.
• Choose the best individual: select the best
 $N_{sub}$ individuals evaluated so-far in the whole database.
• Individuals near a minimum: select the best individual evaluated so-far and the
$N_{sub}-1$ individuals closest to the best one.


The first approach has the benefit of comprising of several minima candidates, whereas the second one is bound to lead to a minimum in the neighbourhood of the best individual and relies on a given metric. Once the subspace is built, the next steps are similar to the downhill simplex method. As subplex and simplex are essentially the same algorithm applied to different spaces, we will not designate them differently.
Following the situation, downhill subplex may call  $1$ (only reflection),
 $2$ (expansion or single contraction) or
 $N_{sub}+1$ (shrink) times the cost function. Several iterations of downhill subplex are repeated until at least
 $N_G$ individuals are generated. In this study the same number of individuals generated with the evolution phase and the downhill subplex phase are chosen to balance exploration and exploitation.
If the stopping criterion is reached, the most efficient individual in the database is given back. Otherwise, we restart a new cycle by generating new individuals with a new evolution phase, combining and modifying individuals derived by evolution and downhill subplex. However, the individuals built thanks to downhill subplex are a linear combination of the original  $N_{sub}$ individuals. These new individuals do not have a matrix representation which is necessary to generate new individuals with genetic operators in the exploitation phase. To overcome this problem, we introduce a new phase to compute a matrix representation for the linearly combined control laws. The matrix representation is computed by solving a regression problem of the first kind, similar to a function fitting problem, for all the linearly combined control laws. First, each control law
 $\boldsymbol {K}_i$ is evaluated on randomly sampled inputs
 $\boldsymbol {s}_{rand}$. The resulting output
 $\boldsymbol {K}_i (\boldsymbol {s}_{rand})$ is used to solve a secondary optimization problem,
 \begin{equation} \boldsymbol{K}_{\boldsymbol{M}}^{\boldsymbol{*}} = \underset{\boldsymbol{K}_{\boldsymbol{M}}}{\operatorname{arg\,min}} \; \Vert (\boldsymbol{K}_{\boldsymbol{M}}(\boldsymbol{s}_{rand})-\boldsymbol{K}_i (\boldsymbol{s}_{rand}))\Vert^2, \end{equation}
where  $\Vert \cdot \Vert$ denotes the Euclidean norm. This optimization problem is a function fitting problem that we solve with LGP. The LGP parameters are the same as those used for the gMLC so the computed individuals are compatible with the ones in the database. The best fitting control law
 $\boldsymbol {K}_{\boldsymbol {M}}^\ast$ then has a matrix representation and is used as a substitute for the original linear combination of control laws. The substitutes are then employed for the evolution phase even though they may not be perfect substitutes of the original control laws. Indeed, following the stopping criterion and population size of the secondary LGP optimization, the control law substitutes may not be able to reproduce all the characteristics of the linearly combined control laws. An accurate but costly representation may not be needed as the control laws will be recombined afterwards. Moreover, the introduction of some error may be beneficial to improve the exploration phase and enrich our database.
Gradient-enriched MLC

Once the matrix representations are computed, a new cycle may begin with a new evolution phase. In this phase, if any individual has a better performance than the  $N_{sub}$ individuals in the simplex then the least performing individuals among the
 $N_{sub}$ individuals are replaced. Thus, each evolution phase replaces elements in the simplex, allowing exploration beyond the initial subspace. Then, the optimization continues with the exploitation phase on the updated
 $N_{sub}$ individuals.
Figure 4 illustrates the initialization, exploration and exploitation of gMLC. The exploration is based on LGP. Also the exploitation requires LGP. In the downhill simplex method the individuals are linear combinations of the subplex basis and are finally approximated as matrices. This process is repeated until the stopping criterion is reached. The gMLC is summarized by pseudo code in algorithm 2. The source code is freely available at https://github.com/gycm134/gMLC. Finally, figure 5 summarizes the exploration and exploitation phases for EGM and gMLC.
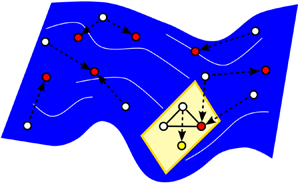
Schematic of the gMLC algorithm (b) and distribution of individuals in the search space (a). First (1), Monte Carlo initialization performs a first coarse exploration of the search space. Second (2), further exploration is performed thanks to genetic programming. Individuals are selected in the whole dataset and combined thanks to genetic operators to generate new individuals (blue dots). Then the database is augmented with the new individuals. Third (3), exploitation focuses on a subspace (represented in yellow) of finite dimension where downhill simplex iterations builds new individuals by linear combination (yellow dots). A matrix representation is computed for the downhill subplex individuals thanks to LGP, allowing the downhill subplex individuals to be included in the database.

Summary of the EGM (left column) and gMLC (right column). The level plots are a schematic representation of the control landscape. Darker regions depict poor performances and light regions depict good performances. Three minima are shown, two on the top left and the global one on the top right. The map represents an affine space (of finite dimension) for EGM and a Hilbert function space for gMLC. The initialization step is depicted with black diamonds for EGM and black dots for gMLC. The individuals generated thanks to an exploration phase are represented by blue dots. Exploration is carried out with LHS for EGM and evolution with genetic operators (crossover and mutation) for gMLC. The individuals generated thanks to an exploitation phase are represented in yellow. For EGM, downhill simplex steps are carried out. The associated level plot depicts one iteration of downhill simplex: the reflected individual (yellow triangle) and the expanded individual (reversed yellow triangle), the star is the centroid of the two best black diamonds. For gMLC, the simplex steps are carried out in a subspace (downhill subplex) of finite dimension. The associated level plot depicts two distinct simplex steps: first, a reflection step (yellow triangle) with the two best black dots and the best blue dot; then a contraction step (yellow diamond) with the same black dots and the newly evaluated yellow triangle. The stars are the centroids for each step. This process is repeated until the stopping criterion is reached. In this figure only one iteration of the loop is depicted. The reconstruction phase is not depicted for the sake of clarity.

4. Flow stabilization
In this section we stabilize the fluidic pinball with optimized control laws in increasingly more general search spaces. First (§ 4.1), we consider symmetric steady actuation with a parametric study reduced to one parameter  $b_2=-b_3=\text {const}$. Then (§ 4.2), we optimize steady actuation allowing also for non-symmetric forcing, i.e. three independent inputs
 $b_1$,
 $b_2$,
 $b_3$. Finally (§ 4.3), we optimize sensor-based feedback from nine downstream sensor signals driving the three cylinder rotations. Evidently, the three search spaces are successive generalizations.
4.1. Symmetric steady actuation – parametric study
This section describes the behaviour of the fluidic pinball under a symmetric steady actuation. In this configuration only the two rearward cylinders rotate at equal but opposite rotation speeds,  $b_2=-b_3$. When
 $b_2$ is positive, the rearward cylinders accelerate the outer boundary layers and suck near-wake fluid upstream. This forcing delays separation, mimics Coanda forcing and leads to a fluidic boat tailing. When
 $b_2$ is negative, the cylinders eject fluid in the near wake as in base bleed and oppose the outer boundary-layer velocities. Figure 6 shows the evolution of
 $J_a/J_0$ (a),
 $J_b$ (b) and the bifurcation diagram (c) as a function of
 $b_2$.
Parametric study for symmetric steady forcing. The velocity of the bottom cylinder is  $b_2=-b_3$. The normalized distance to the steady solution
 $J_a/J_0$ (a) and the actuation power
 $J_b$ (b) are plotted as a function of
 $b_2$. The bifurcation diagram (c) comprises all local maximum and minimum lift values. The vertical red dashed line corresponds to
 $b_2=0$ and separates the base bleeding and the boat tailing configurations. The global minimum of
 $J_a/J_0$ is reached at
 $b_2=-0.375$, as indicated by a vertical blue dashed line.

We limited our study to  $b_2 \in [-5, 6]$. The trends are resolved with a discretization step of
 $0.25$ and a finer resolution in the ranges
 $[-2.5,0]$ and
 $[1,2]$. For each parameter, the cost
 $J_a$ and actuation power
 $J_b$ have been computed over 1000 convective time units. The bifurcation diagram has been built by detecting the extrema of the lift coefficient over the last 600 convective time units. The bifurcation diagram reveals the following five regimes.
• Regime
$b_2<-4$: the lift amplitude decreases to zero and the cost decreases to the first minimum.• Regime
$-4<b_2<-2.5$: the extremal lift values increase and decrease to zero again. The cost approaches another local minimum near $b \approx -2.5$.• Regime
$-2.54<b_2<0$: a period doubling cascade is observed for decreasing $b_2$ leading to a chaotic regime. At $b_2 \approx 0.375$, the cost assumes its global minimum with residual fluctuation of the lift coefficient.• Regime
$0<b_2<2.375$: the cost and the extremal lift values monotonically increase.• Regime
$2.375<b_2$: the Coanda forcing completely stabilizes a symmetric steady solution. The cost increases with the rotation speed.


Interestingly, the boat tailing discontinuity at  $b_2=2.375$ does not appear in the graph of the cost function
 $J_a/J_0$. This continuity, even in the derivative, corresponds to a continuous passage from a periodic symmetrical solution to a stationary solution which is itself symmetrical. As the value of the cost function indicates, this stationary solution is quite far from the unforced symmetric steady solution. The global minimum of
 $J_a/J_0=0.51$ is reached near
 $b_2=-0.375$, i.e. for a base bleeding configuration, corresponding to a small actuation power
 $J_b= 0.0490$, roughly 0.1 % of the unforced cost
 $J_0$.
The characteristics of the best base bleeding solution leading closest to the symmetric steady solution are depicted in figure 7. In figure 7(a) the lift coefficient is displayed for the unforced transient (blue curve) and the forced flow (red curve). The unforced flow terminates in an asymmetric shedding with positive lift values. After the start of forcing, the lift coefficient oscillates vigorously around its vanishing mean value. This forced statistical symmetry is corroborated by the oscillating jet in figure 8(a–h). Base bleeding increases the velocity of the rearward jet compared with the unforced flow. This jet instability mitigates the Coanda effect on the bottom and top cylinder, i.e. the jet neither stays long at either side.
Characteristics of the best base bleeding solution. (a) Time evolution of the lift coefficient  $C_L$, (b) phase portrait, (c) time evolution of instantaneous cost function
 $j_a$ and (d) PSD showing a broad spectral peak at
 $f_1=0.132$. The control starts at
 $t=400$. The unforced phase is depicted in blue and the forced one in red. The phase portrait is computed over
 $t \in [900,1400]$ and the PSD is computed on the forced regime
 $t \in [400,1400]$.

Vorticity fields of the best base bleeding solution. (a–f) Time evolution of the vorticity field throughout the last period of the 1400 convective time units, (i) the objective symmetric steady solution and (j) the mean field of the forced flow. The colour code is the same as figure 1. Here  $T_1$ is the period associated to the main frequency
 $f_1$ of the forced flow. The mean field has been computed by averaging 100 periods.

The vortex shedding persists similar to the unforced flow. However, the dominant frequency is increased from  $f_0=0.116$ to
 $f_1=0.132$. The instantaneous cost function
 $j_a$ in figure 7(c) shows an unsteady non-periodic behaviour, reaching intermittently low levels. The broad spectral peak in figure 7(d) is a characteristic of a chaotic regime. The phase portrait in figure 7(b) corroborates the non-periodic oscillatory behaviour. The mean field in figure 8(j) shows that the actuated mean jet is symmetric unlike the mean field of the unforced flow. Moreover, the shear layer on the upper and lower sides extends further downstream as compared with the unforced state.
This parametric study reveals that base bleeding is the best symmetric steady forcing strategy to bring the flow close to the symmetric steady solution. However, even though the cost  $J_a/J_0$ is almost halved, the best base bleeding control fails to stabilize the flow.
4.2. General non-symmetric steady actuation – EGM
In this section we aim to stabilize the symmetric steady solution by commanding the three cylinders with constant actuation without symmetry constraint. This three-dimensional parameter space is explored with the EGM presented in § 3.2. The symmetry along the  $x$-axis of the fluidic pinball allows us to reduce our search space and to explore only positive values of
 $b_1$. A coarse initial parametric study carried out on
 $b_1$,
 $b_2$ and
 $b_3$ by steps of unity indicates that the global minimum of
 $J_a/J_0$ should be near
 $[b_1,b_2,b_3]^\intercal = [1,0,0]^\intercal$. Thus, we limit our research to the actuation domain
 $\mathcal {B} = [0,2]\times [-2,2]\times [-2,2]$. The limitation of
 $b_1$ to positive values exploits the mirror symmetry of the configuration. Figure 9(b) depicts the cost function in the actuation domain
 $\mathcal {B}$. Three planes (
 $b_1=\text {const.}$) are computed by interpolating parameters on a coarse grid. The individuals computed with EGM are all shown in the three-dimensional space. The four initial control laws for EGM are the centre of the box and shifted points from this centre. The shift is
 $10\,\%$ of the box size in the positive coordinate direction. Thus, the four initial control laws are
 $[1,0,0]^\intercal$,
 $[1.2,0,0]^\intercal$,
 $[1,0.4,0]^\intercal$ and
 $[1,0,0.4]^\intercal$. The exploration phase is then performed in
 $\mathcal {B}$. For algorithmic reasons, the explorative points are chosen from one million points obtained from a space-filling LHS. In the following,
 $N_i$ denotes the number of evaluations. The optimization processes stops after
 $N_i=100$ evaluations. This corresponds to 25 iterations of the exploration/exploitation process. Convergence is already reached around
 $N_i \approx 50$. On one hand, we notice that the exploration phases (LHS in blue) focus on the boundary of the search space. This is consistent with the goal of LHS, as the furthest initial individuals are on the boundary of the box. On the other hand, the exploitation phases (simplex in yellow) stay in the same neighbourhood near the initial individuals, crawling along the local gradient to find the minimum.
Contour map of  $J_a/J_0$ at the optimal plane
 $b_3=b^{EGM}=-0.156$ found with EGM (a) and at different levels of
 $b_1$:
 $b_1=0$,
 $b_1=1$,
 $b_1=2$ (b). The colour code denotes white for
 $J_a/J_0=1$, blue for better performances and red for worse performances. The planes are shown with
 $75\,\%$ transparency. The four initial conditions
 $[1,0,0]^\intercal$,
 $[1.2,0,0]^\intercal$,
 $[1,0.4,0]^\intercal$ and
 $[0,0,0.4]^\intercal$ are represented by black diamonds. Blue dots are the control laws built with the exploration phases and yellow dots are the individuals built with the exploitation phases. All the individuals have been projected on the plane
 $b_3=-0.156$. The arrows, on plane
 $b_1=0$, depict the base bleeding/boat tailing diagonal studied in § 4.1. A parametric study shows that the minimum is close to
 $[b_1,b_2,b_3]^\intercal =[1,0,0]^\intercal$ whose cost is
 $J_a/J_0$=0.93.

Figure 10 shows the progression of the best control laws throughout the evaluations after 25 iterations of the exploration/exploitation process. The progression is plotted according to the number of cost function evaluations counted with the dummy index  $i$. Figure 10(a) depicts the progression of the best control law after each downhill simplex step. We notice that a plateau is reached after 50 evaluations and there are only small variations afterwards. The final control law after 100 evaluations reads as
 \begin{equation} [b^{EGM}_1,b^{EGM}_2,b^{EGM}_3]^\intercal = [1.11207,-0.20025,-0.15588]^\intercal \quad \text{with} \ J_a=10.85. \end{equation}
Evolution of  $b_1$,
 $b_2$ and
 $b_3$ (a) for each new simplex step indicated by the scattered squares and
 $J_a/J_0$ (b) according to the number of evaluations
 $i$ for the EGM optimization process. The red line on (b) shows the evolution of the best cost. The colour code of the dots on (b) is the same as figure 9. The best control law is
 $[b_1^{EGM},b_2^{EGM},b_3^{EGM}]^\intercal = [1.11207,-0.20025,-0.15588]^\intercal$ with
 $J_a/J_0=0.28$.

From visualizations of the control landscape of  $J_a$ in figure 9, we can safely infer that (4.1) describes the global minimum of our search space. Figure 10(b) shows convergence after 70 evaluations. Thereafter, the downhill simplex iterations show negligible improvements. In the whole EGM optimization the exploration appears to be ineffective as the initial individuals are close to the minimum. An EGM run with different initial individuals (
 $[1,0,0]^\intercal$,
 $[1.5,0,0]^\intercal$,
 $[1,1,0]^\intercal$ and
 $[1,0,1]^\intercal$, corresponding to a
 $25\,\%$ of the box size shift) have been tested. After a few iterations, this new run started sliding down towards the same minimum. This can be explained by the fact that the neighbourhood around the minimum is smooth enough for a downhill slide of the exploitation individuals.
The control law (4.1) shows that the front cylinder rotates almost five times faster than the two other cylinders and in opposite directions. The asymmetry in the control law corresponds to the asymmetry in the lift coefficient in figure 11(a), where the mean value is close to  $-$0.7. The flow asymmetry can be visualized in the mean field (figure 12j). The vorticity in the vicinity of the cylinder is directly related to the actuation; thus, the upward deflection near the front cylinder is explained by its fast rotation, around 1.1 times the incoming velocity. In addition, the tip of the positive vorticity lobe in the jet is slightly deflected downwards. Figures 12(a)–12(h) show that EGM control (4.1) enables a jet fluctuation around the vanishing mean, like the best base bleeding solution. Moreover, the phase portrait and the PSD in figure 11 reveal that the flow is purely harmonic. The main frequency
 $f_2=0.140$ is close to the main frequency
 $f_1= 0.132$ of the base bleeding solution. Contrary to the best base bleeding solution, the instantaneous cost function
 $j_a$ stays at low levels with a mean value around 9. The associated normalized cost is
 $J_a/J_0= 0.28$. It is worth noting that, even though the control law
 $[b_1,b_2,b_3]^\intercal =[1,0,0]^\intercal$ is close to the best one found with EGM, its cost,
 $J_a/J_0 =0.93$, is much higher. Moreover, the coarse description of the optimal plane
 $b_3=b^{EGM}=-0.15588$ in figure 9(a) does not show any minimum a priori. This reveals large gradients in the control landscape, near the EGM solution, where a small change in the control amplitude can drastically change the associated cost
 $J_a/J_0$.
Characteristics of the best steady actuation found by EGM. (a) Time evolution of the lift coefficient  $C_L$, (b) phase portrait, (c) time evolution of instantaneous cost function
 $j_a$ and (d) PSD showing the only frequency
 $f_2=0.140$ of the forced flow. The control starts at
 $t=400$. The unforced phase is depicted in blue and the forced one in red. The phase portrait and the PSD are computed over
 $t \in [900,1400]$ the post-transient regime.

Vorticity fields of the best steady actuation found with EGM. (a–f) Time evolution of the vorticity field throughout the last period of the 1400 convective time units, (i) the objective symmetric steady solution and (j) the mean field of the forced flow. The colour code is the same as figure 1. Here  $T_2$ is the period associated to the frequency
 $f_2$ of the forced flow. The mean field has been computed by averaging over 100 periods.

In addition to the less deflected jet, we notice in figure 12 that the vortex shedding differs from the previous solution leading to a more symmetric flow. There are now two vortex sheddings of the shear layers, one on the upper side and one on the lower side of the flow. These shear-layer dynamics hardly interact in the whole domain. Indeed, we notice that the distance between two consecutive vortices increases significantly only before leaving the computational domain which goes along with a slightly upward deflection of the wake. This results in extended vorticity branches in the mean field (figure 12j) but with a lower vorticity level compared with the symmetric steady solution.
As expected, exploring a richer search space improved the stabilization of the flow. However, surprisingly, an asymmetric forcing managed to bring partial symmetry to the flow and reduces the cost function even further compared with the best base bleeding solution. Experimentally, the optimization of the steady fluid pinball actuation also leads to asymmetric forcing (Raibaudo et al. Reference Raibaudo, Zhong, Noack and Martinuzzi2019). The EGM managed to converge to the global minimum in less than  $N_i=100$ evaluations. The exploration phases had a lesser impact during the optimization process as we initiated the algorithm close to the global minimum. We can expect the exploration phases to play a major role for a more complex search space, comprising several minima.
4.3. Feedback control optimization – gMLC
In this section we optimize a feedback control law again to stabilize the unforced symmetric steady solution. The feedback is provided by nine velocity signals in the wake as discussed in § 2.3. Several function optimizers can be used to solve the regression problem of (2.9). However, a comparison between classical MLC (Duriez et al. Reference Duriez, Brunton and Noack2016) and gMLC has been carried out, showing that gMLC not only converges faster than MLC but also converges towards a better solution. The comparison between MLC and gMLC is detailed in Appendix A.
In the case of the fluidic pinball, the three cylinders are our three controllers, thus,  $Y \subset \mathbb {R}^3$. For the control input space
 $X$, we choose a grid of nine sensors downstream measuring either the
 $x$ or
 $y$ velocity component. The coordinates of the sensors are
 $x =5, 6.5, 8$ and
 $y=1.25,0, -1.25$. The downstream position of the sensors have been chosen so that a good performance of stabilizing feedback control can be expected (Roussopoulos Reference Roussopoulos1993). The position is far enough for pronounced vortex shedding but close enough to avoid phase decorrelation between actuation and sensing. Moreover, sensors at different
 $x$ locations allow us to exploit phase differences between the sensors. The six exterior sensors are
 $u$ sensors while
 $v$ sensors are chosen for the ones on the symmetry line
 $y=0$, so that the signals vanish when the symmetric steady solution is reached. Experimental realizations are typically based on one or few sensor positions. The large number of nine positions has the advantage that gMLC may indicate not only the near-optimal control law but also the best sensor location. The information of sensors is summarized in table 1. We introduce time-delayed sensor signals as inputs to enrich the search space and allow ARMAX-based controllers (Hervé et al. Reference Hervé, Sipp, Schmid and Samuelides2012). The delays are a quarter, half and three-quarters of the natural shedding period, yielding the following additional lifted sensor signals and allowing us to reconstruct the phase of the flow:
 \begin{equation} s_{i+9}(t) = s_i(t-T_0/4), \quad s_{i+18}(t)=s_i(t-T_0/2), \quad s_{i+27}(t) = s_i(t-3T_0/4). \end{equation}
For oscillatory signals, the chosen time delay corresponds to the first zero of the auto-correlation function which is a common practice for construction of phase spaces. The four time-delay coordinates is the minimum information to determine the mean value, the amplitude and the phase of each signal at every time step.
Summary of sensor information.

Summarizing, the dimension of the sensor vector  $\boldsymbol {s}$ is
 $9 \times 4 =36$ and
 $X \subset \mathbb {R}^{36}$. We do not include time-dependent functions in the input space as we aim to stabilize the flow towards the steady solution so an open-loop strategy is not pursued. In Appendix B we detail an open-loop optimization including periodic functions. We show that a symmetric periodic forcing at
 $\approx$3.5 times the natural frequency manages to stabilize the flow but at the expense of high actuation power. So periodic functions are not included as inputs in order to avoid a costly solution. Thus,
 $N_b=3$,
 $N_s=36$ and
 $N_h=0$. The control laws are then built from nine basic operations (
 $+$,
 $-$,
 $\times$,
 $\div$,
 $\cos$,
 $\sin$,
 $\tanh$,
 $\exp$ and
 $\log$), 36 sensors signals
 $\boldsymbol {s}_{i=1\ldots 36}$ and 10 constants. The control laws are restricted to the range
 $[-5,5]$ to avoid excessive actuation. The basic operations
 $\div$ and
 $\log$ are protected in order to be defined on
 $\mathbb {R}$ in its entirety. The cost function has been computed over 1000 convective time units, so that the post-transient regime is fully established and the transient phase has a lesser weight.
For the implementation of the gMLC algorithm on the fluidic pinball, we start with a Monte Carlo step of  $N_{MC}=100$ individuals, the crossover probability and mutation probability are both set at
 $P_c=P_m=0.5$. Indeed, as the evolution phase is mostly an explorative phase, the mutation probability is increased, from 0.3, in previous studies, to 0.5, to improve the exploration capability. Moreover, even though crossover is an exploitative operator, it is likely to find new minima thanks to recombinations of radically different control laws. That is why the crossover and mutation probabilities are both set to 0.5. The dimension of the subspace is set to
 $N_{sub}=10$, so it is large enough to explore a rich subspace but not too large to avoid a slowdown in the optimization process. Evidently with a subspace of higher dimension the control law can be more finely tuned. To assure that the subplex step effectively goes down the local minimum, we choose to evaluate
 $N_G=50$ individuals during the exploitation phase. Test runs with
 $N_G=5$ have been carried out and showed that the learning process was slower. We believe one reason is that each exploration phase changes systematically the subspace, which makes it difficult for the subplex to improve effectively in only a few steps, thus, subplex has almost no benefit in the early phases. Table 2 summarizes all the parameters for gMLC. The secondary optimization problem (3.4), used to build a matrix representation for the control laws, is solved with LGP. To speed up the computation, we choose to solve the secondary optimization problem with 100 individuals evolving through 10 generations. Finally, our implementation is enhanced by a screening of the individuals to avoid re-evaluating individuals that have different mathematical expressions but are numerically equivalent, just as Cornejo Maceda et al. (Reference Cornejo Maceda, Noack, Lusseyran, Deng, Pastur and Morzyński2019). This screening is used only in steps where the individuals are generated stochastically, meaning in the Monte Carlo step and in the exploration phases. This improvement is also used in LGP to solve the secondary optimization problem. We choose our stopping criterion to be a total number of evaluations to mimic experimental conditions. In this study the limit is set to 1000 following prior experience and practical considerations. The authors have observed convergence within this limit for all MLC studies with dozens of configurations. In addition, wind tunnel experiments with 1000 evaluations and 5–20 s testing time can easily be performed in one day.
Gradient-enriched MLC parameters for the fluidic pinball.

Figure 13 presents the learning process of gMLC for the stabilization of the fluidic pinball. We notice that the first exploration phase, individuals  $i=101,\ldots ,150$, already improved the best cost compared with the Monte Carlo phase. The following exploitation, individuals
 $i=151,\ldots ,200$, present a steep descent, improving the best solution even further. During this phase, we notice a clear trend for the cost of the new individuals. This trend indicates that the simplex is going down towards a minimum. But this descent is interrupted by the next exploration phase. Individuals
 $i=201,\ldots ,250$ greatly improve the best solution. Particularly, two individuals have a much lower cost that those in the simplex, suggesting that a new minima has been found. The next exploitation phase with individuals
 $i=251,\ldots ,300$ brings no improvement. The high values of cost in the exploitation steps following the exploration phases is explained by the fact that as we are exploring new minima, shrink steps must be performed to bring the simplex towards the new minima; and the shrink steps replace all individuals in the simplex except the best one. As we are leaving one minimum for another one, the intermediate values can be arbitrarily high until the simplex reached the neighbourhood of the new minimum. The next exploration phase with individuals
 $i=301,\ldots ,350$ also give good individuals that have been included in the simplex. After 350 evaluations, the only improvements are performed by exploitation phases. Even if the best cost keeps decreasing slowly, the improvements are small, indicating that we are close to the minimum. Once we reach a plateau, further improvement can only be performed if an exploration phase finds an individual close to a better minimum. That is why after 800 individuals, we performed only exploration phases. The final control law build with gMLC reads as
 \begin{equation} \left.\begin{aligned} b^{gMLC}_1 & ={-}0.0004\sin(\cos(s_{30})) -0.0034(s_{6} + s_{22}) -0.0033(\log(s_{11})) \\ & \quad -0.0305( s_{3})-0.0098(s_{16} + s_{15}) + 0.0055 s_{35}(s_{16} + 0.31016) \\ & \quad -0.0091( s_{3} - s_{23})+ 0.9206 \tanh(s_{16}) -0.1238\cos(s_{31})+0.1907,\\ b^{gMLC}_2 & ={-}0.0459(\log(\log(s_{31})))-0.1946,\\ b^{gMLC}_3 & ={-}0.0004( 0.841471s_{34} - s_{36} )-0.0043\log(s_{9} ) -0.0022(s_{25} - s_{16})\\ & \quad -0.0098 (\cos(s_{3}) - s_{16}) + 0.9206\log(\tanh(\exp(s_{2}))) -0.0295, \\ J_a & = 7.82. \end{aligned}\right\} \end{equation}
Distribution of the costs during the gMLC optimization process. Each dot represents the cost  $J_a/J_0$ of one individual. The colour of the dots represents how the individuals have been generated. Black dots denote the individuals which are randomly generated (Monte Carlo). Blue dots refer to individuals which are generated from a genetic operator (exploration). And yellow dots correspond to individuals arising from the subplex method (exploitation). The individuals from the Monte Carlo step and the exploration phase have been sorted following their costs. The red line shows the evolution of the best cost. The vertical axis is in log scale.

Figure 14 presents the characteristics of the flow controlled by the best control law  $\boldsymbol {K}^{gMLC}$ built with gMLC. This control law is detailed later specifically in table 3. In figure 14(a) we can see that even if the resulting lift coefficient is still asymmetric, the mean value (around
 $-0.1$) is closer to 0 as compared with the EGM solution. The PSD in figure 14(d) shows a dominant frequency at
 $f_3=0.144$ and one of its higher harmonics. A small peak can be seen for
 $f_4 \approx 0.016$. The nonlinear interaction between the frequencies
 $f_3=0.144$ and
 $f_4=0.016$ gives rise to another small peak at
 $f_5=0.160$. The phase portrait in figure 14(b) reveals drifts in pronounced oscillations due to the low-frequency modulation. The presence of the dominant frequency
 $f_3=0.144$ and its harmonic in the spectrum is consistent with the periodic behaviour of the flow. The
 $f_4=0.016$ peak is responsible for the width of a predominant limit-cycle dynamics in the phase portrait.
Characteristics of the flow controlled by the best feedback control law found with gMLC. (a) Time evolution of the lift coefficient  $C_L$, (b) phase portrait, (c) time evolution of instantaneous cost function
 $j_a$ and (d) PSD showing the frequency
 $f_3=0.144$ of the forced flow, one of its harmonics and two low-power frequencies
 $f_4=0.016$ and
 $f_5=0.160$. The control starts at
 $t=400$. The unforced phase is depicted in blue and the forced one in red. The phase portrait and the PSD are computed over
 $t \in [900,1400]$, during the post-transient regime.

Summary of the 14 control laws composing  $\boldsymbol {K}^{gMLC}$ described in (4.3). For each control law, we present
 $b_1$,
 $b_2$,
 $b_3$, the associated weight and the reduced cost
 $J_a/J_0$. The three best control laws are
 $\#11$,
 $\#13$ and
 $\#14$.

The evolution of the instantaneous cost function  $j_a$ in figure 14(c) shows a plateau after
 $200$ convective time units, reaching an even lower level (around 6), compared with the EGM solution (around 9). The associated cost
 $J_a/J_0=0.20$ is better than the EGM solution at
 $J_a/J_0=0.28$.
Tables 3, 4 and figure 16(a) give more details on the control law  $\boldsymbol {K}^{gMLC}$ built with gMLC. Firstly, we can see that even though the simplex comprises
 $N_{sub}=10$ individuals, subplex build the control law
 $\boldsymbol {K}^{gMLC}$ by linearly combining 14 control laws. Indeed after a few iterations of simplex, all the individuals are eventually a linear combination of the initial individuals forming simplex. When a new individual is introduced in the basis thanks to the exploration phase, the exploitation phase will combine the remaining individuals with the new one, making the next individual a linear combination of more than 10 individuals. It is important to note that even after the introduction of new individuals with the exploration phase, the subspace to explore changes but the dimension remains. In this case, with
 $N_{sub}=10$, the dimension of the subspace is 9. The repetition of this process builds each time more complex control laws. Thus, in table 3 individuals
 $i=11,12,13,14$ have been introduced thanks to exploration phases. The control laws with the strongest weights are
 $i=11, 13$ and
 $14$, whereas the weight associated with the other control laws are at least one order of magnitude lower. Control law
 $i=11$ is also the one with the lowest cost
 $J_a/J_0=0.26$. The control law
 $\boldsymbol {K}^{gMLC}$ is then mainly based on
 $i=11$ and corrected by the remaining control laws. This indicates that on the last phase of the learning, it is the minimum in the neighbourhood of
 $i=11$ that has been found.
Summary of control law information. The frequencies and peak-to-peak amplitude have been computed on the post-transient regime.

Moreover, table 3 shows that all three control components  $b_1^{gMLC}$,
 $b_2^{gMLC}$ and
 $b_3^{gMLC}$ of the gMLC control law include sensor information. However, figure 16(a) shows that the actuation command associated with
 $\boldsymbol {K}^{gMLC}$ for the two rearward cylinders (
 $b_2$ and
 $b_3$) are nearly constant. This is partially due to the low weights associated to the control laws with sensor signals. We can also assume that the sensor signals cancel each other, leading to such low peak-to-peak amplitudes. Table 4 shows the characteristics of the actuation command during the post-transient regime. A spectral analysis shows that the main frequency of the actuation command for the front and bottom cylinder is twice the main frequency of the flow
 $f_3$, revealing that the actuation is a function of the flow. Thus, gMLC managed to build a combination between asymmetric steady forcing and feedback control. Finally, like EGM, the best solution found is asymmetric but with lower amplitudes. Consequently, the associated actuation power is lower compared with general steady actuation found with EGM:
 $J_b=0.2018$ for the general steady actuation and
 $J_b=0.0391$ for the feedback control law found with gMLC.
The controlled flow is depicted over one period in figure 15(a–h). First, we notice that the jet fluctuates around a vanishing mean, as for the EGM actuation. Also, the vortex shedding of the upper and lower shear layers hardly interact. Compared with the EGM solution, the stability of the wake is improved as the two Kelvin–Helmholtz vortices keep their transverse distance to the symmetry line until the very end of the computational domain. This is explained by the re-energization of the shear layers thanks to the vigorous rotation of the front cylinder at twice the main frequency  $f_3$ of the controlled flow, like Protas (Reference Protas2004). The mean field, figure 15(j), is similar to the symmetric steady solution. Indeed, we notice that the vorticity regions extend to the end of the computation domain, such as the symmetric steady solution. Also, as for the best general steady actuation, the region near the cylinders is non-symmetrical due to the action. However, contrary to the symmetric steady solution, the mean field of the feedback control has a narrower region between the vorticity regions upstream and a wider region downstream.
Vorticity fields of the best feedback control found with gMLC. (a–f) Time evolution of the vorticity field throughout the last period of the 1400 convective time units, (i) the objective symmetric steady solution and (j) the mean field of the forced flow. The colour code is the same as figure 1. Here  $T_3$ is the period associated to the frequency
 $f_3$. The mean field has been computed by averaging 100 periods.

As expected, gMLC manages to find a new solution that surpasses the best general steady actuation found with EGM. Surprisingly, gMLC built a non-trivial solution, combining asymmetric steady forcing and feedback control for the front cylinder, controlling the flow with a direct feedback of the phase of the flow, i.e. phasor control (Brunton & Noack Reference Brunton and Noack2015). Interestingly, gMLC composed a control law that forces the flow at twice the main frequency. In addition, compared with the best general steady actuation, the actuation power is significantly reduced. Lastly, the learning process of gMLC exploited both the evolution phases and the simplex steps to rapidly build better solutions. Thanks to the evolution phases, new minima have been successfully found and thanks to the simplex steps, the solutions have been improved even more. The progress of the subplex steps show that local gradient information can be exploited in a subspace of an infinite dimension space to minimize a cost function. Building on this success, we believe that gMLC will greatly accelerate the optimization of control laws for MIMO control as compared with the linear GPC.
5. Discussion
This section discusses design aspects of the proposed methodology which are of relevance to this and other configurations. In § 5.1 the role of feedback is assessed. Section 5.2 discusses the role of the number of actuators and sensors for the learning process. In § 5.3 the effect of the dynamics complexity and noise on learning speed is discussed. Finally, robustness for other operating conditions is elaborated in § 5.4.
5.1. The need for feedback
Feedback plays an important role in the gMLC control. Figure 16(a) shows the corresponding evolution of the actuation commands and instantaneous cost function  $j_a$. The actuation commands lead to constant cylinder rotation with a small fluctuation from the sensor signal. The cost function converges to a steady value after some 200 non-dimensional time units. In figure 16(b) the actuation commands are replaced by their respective post-transient averaged value of the last 500 time units. Now, the cost function fluctuates periodically between the optimal and the unforced value. The associated averaged cost is
 $J_a/J_0=0.59$ and about three times the optimal gMLC value
 $J_a/J_0=0.20$. The important role of feedback is corroborated with another test. The actuation commands of the gMLC control are recorded and applied in an open-loop manner to the flow with a random initial condition. Again, the performance
 $j_a$ largely fluctuates. Evidently, the small feedback fluctuations play an important role in the stabilization. Intriguingly, similar observations are made by the authors for stabilizing experimental cavity fluctuations and will be described in the dissertation of the first author (Cornejo Maceda Reference Cornejo Maceda2021).
Time series of the actuation command  $\boldsymbol {b}=[b_1,b_2,b_3]^\intercal$ and the instantaneous cost
 $j_a$ for the best feedback control law found with gMLC (a) and (b) for the flow controlled by a steady control law whose values are the averaged gMLC control during the post-transient regime.

5.2. Number of sensors and actuators
The control performance is found to increase as the search space is generalized from single parameter steady base bleeding forcing to three parameter steady actuation to feedback with nine sensors. Generally, increasing the number of actuators and sensors can be expected to enhance the maximum control performance albeit with eventually diminishing returns. On the other hand, the learning time will also increase with the number of actuators and sensors and with the complexity of control laws, e.g. inclusion of time-delay coordinates. Evidently, there is a trade-off between performance gains from increasing the search space and the limitations of the testing time. As in model identification (see, e.g. Abu-Mostafa, Magndon-Ismail & Lin Reference Abu-Mostafa, Magdon-Ismail and Lin2012), one can expect an optimal level of complexity for a given testing time. From MLC with dozens of configurations (see, e.g. Noack Reference Noack2019), our observation is that the learning time is weakly affected by the number of control law inputs but increases with the number of uncorrelated actuation commands.
The subplex iteration of gMLC is found to significantly accelerate the learning process. Evolutionary methods are known to underperform for convergence of identified minima, i.e. a strength of gradient-based approaches. Gradient-based methods have another advantage of staying in well-performing subspaces. In contrast, genetic operations, such as mutation and crossover, tend to bread new individuals leaving these subspaces. These observations are particularly relevant when a symmetry or invariant of the control law is performance critical. The inclusion of known symmetries or invariants in gMLC might be achieved by pre-testing and excluding individuals which strongly depart from these constraints. An example of self-discovery of such symmetries and invariants is reported in Belus et al. (Reference Belus, Rabault, Viquerat, Che, Hachem and Reglade2019) for deep reinforcement learning.
5.3. Complexity of dynamics and noise
The applicability of gMLC to turbulent flows will be addressed in future works starting with Cornejo Maceda (Reference Cornejo Maceda2021). Already MLC has been successfully applied to learning distributed actuation for mixing optimization of a turbulent jet (Zhou et al. Reference Zhou, Fan, Zhang, Li and Noack2020). Recent experimental applications of gMLC include mitigation of cavity oscillations, drag reduction of a generic truck model under yaw and lift increase of airfoil under angle of attack at a Reynolds number near one million. Performance and reproducibility of gMLC control are encouraging and outperform other methods, including MLC. Hence, the very optimization principle of iterating between exploration (for discovering new minima) and exploitation (for a fast descent towards the minimum) seems sound. Yet, numerical studies of multi-frequency forcing of the fluidic pinball foreshadow challenges for asymptotic regimes. When the actuation space has many ‘idle’ directions with near constant performance, the gradient-based descent may be trapped in local minima. One cure is a subplex method on ‘active subspaces’ aligned with the direction of performance gradients.
Genetic programming is a powerful regression solver which is successfully validated in dozens of experiments, Navier–Stokes simulations and dynamical systems (Noack Reference Noack2019; Ren et al. Reference Ren, Hu and Tang2020). It can learn complex laws for  $O(10)$ signals and
 $O(10)$ actuation commands by testing
 $O(1000)$ individuals over
 $O(1000)$ characteristic times each, i.e.
 $O(1\,000\,000)$ characteristic times in total (Wu et al. Reference Wu, Fan, Zhou, Li and Noack2018; Zhou et al. Reference Zhou, Fan, Zhang, Li and Noack2020). Yet, it may not be the most effective choice under several conditions: (1) the total testing time is restricted to much smaller budgets typical for three-dimensional simulations; (2) the control law is smooth or can be expected to depend linearly or affinely to the sensor signals; (3) the flow performance responds immediately to good or bad actuation. Smoothness is well exploited in cluster-based control (Nair et al. Reference Nair, Yeh, Kaiser, Noack, Brunton and Tiara2019). Deep reinforcement learning may learn quickly the optimal actuation in case of fast performance response (Rabault et al. Reference Rabault, Kuchta, Jensen, Réglade and Cerardi2019; Fan et al. Reference Fan, Yang, Wang, Triantafyllou and Karniadakis2020). Combining techniques may also accelerate the learning such as the merging of genetic algorithm and downhill simplex in Maehara & Shimoda (Reference Maehara and Shimoda2013). Future work will give more indications about good choices or combinations of machine learning algorithms.
5.4. Robustness of the control
The current study optimizes control for a single Reynolds number. Its robustness will be addressed in future work. We can distill few rules of thumb for robustness from past experience with experiments. First, if the actuation mechanism relies on changing large-scale coherent structures, such as synchronizing vortex formation (Parezanović et al. Reference Parezanović, Cordier, Spohn, Duriez, Noack, Bonnet, Segond, Abel and Brunton2016), the control learned for one condition is likely to be robust for a range of conditions. Second, the control law should be learned in a non-dimensional form. For instance, the Strouhal number of an actuation can be expected to be more relevant for different velocities than the value in Hertz unrelated to the velocity change (Gautier et al. Reference Gautier, Aider, Duriez, Noack, Segond and Abel2015). Third, in an ideal scenario, the intended range of operating conditions is already included in the cost function. For instance, a control law may be evaluated at different operating conditions or in a slow transient between them (Asai et al. Reference Asai, Yamato, Sunada and Rinoie2019; Ren, Wang & Tang Reference Ren, Wang and Tang2019). This will, however, dramatically increase the testing time. The learning time saved by smarter algorithms, like gMLC, may be invested in assuring robustness for multiple operating conditions. Tang et al. (Reference Tang, Rabault, Kuhnle, Wang and Wang2020) provide an inspiring example for deep reinforcement learning.
6. Conclusions
We have stabilized the wake behind a fluidic pinball with three independent cylinder rotations in successively larger search spaces for control laws. Figure 17 summarizes the corresponding performances quantified by the average distance between the controlled flow and the steady symmetric solution. First, steady symmetric forcing is employed. A base bleed solution with a cylinder rotation of 28 % of the oncoming velocity leads to a flow which is 49 % closer to the symmetric solution than the unforced attractor. Other studies also report a stabilizing effect of base bleed on bluff body wakes (Wood Reference Wood1964; Bearman Reference Bearman1967). In contrast, Coanda forcing, i.e. two symmetric cylinder rotations which accelerate the outer flow, may completely stabilize the flow. Yet, this new wake has no long vortex bubble and is further away from the symmetric steady solution than the unforced vortex shedding.
Summary of the performances for the best solutions of each search space. The first column describes the search space. The second column contains the respective dimension of the studied search space. The method and number of evaluations needed to arrive at the presented solution are listed in the third and fourth column, respectively. The fifth column shows the relative distance to the symmetric steady solution  $J_a/J_0$ (in blue) and the actuation power
 $J_b$ (in yellow). For the gMLC feedback control optimization, the best control law studied has been found after 800 evaluations but the cost
 $J_a/J_0$ was already under 0.26 after 250 individuals. The fifth row corresponds to the solution found with standard MLC after 1000 evaluations as elaborated in Appendix A. The last row shows the results for a periodic forcing optimization performed with EGM, see Appendix B.

Second, a general non-symmetric actuation is optimized with the EGM. Surprisingly, an asymmetric actuation reduces the average distance between the flow and the steady target solution further to 28 % of the unforced value. This asymmetric actuation leads to shear-layer vortices which do not interact and, thus, do not form von Kármán vortices. The mean flow is slightly asymmetric, but largely mimics the elongated steady symmetric solution. The price for the better performance is a larger actuation power (see figure 17). Intriguingly, MLC also leads to distinctly asymmetric actuation in experiments (Raibaudo et al. Reference Raibaudo, Zhong, Noack and Martinuzzi2019) and simulations (Cornejo Maceda et al. Reference Cornejo Maceda, Noack, Lusseyran, Deng, Pastur and Morzyński2019) for other cost functions.
Third, a feedback actuation obtained from gMLC brings the flow even closer to the steady target solution. The associated actuation power is smaller than the previous optimized steady actuations (see figure 17). The actuation is a combination of asymmetric steady forcing and phasor control. The resulting flow looks similar to the optimal asymmetric steady forcing. Figure 18 summarizes the results for the hierarchy of control search spaces.
Summary of the optimized stabilization solutions obtained for each search space. The Venn diagram (left) depicts the hierarchy of the control law spaces. The corresponding optimal solutions are presented along with their performances, control laws (centre) and mean fields (right). The mean field of the statistically asymmetric unforced flow is depicted in the top row and the symmetric target solution in the bottom row.

The feedback control does not seem to have the authority to completely stabilize the symmetric target solution, such as for the cylinder wake controlled by a volume force (Gerhard et al. Reference Gerhard, Pastoor, King, Noack, Dillmann, Morzyński and Tadmor2003). The wake can be ‘almost’ stabilized for short periods of time, starting from the unforced flow. Then, new coherent structures emerge and lead to residual shear-layer shedding. This lack of complete authority for stabilization may be explained by the complexity of the dynamics. The fluidic pinball has a primary instability associated with von Kármán vortex shedding, a secondary pitchfork instability associated with the centreline jet, and two Kelvin–Helmholtz instabilities of the top and bottom shear layer.
Intriguingly, symmetric high-frequency forcing can bring the flow even closer to the steady target solution but with an actuation power which is roughly two orders of magnitude larger than the previous control laws (see figure 17). Protas (Reference Protas2004) and Thiria et al. (Reference Thiria, Goujon-Durand and Wesfreid2006) also find a stabilizing effect of high-frequency forcing on vortex shedding. The thickening of the shear layers by high-frequency vortices reduces the gradients and, thus, the instability. To summarize, MLC has automatically discovered well-known stabilizing mechanisms, such as base bleed and phasor control, but added an unexpected asymmetric forcing and combination of this open-loop actuation and phasor feedback for improved performance.
The presented stabilizations are expected to be independent of the employed optimizer as different approaches lead to very similar results. The chosen optimizers balance exploitation (downhill descend of found minima) and exploration (search for better minima). The optimization has been effected in a three-dimensional parameter space for steady forcing and a feedback space with three actuation inputs and nine sensing outputs. The starting point is LHS as exhaustive exploration of the parameter space and linear GPC as an effective regression solver with explorative and exploitive features. The search has been significantly accelerated by intermittently adding gradient-based descents. The resulting EGM and gMLC seem efficient for both exploration and exploitation. Future research shall focus on accelerated learning.
The control performance may be further improved by allowing for more general control laws comprising the history of the sensor signals, as in ARMAX-based control (Hervé et al. Reference Hervé, Sipp, Schmid and Samuelides2012). Other generalizations of MLC include multiple predefined operating conditions, adaptive control for unknown operating conditions, automated learning of the response model from the control law to performance following Fernex et al. (Reference Fernex, Semann, Albers, Meysonnat, Schröder and Noack2020) and automated learning of control-oriented modelling based on Li et al. (Reference Li, Fernex, Tan, Morzyński and Noack2021). The fluidic pinball represents an attractive plant of sufficient dynamic complexity with manageable computational load for these developments.
Acknowledgements
The authors thank Antoine Blanchard, Nan Deng, Luc Pastur and Themis Sapsis for fruitful discussions and enlightening comments. We also thank the anonymous referees for their insightful suggestions.
Funding
This work is supported by the French National Research Agency (ANR) via FLOwCON project ‘Contrôle d’écoulements turbulents en boucle fermée par apprentissage automatique’ funded by the ANR-17-ASTR-0022, the German National Science Foundation (DFG grants SE 2504/1-1 and SE 2504/3-1), the iCODE Institute, research project of the IDEX Paris-Saclay and by the Hadamard Mathematics LabEx (LMH) through the grant number ANR-11-LABX-0056-LMH in the ‘Programme des Investissements d'Avenir’.
Declaration of interests
The authors report no conflict of interest.
Appendix A. Comparison between MLC and gMLC
In this appendix we compare the performances of a MLC, based on linear GPC (Li et al. Reference Li, Noack, Cordier, Borée, Kaiser and Harambat2018; Zhou et al. Reference Zhou, Fan, Zhang, Li and Noack2020), and the proposed gMLC variant for the stabilization of the fluidic pinball. Gradient-enriched MLC is described in § 4.3. Machine learning control differs from gMLC in two respects. First, the evolution is from generation to generation, i.e. groups of individuals. Second, unlike gMLC, no gradient information is employed. The first generation of randomly generated individuals evolves through generations thanks to the following three genetic operations.
• Crossover: a stochastic recombination of two individuals, making two new individuals exploiting parts of the first two individuals.
• Mutation: a stochastic change in one individual, making a new individual from the previous one.
• Replication: an identical copy of one individual, assuring memory of good individuals throughout the generations.
During the evolution process, the better performing individuals are selected with larger probability to build new individuals thanks to the genetic operators. The best individuals are selected thanks to a tournament selection method. As in Duriez et al. (Reference Duriez, Brunton and Noack2016), we choose a tournament selection of size 7 for 100 individuals. A genetic operation is chosen randomly following given probabilities: the crossover probability  $P_c$, the mutation probability
 $P_m$ and the replication probability
 $P_r$. The probabilities add up to unity
 $P_c+P_m+P_r=1$. The set of parameters
 $[P_c,P_m,P_r]^\intercal =[0.6,0.3,0.1]^\intercal$ suggested in Duriez et al. (Reference Duriez, Brunton and Noack2016) have been chosen for MLC. A parametric study varying
 $P_c$,
 $P_m$ and
 $P_r$ with a 0.1 step has been carried out on the stabilization of a Landau oscillator by forcing only on one of its components. As MLC is a stochastic process, we perform 100 test runs for each probability combination. This parametric study reveals that this probability combination
 $[P_c,P_m,P_r]^\intercal =[0.6,0.3,0.1]^\intercal$ is one of the best. Among all the probability combinations, this combination is one of those that converges towards better solutions in average, with one of the lowest dispersions of the final solutions over the 100 test runs, showing that this combination is also one of the more robust. This or a very similar probability combination has already been used in Duriez et al. (Reference Duriez, Brunton and Noack2016) and dozens of experiments (Noack Reference Noack2019).
In addition to crossover, mutation and replication, we transfer the best individual of the previous generation to the next one via the elitism operation. This operation assures that the best individual is always in the latest generation so that ‘the winner does not get lost’.
The architecture of the linear programming control laws are the same for MLC and gMLC, including the mathematical operations, number of constants, number of registers, as well as inputs and outputs (see table 2).
The cost function is evaluated over 1000 convective time units, both in MLC and gMLC. The MLC and gMLC algorithms are compared over 1000 evaluations. For MLC, a population of 100 individuals is chosen to evolve over 10 generations. For a fair comparison, MLC and gMLC share the same initial Monte Carlo generation, comprising the first 100 randomly generated individuals. Figure 19 shows the distribution of the costs  $J_a/J_0$ as a function of the evaluations. We note that for both algorithms, the first exploration phase makes great improvement. In the second generation, the best cost is 0.80 for gMLC and 0.70 for MLC. Note that MLC's better performance is understandable as 100 individuals have been evaluated for the second generation whereas only 50 individuals have been evaluated for gMLC. After testing 200 individuals, gMLC surpasses MLC thanks to the subplex steps, reaching a cost
 $J_a/J_0=0.36$. For the second evolution phase, both MLC and gMLC perform well reaching low levels of
 $J_a/J_0$: 0.36 for MLC and 0.26 for gMLC. Then, MLC achieves only a small progress after 900 evaluations, the cost improves from 0.36 to 0.33. The series of blue dots at
 $J_a/J_0=0.36$ from
 $i=201$ to
 $i=900$ represents several instances of the best individual of generation 3, duplicated thanks to elitism. For gMLC, figure 13 shows that evolution phases do not bring any progress after 250 evaluations and further improvement is made thanks to the subplex steps. As described in § 4.3, the evolution phases help to enrich the simplex subspace. The subplex steps manage to reduce the cost function from 0.26 to 0.20. We notice that after 600 evaluations all new subplex individuals have the same cost. Hence, gMLC surpasses MLC with a smaller number of evaluations and enables improvement/fine-tuning of the control laws in the final phase.
Distribution of the costs during the MLC optimization process. Each dot represents the cost  $J_a/J_0$ of one individual. The colour of the dots represent how the individuals have been generated. Black dots for the individuals randomly generated by a Monte Carlo process (individuals
 $i=1,\ldots ,100$), blue dots for the individuals generated from a genetic operator (individuals
 $i=101,\ldots ,1000$). For each generation, the individuals have been sorted according to their cost. The red line shows the evolution of the best cost for the MLC optimization process. The green curve corresponds to the gMLC optimization process. The vertical axis is in log scale.

Appendix B. Optimal periodic forcing
In this appendix we aim to stabilize the symmetric steady solution thanks to a symmetric periodic forcing. In this case, the two back cylinders oscillate in opposite directions whereas the front cylinder stays still. The control ansatz is
 \begin{equation} \left.\begin{array}{c@{}} b_1 = 0, \\ b_2 = B \cos (2{\rm \pi} F t), \\ b_3 ={-}B \cos (2{\rm \pi} F t), \end{array}\right\} \end{equation}
with  $B$, the amplitude of the oscillations, and
 $F$, the frequency, being the two parameter to optimize. The search space is limited to
 $[B,F/f_0]^\intercal \in [0,5]\times [0,10]$ as higher amplitudes and frequencies would be beyond our solver capabilities. This two-dimensional search space is explored with EGM. The contour plot in figure 20 depicts the search space based on
 $J_a/J_0$ and
 $J_b$. The contour plot has been produced thanks to simulations for
 $B \in \{ 0.1, 0.5, 1, 2, 3.5, 5\}$ and
 $F/f_0 \in \{ 0.1, 0.5,1,2,3.5, 5,7.5,10 \}$. The steps are finer for low frequencies and low amplitudes. The individuals have been evaluated over 250 convective time units. We notice that there is only one minimum on the plane, close to
 $[B,F/f_0]^\intercal = [3.51,3.19]^\intercal$. Also, forcing at frequencies close to the natural frequency resonates with the flow and drastically increases the distance to the steady solution for high amplitudes. For
 $J_b$, the contour map expectedly displays high values at high frequencies and large amplitudes. The three initial control laws for EGM are the centre of the box and increments of 1/5 of the box size in each direction:
 $[2.5,5]^\intercal$,
 $[3,5]^\intercal$,
 $[2.5,6]^\intercal$. As expected, the LHS steps (in blue) spread rather evenly in the domain whereas the simplex steps (in yellow) quickly descend into the global minimum.
Contour plot for  $J_a/J_0$ (a) and
 $J_b$ (b) as a function of the amplitude
 $B$ and the normalized frequency
 $F/f_0$. For (a), blue (red) regions denote good (bad) performances while white regions correspond to costs that are equivalent to the natural flow. For (b), the colour code describes the actuation energy. The symbols represent the individuals tested with EGM: black diamonds for the initial conditions, blue solid circles for exploration phases and yellow solid circles for the exploitation phases. For the legend, refer to figure 9.

Figure 21 shows the progression of the best individual throughout the evaluations. The EGM optimization process converges after a few tests as  $J_a/J_0$, the amplitude and the frequency reach asymptotic values, without any significant improvement afterwards. The parameters of the best symmetric periodic forcing are denoted by the superscript ‘EGM’ and read as
 \begin{equation} \left.\begin{array}{c@{}} B^{EGM} = 3.51,\\ F^{EGM}/f_0 = 3.19. \end{array}\right\} \end{equation}
The proximity between the initial values and the aimed minimum certainly accelerates the observed convergences. Figure 22 shows the evolution of the lift coefficient, the phase portrait, the PSD and the instantaneous cost function  $j_a$ for the controlled flow. The lift coefficient presents rather symmetric low amplitude oscillations; see figure 22(a). This goes along with the flow symmetry in figure 23(a–h). The oscillations are explained by the remaining vortex shedding on both the upper and lower side of the fluidic pinball. Even though the far field is close to the symmetric steady solution, this periodic solution changes radically the near field profile. The jet is completely flattened. We can identify parts of the two vorticity branches close to the cylinders in figure 23(c–e). Moreover, the vorticity around the cylinders is more intense compared with the initial steady solution. This difference is present in the final mean value
 $j_a$ in figure 22(c) and is responsible for the high actuation power expense,
 $J_b=5.2799$. The phase portrait shows a periodic regime, though deformed by the harmonics. The mean frequency
 $f_6=0.398$ is slightly lower than the forcing frequency
 $F^{EGM} = 0.37$ and much lower than the natural frequency, showing that it is not just a simple frequency locking, but a nonlinear frequency crosstalk. The non-centred phase portrait indicates that there is still an asymmetry in the flow, that may be a residual effect of the grid's asymmetry. The mean field in figure 23(j) is similar to the symmetric steady solution, however, the jet completely vanishes. In addition, the distance between the upper and lower vorticity branches is wider compared with the symmetric steady solution.
Evolution of (a) the amplitude  $B$ and the normalized frequency
 $F/f_0$ and (b) the reduced cost
 $J_a/J_0$ as a function of the number of evaluations
 $i$, for the EGM optimization process. The red line in (b) shows the evolution of the best cost. The evaluation time is 250 convective time units.

Characteristics of the best periodic forcing found with EGM. (a) Time evolution of the lift coefficient  $C_L$, (b) phase portrait, (c) time evolution of instantaneous cost function
 $j_a$ and (d) PSD showing the main frequency
 $f_6=0.398$ of the forced flow and six harmonics. The control starts at
 $t=400$. The unforced phase is depicted in blue and the forced one in red. The phase portrait and the PSD are computed over
 $t \in [900,1400]$, during the post-transient regime.

Vorticity fields of the best periodic forcing found with EGM. (a–f) Time evolution of the vorticity field throughout the last period of the 1400 convective time units, (i) the objective symmetric steady solution and (j) the mean field of the forced flow. The colour code is the same as figure 1. Here  $T_6$ is the period associated to the frequency
 $f_6$. The mean field is computed by averaging 200 periods.


 Open access

