Introduction
In recent times, there has been a growing interest in the widespread application of metamaterial absorbers across various domains, such as antennas, wireless communication, military, radar, satellite, aerospace, biomedical, electromagnetic compatibility, and stealth technology. Creating sensors that utilize absorbers presents significant challenges since they must be flexible, compact, cost-effective, and capable of withstanding harsh conditions. However, recent advancements have allowed for the development of absorber-based sensors that are both economically viable and versatile while maintaining full functionality.
A study presented by Routray and Ghosh [Reference Routray and Ghosh1] discusses a multiband absorber that operates within the C, X, and Ku frequency ranges. To achieve compactness, a multilayer design was implemented, reducing the absorber’s dimension to 0.034λ2. However, due to the stacking arrangement, this absorber can only maintain triple bands while having larger profiles. Research in Sahul [Reference Sahu2] observed six distinct absorption peaks within the range of 2–18 GHz. The same configuration was utilized to develop a THz absorber capable of detecting various types of cancer cells and monitoring blood glucose levels. Nonetheless, since size is a critical factor that affects sensitivity, the unit cell area (0.036λ2) is excessively large to be considered an optimal sensor. In Zarin et al. [Reference Zarin, Ahmed and Tahir3], a four-band absorber is introduced that achieves perfect absorption by utilizing the C4 symmetry of the unit cell. The C, X, Ku, and Ka operating bands seem to be insensitive to polarization. However, the absorber features a 1.30λ2 unit cell area along with a conventional star-shaped upper metallic layer. The multilayered frequency selective surface (FSS) presented in Dey [Reference Dey4] operates in two modes: in transmission mode, it reflects signals within two stopbands, while in reflection mode, it absorbs signals across four bands. One downside is the mechanical switching required between the two modes, along with the large profile size. In the penta-band absorber discussed in Guo et al. [Reference Guo, Zhong, Yan, Xingting, Wei, Gao and Tang5], a SiO2 layer is sandwiched between two aluminum layers and contains multiple U-shaped split-ring resonators (SUSRRs) in the upper layer. The absorption peaks in the THz domain adjust their center frequencies when the temperature of the sealed ethanol filling the SUSRRs changes. To showcase the effectiveness of the suggested biosensor with respect to sensitivity, the absorber-biosensor operating within the THz range was presented in Maurya and Singhal [Reference Maurya and Singhal6]. However, it only utilizes six bands and has a unit cell area measuring 0.011λ2. In Dewangan et al. [Reference Dewangan, Mishra and Ghosh7], the top layer featured an SSS resonating structure that achieved an absorption band at 4.35 GHz, boasting a maximum Q-factor of 72.6, indicating high selectivity. Nonetheless, the conventional design used here produced single-band absorption. The research in Mohanty et al. and Singh et al. [Reference Mohanty, Member, Acharya, Bhargav Appasani and Khan8, Reference Singh, Gupta, Kaler, Singh, Member and Gill9] implemented an asymmetric design to realize near unity absorptivity at 4.5THz and 10.5 GHz. While asymmetric shapes enhance output variability, linearity, and sensitivity, as well as their ability to accommodate different analyte thicknesses, they also increase sensitivity to polarization and incidence angle. Excessive exposure of human tissue to high-frequency electromagnetic waves during tumor detection can lead to tissue damage, as shown in Botao et al. [Reference Botao, Mengqiu, Zhen, Jinfeng, Guanghui and Yuejin10]. By utilizing an absorbent surface to cover the human body, this issue may be mitigated, and a genetic algorithm was employed to enhance the multilayer structure. In Amiri et al. [Reference Amiri, Tofigh, Shariati, Lipman and Abolhasan11], several already implemented metamaterial absorber designs were analyzed for their applicability in industrial IoT scenarios. To enhance absorption and minimize the size of the absorber, various methods were adopted, including lengthening electrical length, employing multi-resonators, utilizing multiple layers, and applying 3D miniaturization. The absorber mentioned in Yan et al. [Reference Yan, Yunxi, Li, Zhu, Qiu, Guoliang and Erping12] achieves 90% absorption across the 23.2–33.4 GHz frequency range, due to its triple indium tin oxide (ITO) resistive layers interspersed with glass materials. By carefully modifying the resistance of the ITO films, the absorptivity can be enhanced to 99.99%. To cover the frequency range from 0.61 to 12.33 GHz, a combination of three layers of frequency selective surfaces (FSS) was utilized for an ultra-wideband absorber as per reference [Reference Liang, Gao, Zhang, Wang and Jin13]. These layers were separated by an air medium. The absorbing material supported the overall design to enhance absorption at lower frequencies. However, incorporating multiple layers increases both the structural complexity and thickness of the absorber. A left-handed microwave absorber for Internet of Things applications based on metamaterials was detailed in reference [Reference Suman and Kumari14]. It demonstrated a peak absorption rate exceeding 98% at the 2.4 and 5.1 GHz bands, showcasing its dual-band absorption capabilities. A method described in the literature [Reference Ashvanth, Partibane and Idayachandran15, Reference Ashvanth and Partibane16] can enable the realization of six bands between 1THz and 5THz. To attain greater accuracy in biosensing for analyte layers measuring just a few nanometers, a plasmon-induced reflection utilizing a metasurface is detailed in Luo et al. [Reference Luo, Guo, Jiang, Taoping, Yan, Ping, Chen and Huang17].The high Q factor of the described biosensor enables the slow light effect, resulting in nearly perfect interaction between THz waves and biomolecules. In Lili and Tang [Reference Lili and Tang18], a hybrid metasurface composed of graphene, dielectric materials, and a nanodisk metal mirror is introduced. The near-field interaction between the graphene and the plasmons of the metal mirror results in absorption peaks reaching 99% and extends its use to a high-performance optical switch via a tuning mechanism. The work presented in Lili et al.[Reference Lili, Jia, Ping, Chen, Tang and Yan19] illustrates a transition from triple narrowband to broadband absorption spanning the UV to visible spectrum. This was achieved using aluminum-based split ring resonators positioned on a silica mirror to facilitate the slow light effect for enhanced sensing. The studies in Lili et al. [Reference Lili, Fan, Guo, Yan, Huang, Deng and Tang20] and Zhong et al. [Reference Zhong, Guo, Wang, Wei, Tang and Yan21] demonstrate a method for frequency tuning that was previously achieved by altering the temperature of encapsulated ethanol, while the latter method utilized thermally controlled vanadium dioxide. The absorbers discussed are identified as temperature sensors and switches operating in the UV region. The biosensor designed for cancer detection, described in Azab et al. [Reference Azab, Hameed, Nasr and Obayya22], exhibits an average sensitivity of 1.7 THz/RIU and a figure of merit (FoM) of 8.5 RIU−1, along with a compact size of 0.38λ₀2. The use of microwave imaging for identifying cancer cells with the provided sensor was showcased in references [Reference Hamza and Islam23–Reference Hamza, Din, Lavadiya, Koziel, SI, Farmani and MS26].
A proposed absorber exhibiting multiband resonances in the frequency range of 2–20 GHz is discussed in this article. The capability of this absorber to serve as a biosensor for detecting different types of cancer is demonstrated, and the calculated sensitivity validates its effectiveness. The initial section of this article explores various studies related to the research project. To understand the importance of structural modification, Section 2 briefly outlines the design of the unit cell and its stages of transformation. Section 3 concludes the parametric evaluation of the proposed absorber. This portion of the literature also verifies the absorbers’ insensitivity to polarization and their stability across different angles.
Absorber schematic
Figure 1 illustrates the proposed absorber from multiple perspectives. It comprises two copper metallic layers, each 0.035 mm thick, with a substrate made of FR4 that has a relative permittivity of 4.4 and a thickness of 1.6 mm. This unit cell features a periodicity of 10 mm (P). From the central circular ring of the upper metamaterial layer, four “L”-shaped arms are formed, with dimensions C = 2.3 mm and L1 = 5 mm. The ends of each arm are twisted to create two straight stubs, each measuring L2 = L3 = 7.3 mm. To accomplish both size reduction and the addition of necessary frequency bands, a circular zigzag design is integrated into each quadrant. The inner and outer circles of the zigzag structure have radii of R1 = 3.3 mm and R2 = 2.7 mm, respectively. A flat copper surface underneath acts as the ground plane. The copper layers maintain a consistent thickness of 0.035 mm. Figure 2 displays multiband absorption peaks across the operating frequency range of 2–20 GHz for the described design. These peaks occur at center frequencies of 2.425 GHz, 5.73 GHz, 6.35 GHz, 7.95 GHz, 10.386 GHz, 12.38 GHz, 14.7 GHz, 15.4 GHz, 16.15 GHz, 17.65 GHz, and 19.48 GHz
Absorber’s (a) front view, (b) rear view, (c) side view.

Absorber’s (a) absorption response (b) simulation setup.

In CST software, initiate a new template. Select MW, RF, or OP (Microwave, Radio Frequency, Optical) as your application field, followed by FSS or metamaterial-unit cell as the workflow. A phase reflection diagram will be chosen subsequently. The design and evaluation of the metamaterial absorber will be performed using a time domain solver. The simulation model of the unit cell in the CST environment is shown in Fig. 2(b), where it is aligned along the z-axis between two waveguide ports. To establish a periodic boundary condition that facilitates the arrangement of multiple unit cells to create the metamaterial absorber, an open space boundary condition is selected along the z-axis, whereas an electric periodic boundary condition is applied along the x-axis and a magnetic periodic boundary condition along the y-axis.
Absorber evolution
The design process for the proposed absorber, along with the corresponding absorption responses, is depicted in Fig. 3. The process began with a simple swastika-shaped top metallic layer that achieves quad band resonance at frequencies of 5.6 GHz, 14.2 GHz, 15.9 GHz, and 19.2 GHz. In the second stage, when the swastika is modified to incorporate asymmetric “U” stubs, the number of absorption peaks increases to seven. The third stage involves shrinking and adding a quad ring to each quadrant of the absorber, resulting in evenly distributed bands ranging from 2 to 20 GHz. The extension of the quad ring into a circular zigzag configuration in the fourth stage yields nine bands at the frequencies of 3.2 GHz, 6.5 GHz, 8.4 GHz, 10.2 GHz, 12.1 GHz, 13 GHz, 15.4 GHz, 16.9 GHz, and 19.5 GHz, as shown in stage 4 of Fig. 3. In the fifth stage, incorporating asymmetric shapes on the sides with parallel arms produces multiband resonances at frequencies of 2.425 GHz, 5.73 GHz, 6.35 GHz, 7.95 GHz, 10.386 GHz, 12.38 GHz, 14.7 GHz, 15.4 GHz, 16.15 GHz, 17.65 GHz, and 19.48 GHz across the intended spectrum of interest.
Evolution of proposed absorber.

Absorption analysis
The absorptivity of the absorber can be calculated by
 \begin{equation}A = 1 - {\left| {{S_{11}}} \right|^2}\,\end{equation}
To accomplish complete absorption by the absorber, its transmission and reflection must be zero. For the zero transmission of the absorber, its metallic layer thickness should be greater than the skin depth. According to the impedance matching theory for the zero reflection, input impedance ( ${z_{in}}$) of the absorber must be equal to the characteristic impedance (
 ${z_o}$) of free space (377 Ω). The reflection coefficient relationship to the
 ${z_{in}}$ and
 ${z_o}$ is given by
 \begin{equation}{S_{11}} = \frac{{{z_{in}} - {z_o}}}{{{z_{in}} + {z_o}}}\end{equation}
From the above equation it is confirmed that the reflection  ${S_{11}}$ becomes zero when
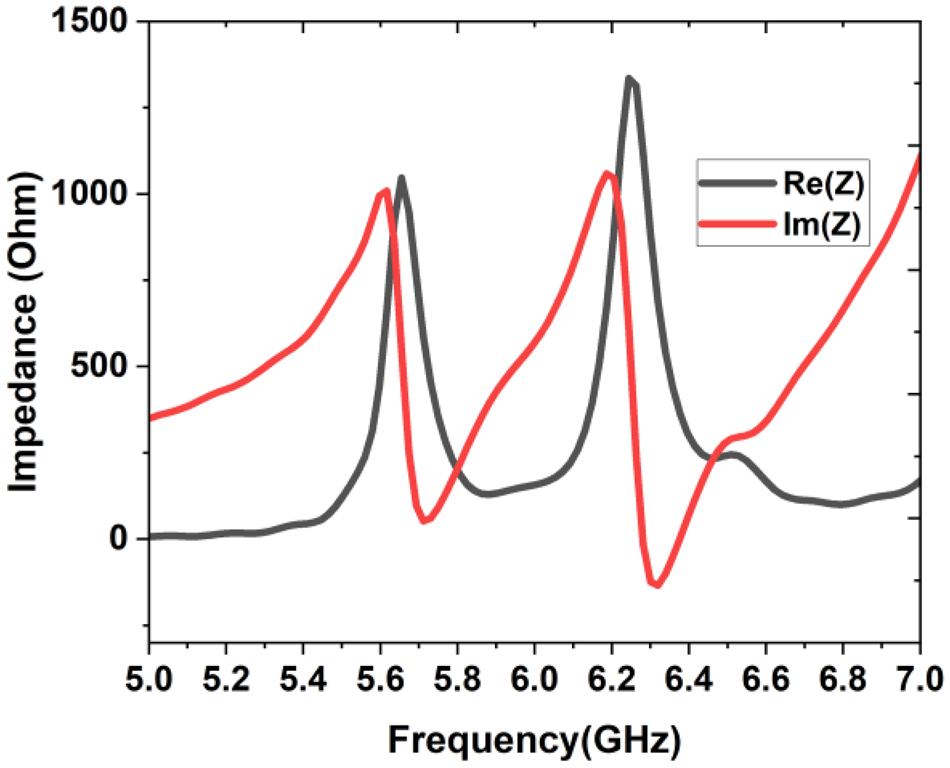
 ${z_{in}} = {z_o}$. For clear understanding of this impedance matching phenomenon, the input impedance across the center frequencies of lower two bands are plotted in Fig. 4. It is observed that the real input impedance curve is reaching 377 Ω while the imaginary input impedance curve is at zero for both the center frequencies 5.73 GHz and 6.35 GHz. From the analysis it is confirmed that
 ${z_{in}} = {z_o}$ at this considered dual band, which makes
 ${S_{11}} = 0$. This is applicable to all the operating bands.
Input impedance of absorber.

Equivalent circuit of absorber
The metamaterial absorber that has been developed is analyzed and assessed through its equivalent circuit. The upper layer of the metamaterial is depicted with a combination of capacitors and inductors, as demonstrated in Fig. 5(a). The equivalent circuit for the quadrant of the unit cell is illustrated in Fig. 5(b) and can be described as follows. The metallic pathways at the top section of the absorber facilitate current flow and produce inductance. The gaps between the metallic regions, where charges accumulate, indicate capacitance. A dielectric substrate along with the lower metal plate is represented by a transmission line and a short circuit, respectively. The three horizontal metallic strips on the upper layer collectively generate inductances L1, L2, and L4, while the gaps between these strips and the ground layer are represented as capacitances C1, C2, and C4. The vertical stub, which connects the three horizontal strips, corresponds to inductance L3, and the space to the bottom ground layer constitutes capacitance C3, as illustrated in Fig. 5(a). The configuration of the equivalent circuit is shown in Fig. 5(b). At the center, a circular zigzag design features three metal elements indicative of inductances L6, L7, and L8, which are linked to the horizontal strip through inductance L5. The space separating the zigzag pattern from the strips represents capacitance C5, while capacitances C7 and C8 are found within and around the zigzag structure. In each quadrant, the circular ring portion paired with the extended central gap represents inductance L9 and capacitance C9, respectively. The absorber experiences inherent losses, specifically conductor and dielectric losses, which can be modeled as resistances R1 and R2. In ADS, the absorption efficiency of the equivalent circuit is fine-tuned through the adjustment of its lumped parameters to align with the results obtained from CST. The tuned values are as follows: C1-1.5pF, C2-500fF, C3-690fF, C4-500fF, C5-880fF, C6-1.26pF, C7-4pF, C8-0.5pF, C9-2pF, C10-2.65pF, L1-3.2nH, L2-500pH, L3-500pH, L4- 500pH, L5-930pH, L6- 600pH, L7-1.34nH, L8-900pH, L9-1.5nH, R1-50 Ω, and R2-25 Ω. The absorber’s unit cell equivalent circuit along with its absorptivity characteristics is depicted in Fig. 5(c) and (d).
Absorber’s (a) design, (b) a quadrant equivalent circuit, (c) unit cell equivalent circuit, (d) comparison of ADS vs CST results.

Figure 5(d) illustrates the response generated by the proposed structure as obtained from the CST simulation, alongside the absorption response of the related electric circuit with the specified component values. Despite a slight adjustment in the chosen frequency range, both responses appear to closely match one another. Therefore, the alignment between the CST and ADS simulation responses confirms the validity of our observations and findings. The input impedance of the absorber from the upper layer can be determined by
 \begin{equation}{Z_{in}} = \frac{{{Z_p} + \,j{Z_s}{\text{tan}}\left( {\beta h} \right)}}{{{Z_p}\,.\,\,j{Z_s}{\text{tan}}\left( {\beta h} \right)}}\end{equation}
Where  ${Z_p}$ is the equivalent impedance of top metallic layer,
 ${Z_s}$ is the characteristic impedance of FR4 substrate,
 $\beta \,and\,h$ are the phase constant and thickness of FR4 substrate. The
 ${Z_p}$ can be determined through the following equation
 \begin{equation}{Z_p} = \,j\omega {C_1} + \frac{{j\left( {1 + {\omega ^2}{C_9}{L_9}} \right)}}{{\omega {L_9}}} + {Z_t} + {R_1}\end{equation}
Where  ${Z_t}$ is the internal impedance of top layer which can be computed by
 \begin{align}{Z_t} &= \left( \left( {j\omega {L_1} + j\omega {C_2} + \frac{1}{{j\omega {L_2}}} + j\omega {L_3}} \right)j\omega {C_3} + j\omega {C_4} \right.\nonumber\\ &\,\quad + \left. \frac{1}{{j\omega {L_4}}} + j\omega {L_5} + \frac{1}{{j\omega {C_5}}} + {Z_{LC}} \right)j\omega {C_{10}}\end{align}
From the determined input impedance  ${Z_{in}}$ of the absorber and characteristic impedance of free space
 ${Z_0}$, the reflection coefficient
 ${S_{11}}$ in decibel can be calculated using
 \begin{equation}{S_{11}} = 20lo{g_{10}}\left( {\frac{{{Z_{in}} - {Z_0}}}{{{Z_{in}} + {Z_0}}}} \right)\end{equation}
The absorptivity is being computed by using equation (1) from the linear value of reflection coefficient. The full wave simulation is done using CST, and it has been compared with equivalent circuit simulation done with ADS software.
Results and discussion
The impact of the structural parameters of the absorber on its absorption peaks and resonance positions is demonstrated with stage 3 of absorber design and its corresponding circuit presented in Fig. 6(a) and (b). The gradual increase in ring radius causes the lower absorption peaks to shift towards the lower end of the spectrum, as illustrated in Fig. 6(c). This phenomenon occurs due to the rise in capacitance, as indicated by equation (7).
 \begin{equation}C = \frac{{\varepsilon A}}{d}\end{equation}
Parametric analysis (a) stage 3 absorber, (b) equivalent circuit, (C) R1, (d) L1.

In Fig. 6(a), the capacitance C4 is established between the metal components L3 and L5 due to their separation distance d. An increase in the ring radius (R1) from 3 mm to 3.6 mm raises the capacitance C4 from 0.15pF to 1.76pF, which subsequently increases the equivalent capacitance ( ${C_{eq}}$) in equation (8). Since
 ${C_{eq}}$ is inversely related to frequency, the frequency decreases as the radius (R1) increases.
 \begin{equation}f = \frac{1}{{2\Pi \sqrt {{L_{eq}}{C_{eq}}} }}\end{equation}
Similarly, as shown in Fig. 6(d), an increase in length L1 leads to a rise in the capacitance C7 between neighboring quadrants from 1.45pF to 3.9pF. This reduction in  ${C_{eq}}$ consequently lowers the operational frequencies in accordance with equation (2). On all eleven bands of 2.425 GHz, 5.73 GHz, 6.35 GHz, 7.95 GHz, 10.386 GHz, 12.38 GHz, 14.7 GHz, 15.4 GHz, 16.15 GHz, 17.65 GHz, 19.48 GHz, the absorber achieves 88%, 90%, 98%, 79%, 91%, 94%, 99.9%, 85%, 97%, 90%, and 96% absorption, respectively, at normal incidence of the electromagnetic wave. The proposed absorber’s polarization-insensitive behavior is showcased by altering the polarization angle (ɸ) for both TE and TM modes. In Figs. 7(a) and 8(a), modifying ɸ for both modes without any change in absorption highlights the absorber’s independence from polarization. By adjusting the slanted incidence angle (ɵ) of the electromagnetic wave while maintaining a constant polarization, the effective coverage angle of the absorber for TE and TM modes can be evaluated, as shown in Figs. 7(b) and 8(b), by comparing measurement results with simulations.
Absorptivity for TE mode at different angles of (a) phi, (b) theta.

Absorptivity for TM mode at different angles of (a) Phi, (b) theta.

The surface current distribution at three specific frequencies, namely, 2.425 GHz, 6.35 GHz, and 16.15 GHz is illustrated in Fig. 9. Examining the surface current is crucial for understanding the performance of the proposed absorber. As shown in Fig. 9(a), the outer stubs in each quadrant of the top layer exhibit the highest current flow at 2.45 GHz. For the third resonance peak at 6.35 GHz, the external current is observed to be most concentrated at the edge of the inner ring, gradually diminishing toward the outer edge, as indicated in Fig. 9(b). During the eighth absorption peak, occurring at 16.15 GHz, the distribution of surface current in the top layer is assessed. It has been identified that at the seventh absorption peak, also at 16.15 GHz, the surface current concentration is greatest at the inner cylindrical rings. In contrast, Fig. 9(c) reveals that the current is ineffectively spread across the outer surface. The quality factor of the absorption bands can be calculated using
 \begin{equation}Q = \frac{f}{{FWHM}}\,\end{equation}
Surface current distribution at the frequency of (a) 2.425 GHz, (b) 6.35 GHz, and (c) 16.15 GHz.

The third band located at a central frequency of 6.35 GHz has a full width at half maximum (FWHM) of 0.07 GHz (from 7.31 to 7.38). Its quality factor has been measured at 90.71, which guarantees a maximum absorption rate of 98% within this narrow band.
The constructed absorber consists of 900 unit cells arranged over an area of 300 × 300 mm2. As illustrated in Fig. 10(a), the measurement setup includes horn antennas at both the transmitting and receiving ends, positioned 2 meters apart, with the manufactured prototype situated in between. The angular rotation of the transmitting horn is controlled by a PC that is connected to it. After careful calibration, the VNA is linked to the receiving horn for S11 measurement. Figure 10(b) presents a comparison between the simulated and measured absorptivity. Absorptivity less than 0.9 can be perfectly acceptable for secondary bands, band edges, or non-critical bands, as long as the primary target bands meet ≥0.9. These multiband designs often navigate trade-offs between bandwidth, the number of bands, thickness, and fabrication limitations. In order to ensure a compact or lightweight structure, some bands may have absorptivity lower than 0.9. The proposed absorber is engineered to function across S, C, X, Ku, and K Bands. It has been confirmed to possess one or multiple narrow bands within the targeted microwave ranges. For the S band (2–4 GHz), the presence of a single band indicates an absorptivity of 0.88. In the C band (4–8 GHz), three bands are identified with peak values of 0.9, 0.98, and 0.79. For the X band (8–12 GHz), a single band shows an absorptivity of 0.92. In the Ku band (12–18 GHz), four bands exhibit absorptivity greater than 0.9, except for one band with an absorptivity of 0.85. Finally, in the K band (18–27 GHz), there is a single band with a peak value of 0.99. Therefore, in the designed absorber, at least one band within the specified frequency ranges (S, C, X, Ku, and K Bands) demonstrates an absorptivity of nearly or above 0.9. Thus, in the case of tunable or frequency-selective absorbers, a band characterized by an absorptivity of 0.7–0.8 may still be deemed acceptable when optimized for other features like multiband, bandwidth, angular independence, or sensitivity to polarization.
Simulation and measurement result (a) measurement setup, (b) comparison.

Benefits of microwave imaging and sensing
Broadband absorption is often a crucial requirement for microwave applications, especially in reducing radar cross-section (RCS) and providing electromagnetic interference (EMI) shielding. By incorporating multiple absorption peaks, the effective absorption spectrum of the material is expanded. Each peak corresponds to a resonance at a specific frequency, and when these resonances are appropriately spaced and overlapped, the structure can achieve near-unity absorption across a wide frequency range. This broad response enhances the performance of the absorber in various operating bands for multipurpose microwave devices.
In sensing applications, the absorption peaks of a metamaterial absorber show a significant sensitivity to changes in the electromagnetic environment, such as variations in permittivity, permeability, or the presence of analytes near the surface. When an external factor alters these properties, the corresponding resonant frequencies experience a measurable shift. The presence of multiple absorption peaks enhances the resolution and selectivity of the sensing, facilitating the simultaneous detection of various parameters or substances, the confirmation of sensing results through comparative peak analysis, and greater resilience against false positives since shifts in multiple peaks can validate the existence of a specific interaction.
Biosensor
The absorber described in this article is miniaturized to operate in the THz range, featuring multiple distinct absorption bands between 1 and 10 THz. The substrate, made of polyimide and measuring 18 µm in thickness, is sandwiched between two metallic layers that are similar in dimensions to the GHz absorber, with parameters of C = 7.2 µm, L1 = 11.5 µm, L2 = 18.5 µm, L3 = 18.5 µm, R1 = 2 µm, R2 = 7.5 µm, and R3 = 6 µm. This biosensor has a periodic structure with a spacing of 25 µm. Figure 11(b) illustrates the corresponding absorption response of the biosensor.
Biosensor (a) perspective view, (b) absorption spectrum.

Multiplexed sensing can be achieved with a multiband biosensor by identifying various analytes at distinct frequencies, thereby lowering costs and speeding up analysis. Certain frequency bands may exhibit more significant shifts for specific analytes. The multiband sensing approach facilitates the optimization of the most responsive band for each analyte. Furthermore, assessing a single target across various frequencies enhances reliability and reduces the risk of false positives. The proposed biosensor combined with an absorber utilizes the 7.58 THz band for sensing due to its significant shift. This THz absorber is designed with tuning functionalities and optimizations for angular and polarization stability. For these reasons, achieving an absorptivity of ≥0.8 can prove advantageous for a secondary band when used in addition to enhance reliability.
The cross-sectional illustration of the proposed absorber featuring an analyte on top for sensing applications is presented in Fig. 11(a). The distinct and pronounced absorption peaks of the proposed absorber endow it with exceptional sensing abilities. This attribute enables the absorber to detect various types of cancer cells by functioning as a biosensor. At the top of the absorber, representing the cancer tissue, there is an analyte layer with a thickness of 5 µm. Normal cells and cancerous cells exhibit differing refractive indices (RIs). The absorption peak experiences a shift across the relevant spectrum in response to changes in the analyte’s refractive index (RI). Figure 12 illustrates how the absorption peaks for different cancer cells at 7.58 THz vary from those of normal cells. Unlike normal cells, which possess a RI of 1.36 and a resonance peak at 7.42 THz, basal carcinoma cells show a RI of 1.38 and corresponding peaks at 7.39 THz, as depicted in Fig. 12(a). In Fig. 12(b), the MCF-7 cancer cell and a normal cell are contrasted, showing refractive indices (RIs) of 1.399 and 1.385, along with a resonance peak shift from 7.405 THz to 7.43 THz. Regarding breast cancer and normal cells, which have refractive indices of 1.401 and 1.36 respectively, Fig. 10(c) depicts the shift in resonance peak from 7.39 THz to 7.48 THz. As illustrated in Fig. 12(d), a cervical cancer cell has a refractive index of 1.392 and an absorption peak at 7.41 THz, while a normal cell has a peak at 7.44 THz with a RI of 1.368. In comparison to normal cells, which possess a refractive index of 1.376 and a resonance peak at 7.42 THz, the Jurkat cancer cells depicted in Fig. 12(e) exhibit a RI of 1.39 with resonance peaks at 7.405 THz. Figure 10(f) compares the PC-12 cancer cell with a normal cell, revealing RIs of 1.395 and 1.381 respectively, along with a shift in the resonance peak from 7.385 THz to 7.45 THz. The sensitivity of this biosensor for detecting cancer cells can be calculated by
 \begin{equation}S = \frac{{\Delta {f_r}}}{{\Delta n}}\,\end{equation}
Absorption peaks of biosensor for various cancer cells with respect to normal cells (a) basal, (b) MCF-7, (c) breast, (d) cervical, (e) Jurkat, (f) PC-12.

The sensitivity of this biosensor has been assessed for various cancer cell types, showing results of 1.5 THz/RIU for basal cancer, 1.79 THz/RIU for MCF-7 cancer, 2.25 THz/RIU for breast cancer, 1.25 THz/RIU for cervical cancer, 1.07 THz/RIU for Jurkat cancer, and 4.64 THz/RIU for PC-12 cancer detection. The proposed research project is compared with earlier published studies as shown in Table 1. According to Table 1, the proposed absorber contains multiple bands, achieving a maximum absorption of 99.9% and a Q factor of 92.5. This absorber, composed of cost-effective FR4 dielectric material, is unique in its capability for biosensing at GHz frequencies.
Comparison of proposed work with similar literature

Frequency tuning is essential in biosensors to improve detection precision, sensitivity, and selectivity by aligning or scanning the ideal response frequency. A biosensor functions optimally at particular frequencies. When an analyte, such as human tissue, attaches to the sensor’s surface, it alters the dielectric characteristics, resulting in a change in resonant frequency. Therefore, measuring the electric field at a constant frequency proves challenging, necessitating frequency adjustments for various tissues to determine accurate value. This issue can be addressed by integrating a tuning mechanism in the biosensor utilizing graphene. Using graphene to modify the frequency enables the sensor to monitor these variations with enhanced sensitivity. The simulation outcomes for the biosensor indicate a minor frequency shift across different cancer tissues. To ensure accuracy in sensing, this small variation can lead to unwanted shifts in the targeted results if not properly monitored; therefore, a graphene-based tuning approach has been employed to counteract this frequency change. Consequently, a detailed tuning mechanism along with a structural overview is given below.
To achieve tunability, graphene has been incorporated into specific positions in the top layer of the absorber, as illustrated in Fig. 13(a). This tuning effect is essential for maximizing frequency coverage within the desired bandwidth. Since graphene is conductive, incoming light stimulates surface plasmons on the graphene, resulting in improved absorption. The conductivity of graphene can be expressed as
 \begin{equation}\sigma = \frac{{j{e^2}{\mu _c}}}{{\Pi h\left( {\omega + \frac{j}{\tau }} \right)}}\end{equation}
Graphene integrated absorbers (a) schematic, (b) absorptivity for various chemical potential of graphene.

where e is the electron charge,  ${\mu _c}$ is the chemical potential of graphene, h is the Planck’s constant,
 $\omega $ is the angular frequency and
 $\tau $ is the relaxation time of graphene. The
 ${\mu _c}$ can be expressed as
 \begin{equation}{\mu _c} = h{v_f}\sqrt {\frac{{\Pi {\varepsilon _0}{\varepsilon _r}{v_g}}}{{e{t_g}}}} \end{equation}
The equation indicates that the external bias voltage and Fermi velocity ( ${v_f})$ are factors that influence the chemical potential of graphene. By adjusting the external bias voltage applied between the graphene and the bottom ground plane, the properties of graphene can be modified. This results in a different frequency response due to variations in its chemical potential. Figure 13(b) illustrates how the response of the absorber changes when the chemical potential of graphene is varied. It has been observed that as the chemical potential (
 ${\mu _c}$) rises, the entire absorption spectrum shifts to the right. For tuning the absorption frequencies, apply a voltage source between the graphene layer and the gate electrode as shown by Fig. 14; the metal gate is generally situated beneath the dielectric layer, located directly under the graphene, creating a structure similar to a capacitor. The voltage applied to the gate generates an electric field across the dielectric, leading to the induction of charge carriers within the graphene. By adjusting the gate voltage (up to 4 V), the Fermi level (chemical potential, µ_c) is shifted either upward or downward. This change in the chemical potential correlates with the carrier concentration, as expressed in equation (13).
 \begin{equation}{\mu _c} = h{v_f}\sqrt {\Pi n} \end{equation}
Where  ${\mu _c}$ is the chemical potential,
 ${v_f}$ is the fermi velocity, n is the electron density. When the chemical potential is adjusted, the optical conductivity of graphene and consequently its absorption frequency are altered. The carrier density can be described using equation (14).
 \begin{equation}n = \frac{{{\varepsilon _0}{\varepsilon _r}{v_g}}}{{e{t_g}}}\end{equation}
To apply an external voltage uniformly across multiple points on the absorber surface for tuning the frequency, a graphene sheet is positioned above the absorber and makes contact with elevated graphene strips. Given that graphene is very transparent to THz waves, the biosensor’s absorption characteristics remain unaffected. The block diagram that depicts this external biasing method is shown in Fig. 14. Figure 14 also illustrates a straightforward approach for applying external voltage to the unit cell, which can be adapted for a multicell absorber of larger size. The regulated power supply (RPS), serving as a voltage source, is connected to the absorber so that the positive terminal of the RPS is linked to the graphene via a conductive wire, while the negative terminal connects to the bottom metallic ground plane of the absorber, functioning as a gate electrode. By adjusting the voltage of the RPS using its knob, a noticeable change in the absorption frequencies can be observed.
External voltage applied to graphene (a) side view, (b) top view.

Figure 15 examines the impact of relaxation time on the absorption response due to the equation-described dependence of graphene conductivity on relaxation time. The absorption bands do not significantly vary, with the exception of a small departure in the bottom bands. However, as relaxation time increases, there is a little increase in absorption in the upper bands. This is because the surface plasmons in coherence with incident photons cause the maximum coupling between them.
Absorptivity for different relaxation time of graphene.

Microwave imaging
The method of microwave imaging (MWI) can be employed to detect cancer cells. This technique provides high-quality, real-time observations of the interaction between cells and terahertz waves, making it a promising strategy for early cancer diagnosis. Since cancerous tissues hold a higher water content, they absorb more energy from terahertz waves than normal tissues, which contain less water. As a result, cancer cells display a stronger electric field compared to normal cells. This distinguishing feature between cancerous and healthy cells is a crucial element in differentiating them.
Figure 16(a) illustrates the biosensor alongside the analyte of healthy human tissue, with cancer cells indicated on the left in red. The configuration of the analyte on the biosensor is depicted in Fig. 16(b), where THz waves are directed towards it. Figure 17 illustrates the ability of the biosensor to differentiate between healthy and cancerous cells by using electric field (E-field) at a frequency of 7.58 THz. A notably dense circular area of the electric field is presented in Fig. 17(a), demonstrating the high sensitivity of the developed sensor to cancer cells. In contrast, the electric field concentration in the healthy tissue is low and relatively steady, as depicted in blue. The elevated electric field density in cancerous tissue arises from the interaction of electromagnetic waves with the greater liquid content of cancer cells, leading to maximum absorption of the incoming wave power, as represented by the reddish-yellow color. This pronounced electric field across the cancer cells highlights the exceptional efficiency of the proposed sensor for biosensing applications. Figure 17(b) portrays a frontal view of electric field imaging of human tissue affected by cancer. This suggests that by utilizing electric field measurements, MWI can effectively differentiate healthy tissue from cancer-affected tissue. Table 1 illustrates a comparison of the proposed work against similar studies found in the literature. This research excels compared to other related studies regarding the compactness of its absorber, the number of bands, Q-factor, and sensitivity of biosensor.
Schematic of biosensor with analyte (a) perspective view, (b) side view.

Electric field (e-field) imaging of human tissue with cancer (a) perspective view, (b) top view.

Fabrication process of THz absorber
The sensor or absorber utilizes nanoprocessing technology for its production. The materials employed in the creation of this THz sensor include metal, photoresist, and a polyimide substrate. The fabrication process is described as follows: A substrate made from high-resistance polyimide material is selected. Photoresist is spin-coated on top of the substrate, followed by a baking process at 100°C using a dryer. During the photolithographic procedure, the photoresist is subjected to ultraviolet light, allowing the exposed areas to be etched to develop the wafer over the substrate. In the evaporation coating step, metal is deposited onto the surface of the substrate along the etched sections of the photoresist. The photoresist is then dissolved with an acetone solution, leaving only the metallic pattern on top of the substrate. Finally, a metallic layer that serves as a ground plane is deposited on the opposite side of the substrate through a thermal evaporation process, resulting in the finished sample.
Fabrication challenges
The electromagnetic response at THz frequencies is influenced by grain boundaries and surface roughness in the metallic layers. These imperfections can lead to reduced conductivity, increased losses, and diminished performance. To achieve smooth and uniform metallic layers, high-quality thin-film deposition techniques must be employed. Polyimide substrates are commonly utilized for THz absorbers or sensors. However, their softness, heat sensitivity, and poor adhesion with metallic layers complicate the manufacturing process. Accurate alignment between layers is essential for the multilayer architecture of compact absorbers. Any misalignment can lead to issues with mode coupling and affect the distribution of electromagnetic fields.
Conclusion
A multiband absorber featuring multiple resonance peaks covering S, C, X, Ku, and K Bands has been studied and validated through comparisons of modeling results and measurements. This absorber has demonstrated its capability to act as a biosensor for differentiating between various types of cancer cells. The proposed absorber/biosensor exhibits a peak sensitivity of 4.64THz/RIU for the detection of PC-12 cancer cells. Both simulated and experimental results indicate that the absorber achieves peak absorption levels of 88%, 90%, 98%, 91%, 94%, 99.9%, 85%, 97%, 90%, and 96% at frequencies of 2.425 GHz, 5.73 GHz, 6.35 GHz, 10.386 GHz, 12.38 GHz, 14.7 GHz, 15.4 GHz, 16.15 GHz, 17.65 GHz, and 19.48 GHz, respectively. By minimizing the unit cell area of the absorber to 0.0068λ2, its performance can be improved by fitting more unit cells within the same area.
Data availability
Data are available with the authors. On request, it will be given
Funding statement
No fund is obtained from any financing organization.
Competing interests
The authors declare that they have no conflict of interest.
Ethics statement
This work is original. It is submitted only to this journal and not present elsewhere.

Balu Ashvanth received his BE degree from Anna University, Chennai, in the year 2008, MTech degree from Pondicherry University in the year 2010, and PhD degree from Anna University, Chennai, in the year 2020. He is currently serving as Associate Professor in the Department of Electronics and Communication Engineering, Vel Tech Rangarajan Dr. Sagunthala R&D Institute of Science and Technology, Chennai, India. His research areas of interest include analysis and design of antennas, absorbers, and frequency selective surfaces for emerging applications.

Bactavatchalame Partibane received his BE degree in ECE from Madras University, Chennai, in 1999, and the MTech degree in ECE from Pondicherry University, Pondicherry, in 2003. Furthermore, he obtained doctoral degree from Anna University, Chennai, in 2017. He currently holds an academic post as Associate Professor in the department of ECE, SSN Institutions. His research interests include wireless communication and networks, antenna engineering, and security in ad hoc and sensor network.

M Sankar received his BE in Electrical and Electronics Engineering from Madurai Kamaraj University, Madurai, India, his MTech in Computer and Information Technology Engineering from Manonmaniam Sundaranar University, Tirunelveli, India, and his PhD in Information and Communication Engineering from Anna University, Chennai, India. His current research interests include image processing, deep learning, VLSI design, embedded systems, Internet of Things (IoT), and machine learning.