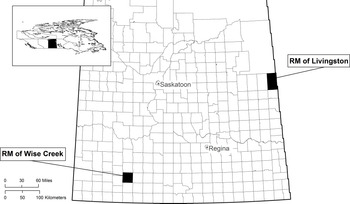
In the travelogue of his journey through the Canadian prairies in 1870, William Francis Butler compared the prairies with the sea, writing “the ocean is one of grass … [where] the great ocean itself does not present more infinite variety than does this prairie-ocean” (Butler Reference Butler1872: 199). The flat expanse of land has become a stereotype of Saskatchewan, and one that holds true in the Rural Municipality (RM) of Wise Creek, where only the occasional wetland interrupts fields of grain and pastures. Yet 300 miles northwest, the RM of Livingston presents a much different view of the prairies, with small hills interrupting Saskatchewan’s apparently endless horizon and giving slope to the cultivated fields. Wise Creek and Livingston showcase common experiences of agriculture in Saskatchewan. These two rural municipalities (figure 1) serve as case studies to investigate 85 years of prairie agricultural practices from 1916 through 2001. Abundant soil nitrogen provided farmers with high crop yields so that throughout the twentieth century prairie agriculture made Canada one of the top ten grain exporting nations in the world (US Department of Agriculture 2016: 6). Intensive agricultural settlement of the Canadian prairies began in the late 1880s, and by the 1910s Canada had become one of the main breadbaskets of the British Empire (Friesen Reference Friesen1984; Waiser Reference Waiser2005).
Scholarship on agricultural settlement in the Canadian prairies focuses on the economics of farming, with an emphasis on wheat, particularly before 1950. Historical overviews like The Canadian Prairies (Friesen Reference Friesen1984) and Saskatchewan: A New History (Waiser Reference Waiser2005) take a social history approach with an emphasis on settling the prairies for agriculture. More economically focused work like Canadian Agriculture in War and Peace, 1935–50 (Britnell and Fowke Reference Britnell and Vernon1962) and When Wheat Was King (Magnan Reference Magnan2016) do not address agricultural conditions at the ground level but focus on commodity markets and their interaction with government policies. Fowke, in The National Policy and the Wheat Economy (1957), also employs this policy approach. Ian MacPherson and John Herd Thompson (1992) address the prairie agricultural structure from a socioeconomic perspective, arguing that changing agricultural markets led to changes in farming practices. More recently, a local history (McManus Reference McManus2011) studied the consequences of drought for the RM of Happyland, Saskatchewan, during the 1920s and 1930s centering on the social and economic consequences of drought in an agriculturally focused RM. The scholarship seeks to explain why farmers choose to produce certain crops and livestock as well as the changes in those production mixtures overtime. The results of these shifts on soil, however, remain largely unexplored. Geographers, such as Adrian Seaborne (Reference Seaborne2001), and plant scientists (Zentner et al. Reference Zentner, Wall, Nagy, Smith, Young, Miller, Campbell, McConkey, Brandt, Lafond, Johnston and Derksen2002a, Reference Zentner, Lafond, Derksen and Campbell2002b) examined the consequences of agricultural practice on soils, however, these studies focused on present-day issues without a long-term historical context. This article presents a historical examination of the consequences of agricultural practices on Saskatchewan’s soil nitrogen content by examining nine decades of yields to track soil nitrogen content in the RMs of Wise Creek and Livingston.
Nitrogen (N) is by far the most critical mineral nutrient component for agriculture because N levels are “often the most limiting factor” (Blumenthal et al. Reference Blumenthal, Baltensperge, Cassman, Mason, Pavlista, Hatfield and Follett2008: 51) for crop yields. A crop grown in nitrogen deficient soils turns yellow, wilts, and bows low to the earth. If the nitrogen deficit is great enough, the crop turns into a rotting mass of vegetation without producing grain to harvest. Nitrogen is required for the formation of chlorophyll, which in turn allows plants to utilize sunlight, water, and carbon dioxide to create energy. Equally important, building protein requires nitrogen. Without proteins to provide structure the plant cannot survive. Harvesting agricultural products, like grains, oil seeds, and animals, removes part of these nutrients from the agricultural land system each time there is a harvest. Consequently, to maintain agricultural productivity it is important to replenish nitrogen. This article estimates soil nitrogen content in historical farm systems by calculating N inputs and outputs given changes to inputs and outputs, including the amount and type of crops harvested, the number of head of livestock, and the level of fertilizer application, at the level of rural municipalities (García-Ruiz et al. Reference García-Ruiz, Manual, Gloria, David and Juan2012).
This article tracks the amount of soil nitrogen across nearly a century as a way to evaluate whether farming practices returned an equal or greater quantity of nitrogen than these practices removed through harvest and natural denitrification processes. The model for nitrogen calculation follows “Guidelines for Constructing Nitrogen, Phosphorus, and Potassium Balances in Historical Agricultural Systems” (ibid.). The method of analysis for nitrogen levels employs a sustainability science methodology called “socioecological metabolism” (Cunfer and Krausmann Reference Cunfer and Fridolin2016; Cussó et al. Reference Cusso, Ramon and Enric2006; Fischer-Kowalski and Haberl Reference Fischer-Kowalski and Helmut2007; Guzmán et al. Reference Guzmán, Eduardo, David, Antonio, Juan, Antonio, Inmaculada and Manuel2014). This methodology places the agricultural cycle of land cultivation, seeding, and harvest into a larger context of nutrient and energy flows that both act on and are reacted to by the agricultural cycle. By examining the historical trends in nitrogen content and biomass yields, it is possible to estimate whether farming practices were sustainable or whether they promoted the mining of soil through the creation of negative nitrogen balances.
Wise Creek, the first case study area, is located in southwestern Saskatchewan about 185 miles southwest of the province’s capital city of Regina and 125 miles east of Cypress Hills Interprovincial Park on the Saskatchewan-Alberta boarder. It is 325 square miles (843 km2) and had a population of 257 in 2001—a remarkably low population density of less than one person per square mile (0.3 person per square kilometer) (Statistics Canada 2013). The 2001 Agricultural Census reported 106 farms within the rural municipality (Statistics Canada 2001). This was a sharp decline from early in the twentieth century, when the 1916 census showed 1,266 people and 522 farms making a population density of nearly four persons per square mile (1.5 persons per square kilometer) (Dominion Bureau of Statistics 1918: 328). This decline in both population and farms was part of a long-term trend in Canada that began after World War II. The number of farms decreased due to a declining need for labor following increasing mechanization (Shepard Reference Shepard and Marchildon2011). Census data show a decline in horses and a concomitant decline in the hectares of oats that farmers had planted primarily to feed them, which corresponds with growing mechanization. At the same time, average farm size increased, which offset the decline in the total number of individual farms. The area of agricultural land and overall agricultural production levels did not decline, even as fewer people were farming (Statistics Canada 1971, 1981, 1991, 2001, 2016). At the same time, the Canadian population became increasingly urbanized.
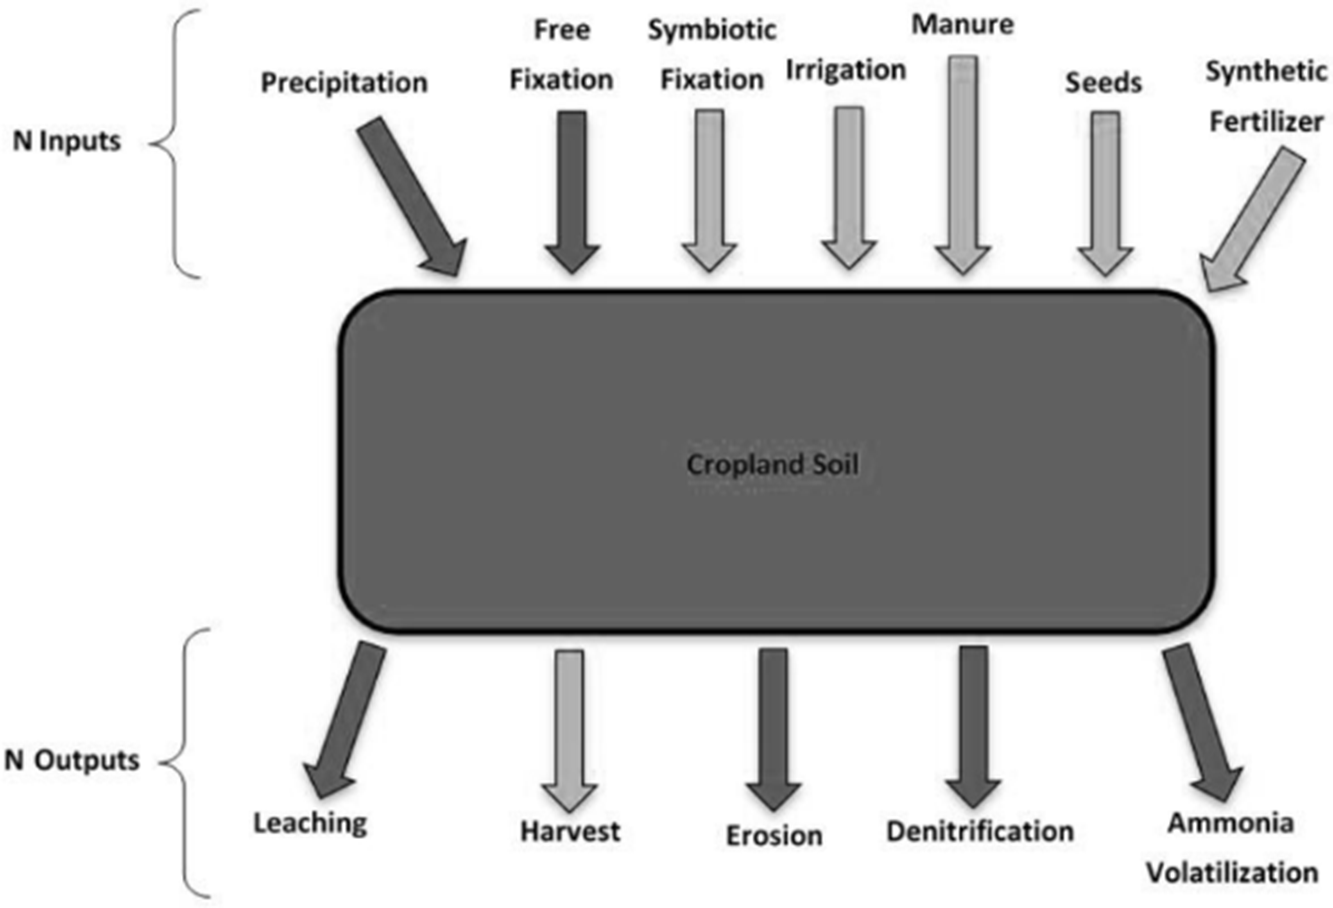
One of the critical parts of successful agricultural practices, regardless of farm size, is balancing the input and output of soil nutrients. This analysis of historical agricultural practices focuses on the inputs and outputs of nitrogen. Nitrogen is complex to calculate because it draws on multiple sources (Cunfer Reference Cunfer2004). Nitrogen can enter the soil from the atmosphere—either blown as dust on the wind or in rain. Also, nitrogen-fixing rhizobia bacteria that live in symbiosis with the roots of legumes contribute nitrogen to soil. Farmers may add nitrogen as a fertilizer, either through animal manure; by ploughing-down green manure, most commonly legumes like clovers, peas, or lentils; or through the application of synthetic fertilizers. While nitrogen can be lost through natural processes such as erosion, in an agroecological model the largest nitrogen loss comes from harvesting crop biomass in the form of grains, straw, and forage. Figure 2 shows the inputs and outputs of nitrogen in an agroecological system. Socioecological metabolism methodology estimates each flow to calculate the nitrogen balance.
Rural Municipalities of Wise Creek and Livingston.

Inputs and outputs of nitrogen.
Note: Dark gray arrows represent natural nitrogen flows, while farmers manage nitrogen flows represented by light gray arrows (Cunfer Reference Cunfer2015: 5).

To begin the analysis of Wise Creek’s soil nitrogen it is necessary to recognize the three most common soil types in the rural municipality. The clay content and bulk density of these soils affect the amount of nitrogen they can store and, more importantly, their base level of nitrogen available before settlement and agriculture began on the Canadian prairies. The Saskatchewan Soil Survey shows that the three most common types of soil in Wise Creek are clay loams, loams, and sandy loams with a bulk density between 1.3 and 1.4 g/cm3, while the clay content ranges between 25 and 29 percent (Canadian Soil Information Service 2013; Saskatchewan Soil Survey et al. 1989: 28).
Annual rainfall is an important part of the nitrogen system. Rainfall deposits small amounts of nitrogen but, more importantly, rainfall is a primary determinant of crop yields in Saskatchewan’s semiarid climate. Water availability limits crop yields. The higher the yield produced, the greater the amount of nitrogen used by the plants. A year of lower plant growth and poor yields means that less nitrogen is used compared to a normal year. The crop in the next year will have access to nitrogen unused by the previous year’s crop. Rainfall data for the RM of Wise Creek comes from Environment Canada’s Shaunavon weather station, the nearest station that covers the complete period under investigation (Environment Canada 2017a). There was a trend of increasing precipitation through the twentieth century. The model bases its calculations on the total amount of precipitation in the year so it does not consider the timing of the precipitation (García-Ruiz et al. Reference García-Ruiz, Manual, Gloria, David and Juan2012).
While precipitation is an important contributor to crop yields, it is not the only necessary factor. Rainfall deposits little nitrogen and blown-in dust even less. The dry deposition is negligible because it is at such a low level and therefore the present calculation does not account for it. For wet deposition, that is the nitrogen brought by rain, the model estimates a base rate of 0.57 grams of nitrogen per millimeter of precipitation. This base rate is combined with the recorded precipitation in the area to find the total wet deposition. For example, in 1961 the annual rainfall in Wise Creek was 221.1 mm, which deposited 126 grams of nitrogen per hectare.
Rhizobia, the symbiotic bacteria that live in the roots of legumes, also generate nitrogen. One traditional agricultural practice was to plant fields to legumes, then plough them into the soil as “green manure” when the plants reached maturity. In Saskatchewan green manure crops were clovers or, more recently, peas. Farmers also used alfalfa but they more typically harvested it for a hay crop. Research on soil plots at Melfort and White Fox, Saskatchewan, found that clovers and alfalfa green manure “returned N to the soil at 60 – 95 kg*ha-1 … if a crop of hay or silage was removed and the stubble worked in, then N was returned to the soil at only 10-20 kg*ha-1” (Campbell et al. Reference Campbell, Zentner, Janzen and Bowren1990: 21). The precipitation level in Wise Creek, however, was not sufficient to support clovers, so farmers rarely used plough down, and never on a large scale. Instead the nitrogen generated by rhizobia came from legume hay crops and field crops.
Farmers also ploughed stubble and straw from harvested crops back into the soil. If the straw was particularly heavy, farmers sometimes burned it losing N in the process. They also burned fields to control weeds on occasion. Burning crop residues was not a widespread practice and was discouraged as early as the 1930s (Saskatchewan Advisory Committee on Agricultural Services 1933: 53). It continues to be regarded as “expensive and damaging,” both economically and environmentally (Government of Saskatchewan Ministry of Agriculture 2008: 1). Burning residues releases nitrogen into the air and the practice can also have other negative effects on soils including a loss of soil microorganisms, promotion of soil erosion, and loss of overall soil organic matter (Bierderbeck et al. Reference Bierderbeck, Campbell, Bowren, Schnitzer and McIver1980).
For hay crops in Wise Creek, farmers grew alfalfa, a legume that tolerates lower precipitation levels, instead of clover. During its growing period, alfalfa contains rhizobia bacteria in its roots, which fix atmospheric nitrogen in the soil. There are also freestanding nitrogen-fixing organisms in soil, but cultivation “limits the establishment of autotrophic free N-fixing organism” (García-Ruiz et al. Reference García-Ruiz, Manual, Gloria, David and Juan2012: 664) which, unlike rhizobia, are not directly associated with legume plants. Thus, nitrogen fixation added 4 kg per hectare to the soil if no cultivation happened, but each time cultivation occurred it removed some nitrogen. This analysis assumes that each crop year the land was cultivated twice, reducing the nitrogen level by half, to 2 kg per hectare for nitrogen-fixing crops (Cunfer Reference Cunfer2015: 5; García-Ruiz et al. Reference García-Ruiz, Manual, Gloria, David and Juan2012: 664–65). Farmers influenced soil fertility based on the area of legumes they planted each year. Thus, the area of legumes planted—in the case of Wise Creek legume hay was the only legume crop—is multiplied by the assumed rate of nitrogen fixation. It is then included in the overall calculation of soil nitrogen levels. In 1961, for example, nitrogen fixing from legumes contributed about 16.9 tons of N in the entire 843 km2 area of the rural municipality, equivalent to 0.3 kg per hectare.
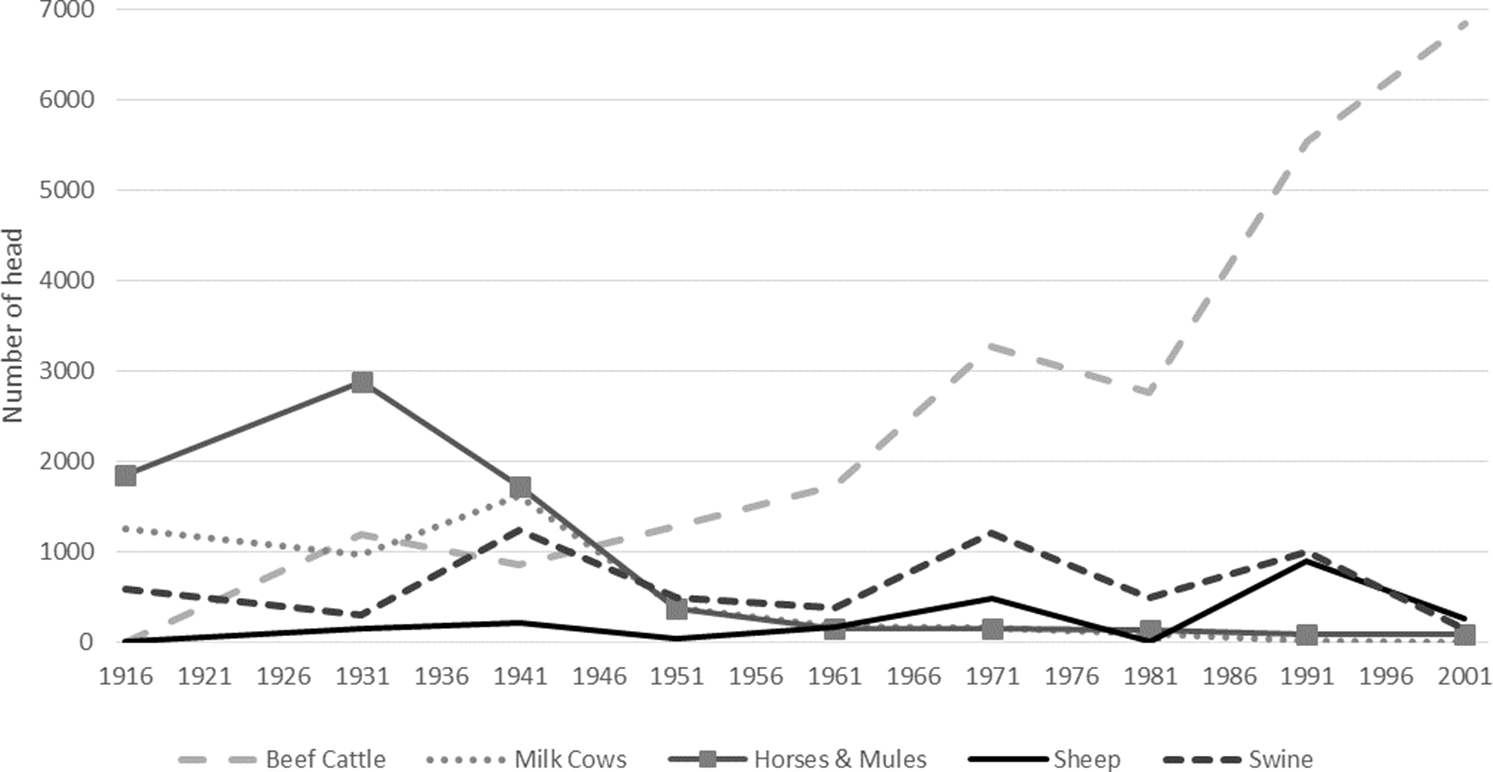
The application of animal manure to fields can also add nitrogen. The model calculates the nitrogen generated from livestock manure. It differentiates between livestock types and calculates the amount of nitrogen produced per head of livestock types (García-Ruiz et al. Reference García-Ruiz, Manual, Gloria, David and Juan2012). The Census of Agriculture provides the head count of each type of livestock, differentiating between beef and dairy cattle (figure 3) (Dominion Bureau of Statistics 1918, 1931, 1941, 1951, 1961; Statistics Canada 1971, 1981, 1991, 2001).
In discussing typical agricultural practices with a longtime farmer familiar with southwest Saskatchewan and the Wise Creek area, it became apparent that beef cattle were contained in relatively small areas from which the manure, along with bedding straw, was emptied onto fields at least once a year (pers. comm., May 25, 2016). Beef cattle often grazed harvested fields to consume the remaining plant material. The calculation of total manure generated by on-farm livestock, therefore, includes manure from beef cattle rather than separating them from dairy cattle as done in the original model. In 1961 10,942 head of livestock, the majority of which were cattle and poultry, generated 42 tons of nitrogen equivalent to an N addition to the soil of 0.8 kg per hectare.
More recently, synthetic fertilizers added nitrogen to the soils. Beginning in 1961, the Census of Agriculture gave the number of fertilized acres, while the information in the Dominion Bureau of Statistics’ (1962, 1972, 1982) annual Fertilizer Trade provided the amount of nitrogen, potassium, and phosphate in fertilizers purchased within the province of Saskatchewan. The Fertilizer Trade provides the longest period for uninterrupted fertilizer data. This historical analysis uses this data rather than RM level data because RM level data is only available for shorter periods. The amount of fertilizer recommend for use was based on the time of application (autumn or spring) compared to the time the crop would use the fertilizer rather than the location within the province where a farmer was applying it (Government of Saskatchewan Ministry of Agriculture 2019). Dividing the total number of fertilized acres in the province by the number of fertilized acres in the RM provides the portion of the total fertilized area within the boundaries of the RM. Multiplying this portion by the total tons of N used in Saskatchewan results in the total tons of N used in the RM. Campbell et al. (Reference Campbell, Zentner, Janzen and Bowren1990: 10) note that “the high fertility levels of prairie soils at the time of original breaking and the frequent use of summer fallow to build up plant-available nutrients resulted in little need or use of commercial fertilizers” before the 1960s.
Adding all the natural and human nitrogen inputs together calculates the total amount of nitrogen inputs. Total nitrogen outputs between 1916 and 2001 in Wise Creek are calculated in the same fashion. The total nitrogen inputs and outputs are the most important calculations in this analysis as they show the consequences for the soil nitrogen level as a result of changes in agricultural practices. While natural processes, such as erosion and leaching, remove nitrogen from the soil, the largest output of nitrogen comes from human-driven crop harvesting (García-Ruiz et al. Reference García-Ruiz, Manual, Gloria, David and Juan2012: 669). Harvesting removes both the crop and the nitrogen it has taken up.
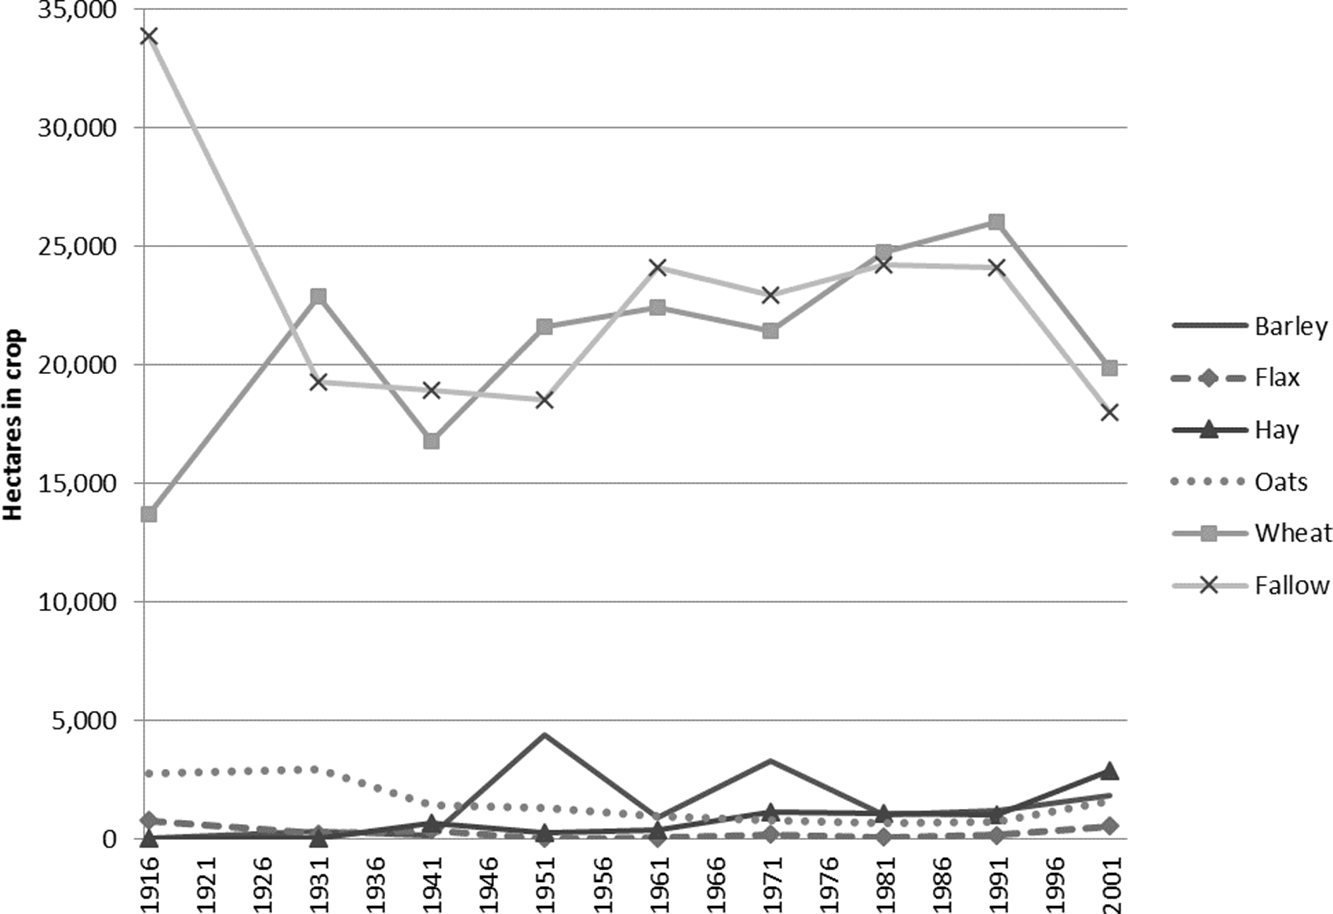
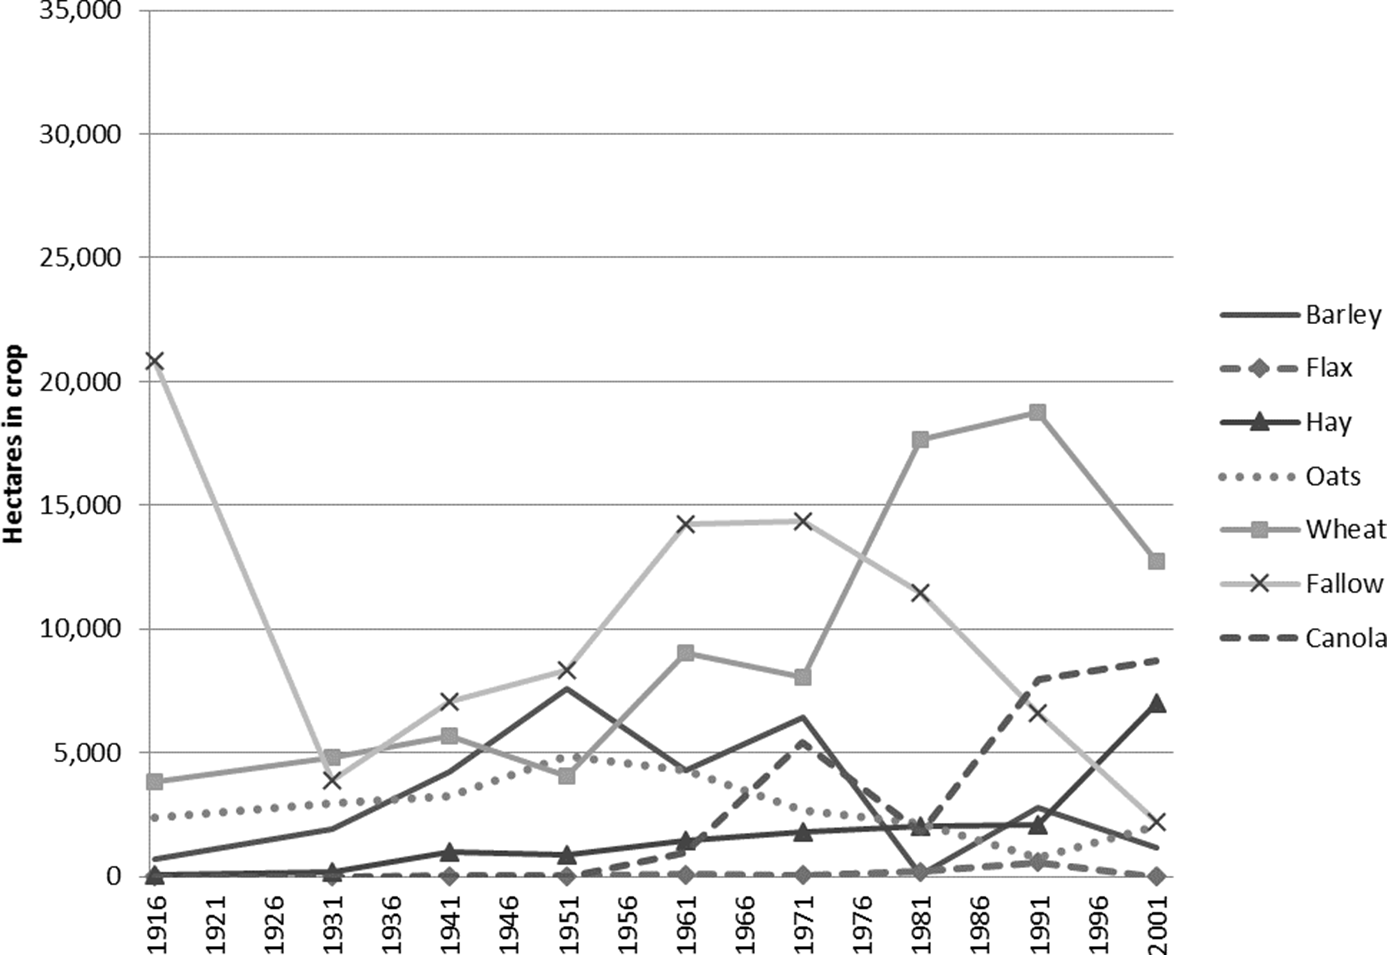
In Wise Creek, the most common crop is wheat, which performs well in the area’s dry climate (figure 4). Farmers plant wheat in rotation with a fallow period, usually one crop year, during which time farmers consider the soil to be at rest because it is not producing a crop. They control weed growth in the unplanted fields with tillage. Fallow was also a way to rest the soil and conserve soil moisture. Conservation of soil moisture is particularly important in areas such as Wise Creek where precipitation is limited. Agricultural outreach and extension work in Saskatchewan emphasized the importance of fallowing. The 1933 Guide to Saskatchewan Agriculture, for example, described fallow as “indispensable in order to provide a sufficient reserve of moisture in the soil for crop needs” (Saskatchewan Advisory Committee on Agricultural Services 1933: 43). In wetter areas, farmers planted clovers or other legume crops to plough back into the soil as green manure to improve nutrients and organic matter content of the soil. Farmers harvested barley, oats, and flax, although wheat was by far the largest cereal crop under cultivation in the area (Government of Saskatchewan Ministry of Agriculture 2016). After 1991 hay also became an important harvest.
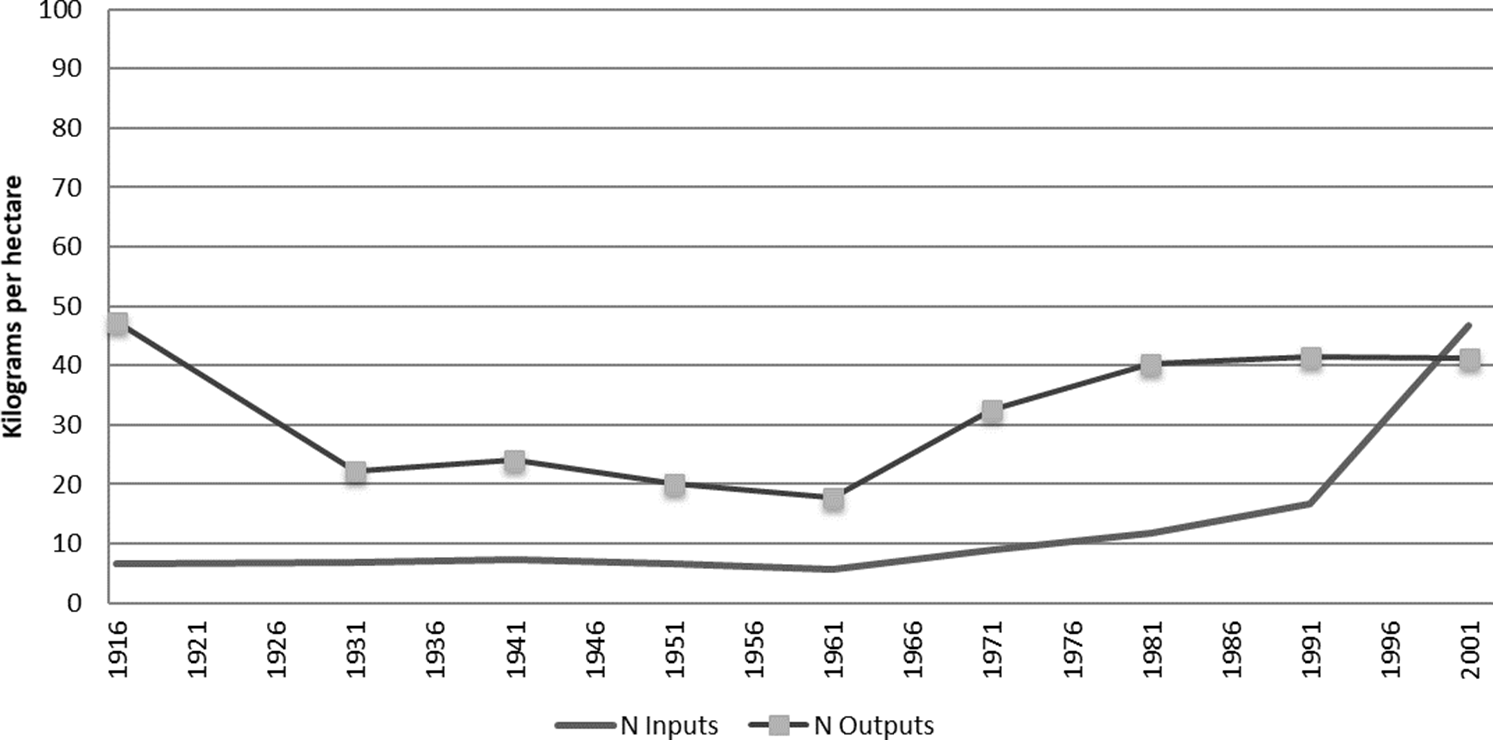
Ideally, the amount of nitrogen inputs should equal the amount of nitrogen outputs so that the level remains steady in the soil, creating a neutral balance of nitrogen in the agricultural practice. Until the mid-1990s, however, the output or removal of nitrogen significantly exceeded the input of nitrogen (figure 5). This difference between input and output shows agricultural practices in Wise Creek mined the soil of its existing nitrogen. Nitrogen outputs declined between 1941 and 1961. The application of synthetic nitrogen in 1961 then raised nitrogen inputs, which also resulted in increased nitrogen outputs. This change to the inputs and corresponding change in outputs suggests that prior to the application of synthetic nitrogen there had been substantial depletion of the preexisting nitrogen in the soils. Historically low yields prior to 1961 began increasing after the introduction of chemical fertilizers, suggesting that this new technology was beginning to make up for depleted soil nitrogen.
Livestock in Wise Creek.

Hectares under crop in Wise Creek.

Nitrogen inputs versus nitrogen outputs in kilograms per hectare in Wise Creek.

Subtracting the outputs from the inputs finds the net balance of nitrogen in kilograms per hectare. The net balance is an important calculation as it shows the nitrogen that remains once farmers have removed (outputs) and added (inputs) nitrogen. Here nitrogen outputs consistently exceeded nitrogen inputs, resulting in a negative balance.
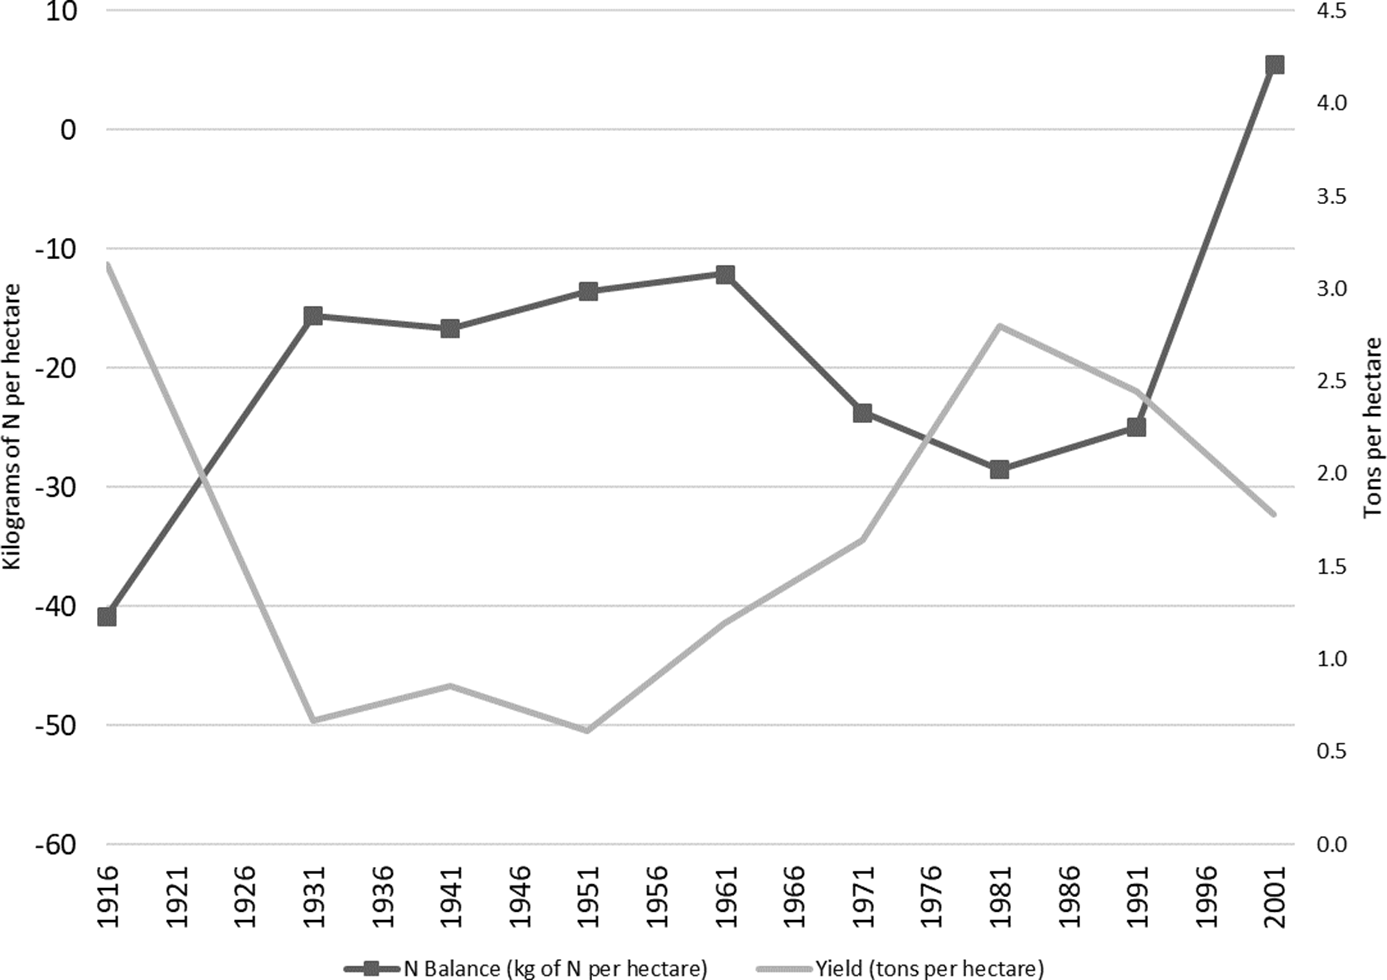
Figure 6 compares the net balance of kilograms of nitrogen per hectare to the total biomass yield calculated in tons per hectare. The Agricultural Census reports the acres and hectares of crops planted, while the Government of Saskatchewan Ministry of Agriculture (2016) reports the yield of each crop, typically in bushels per acre, in each rural municipality. From these data it is possible to calculate the total yield in bushels per acre of each crop and then convert to tons per hectare. This yield is only the usable product (grain) but from that information crop residues (straw) are calculated. Adding the usable product and residues together provides the total biomass produced in tons for the RM. Adding the hectares of cultivated crops together calculates the total cropland area. Dividing the total biomass produced by the total cropland area calculates the yield for the RM shown in figure 6. The yield in figure 6, therefore, is the tons of biomass produced per hectare. Using the biomass yield is important for this analysis as it includes all biomass produced rather than just the usable product measured by crop yield.
Nitrogen balance (kg of N per hectare) versus yield (tons per hectare) in Wise Creek.

The first census year, 1916, reveals the beginning of a typical soil mining process, as there was a large gap between the nitrogen balance and the amount of biomass yield. After 1931 the amount of nitrogen removed stabilized between –15 and –10 kg/ha/year, as the soil mining proceeded at a slower pace once yields stabilized at a relatively consistent level. In Wise Creek, chemical fertilizer use first appeared in the census in 1961. As a consequence, there was increased biomass yield even as the nitrogen balance worsened because the greater yields required more nitrogen, not all of which was offset by the addition of synthetic nitrogen. The N balance declined from –12 kg/ha to –24 kg/ha between 1961 and 1971. Chemical fertilizer use increased sharply between 1991 and 2001, while yields declined from their 1981 high point. Because the addition of more nitrogen did not increase yields beyond a certain point, there may have been significant depletion of the preexisting soil fertility that synthetics could not replace. Biomass yields never returned to the levels of the early settlement period, no matter how much synthetic fertilizer farmers applied. The initial production high was the result of using nitrogen stored in the soils over the previous centuries. In 85 years the overall biomass yield declined to 1.8 tons per hectare by 2001, just a little more than half of the 3.1 tons per hectare yield Wise Creek had enjoyed in 1916.
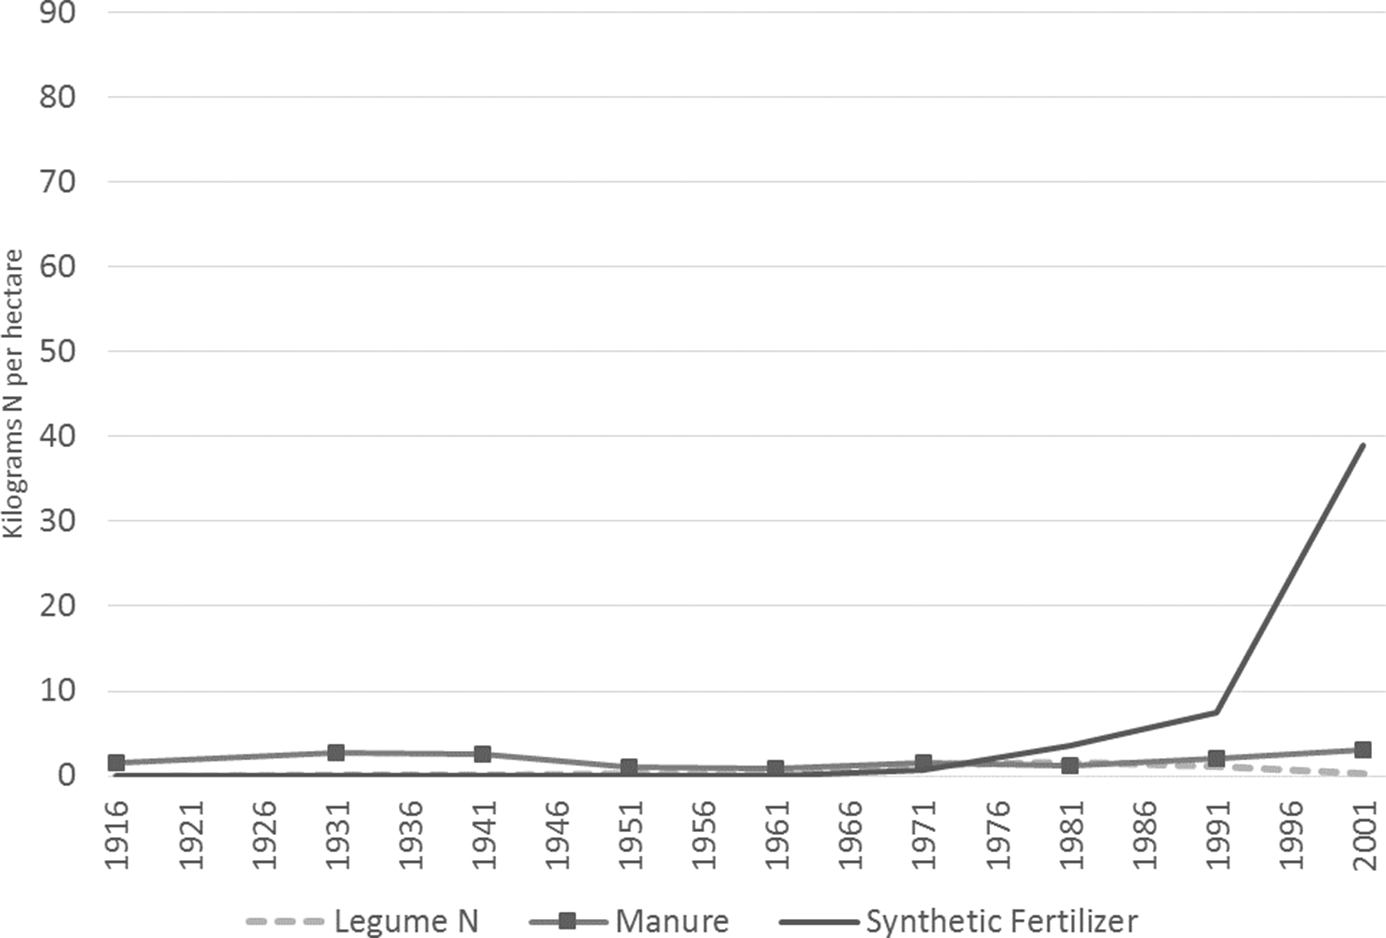
Synthetic fertilizer, although showing the greatest rise, was not the only type of nitrogen input that farmers increased after 1971 (figure 7). They also raised manure contributions, although this increase was small, compared to the increase in synthetic fertilizer.
Nitrogen from legumes, manure, and chemical fertilizer in Wise Creek.

Initially manure application was high, which corresponded with the large number of livestock. Livestock numbers declined in the 1940s and 1950s, when grain prices were high and more cropland in Wise Creek was in wheat. Oats declined after 1931 in concurrence with the decline in horses in the rural municipality because oats fed horses. The 1931 Agricultural Census reported Saskatchewan had the highest number of tractors in Canada, followed by Alberta and Ontario (Dominion Bureau of Statistics 1936: 36–37). Saskatchewan also had the highest number of farms with mechanization for grain harvesting relative to other provinces (Dominion Bureau of Statistics 1931: lxxiv). Early tractors worked best on flat land, which was in abundance in Saskatchewan, especially in the southern part of the province where Wise Creek is located (Lew Reference Lew2000: 189). Also, farmers who could afford to were more likely to invest in a tractor to reduce or avoid the costs of hired labor (Karagiannis and Furtan Reference Karagiannis and Hartley Furtan1990: 10). The decline in horses and the oats to feed them were indicators of mechanization in the rural municipality.
A transition toward more cattle is evident in the Agricultural Census for Wise Creek (Dominion Bureau of Statistics 1918, 1931, 1941, 1951, 1961; Statistics Canada 1971, 1981, 1991, 2001). The rise in cattle numbers explains why the amount of nitrogen from manure increased beginning in 1981, as the amount of nitrogen from legumes decreased. Cattle required pasture, but grazed land cannot grow crops in the same year. Although the increase in sheep and swine was not as large as it was in cattle, they also contributed to the higher manure availability in Wise Creek. This is not to say that agriculture in Wise Creek deliberately shifted away from field crops solely as a response to a decline in nitrogen levels, but rather farms responded to changing market conditions, including higher production and transportation costs, through increased diversification instead of continuing the mid-century focus on wheat (Jaffe Reference Jaffe2003; MacGregor and Graham Reference MacGregor and Graham1988). Farmers diversified their sources of farm revenue by producing both crops and livestock.
There was still a need for additional nitrogen on cropland. Its initial use was quite low, but increased rapidly in what was likely an attempt to compensate for lower yields. Synthetic fertilizer replaced the nitrogen that was lost with each harvest that the combination of manure, legumes, and natural nitrogen deposition could not fully replace. There were two periods since 1950 when manure usage increased: 1961–71 and after 1981. The first period of increased use happened alongside the introduction of synthetic fertilizer. Synthetic fertilizer use in 1961 was very low, at roughly 0.1 kg/ha. That year also marked a low point in the long-term decline in nitrogen outputs that began in 1941. The introduction of more manure and the beginning of chemical fertilizer application by 1961 led to a substantial increase in nitrogen output.
Between 1961 and 1971 nitrogen output increased from 18 kg/ha in 1961 to 33 kg/ha. There was still growth in nitrogen output between 1971 and 1981, but it was a slower growth as the output reached 40 kg/ha, which was an increase of only 8 kg/ha. Additionally, the gap between inputs and outputs of nitrogen widened over the following decade, which continued to create a negative nitrogen balance. In 1971, farmers still mined the soil, but also supplemented the stored nitrogen with the input of synthetic nitrogen, producing a positive trend in crop yields. This positive trend was short-lived; after 1981, outputs gradually plateaued around 40 kg/ha, even though the rate of nitrogen input from chemical fertilizers rose dramatically.
This initial use of chemical fertilizers coincided with the beginning of a period of high wheat prices that lasted from roughly 1972 to 1980. In the 1980s, farms’ economic margins decreased through a combination of higher interest rates, rising farm debt levels, and a decline in wheat prices. The continued increase in chemical fertilizer use was an attempt to balance higher production costs with increased outputs. Farmers attempted to increase their production through the application of extra nitrogen, but that strategy failed to raise yields to settlement-era levels.
After 1981 biomass yields steadily declined, which resulted in a decreased amount of nitrogen removed through harvesting. The negative nitrogen balance lessened mainly due to increased application of chemical fertilizers. Despite these two changes, agriculture in Wise Creek was not sustainable; it required ever-greater levels of nitrogen input to achieve its yields since it ran on a nitrogen deficit. When the inputs and outputs of nitrogen were equal in 1997 it was the only time when there was a perfect balance in the agricultural production of the rural municipality. This perfect balance was short-lived since by 2001 inputs were higher than outputs. Through nearly a century, agriculture never achieved a stable state in this RM.
The nitrogen balance trajectory in Wise Creek makes it apparent that agriculture relied on outside sources of nitrogen to support plant growth. The initial high yield of the early settlement period was the result of tapping into the accumulated nitrogen in the soil. As stored nitrogen drained away, biomass yields decreased. While the application of more manure and, later on, chemical nitrogen fertilizer revived yields, they did not achieve the same level reached when agricultural production began. Looking at nitrogen as an indicator of soil fertility, it is apparent that the output and input of nitrogen has yet to reach a sustainable pattern where they are equal and stable. The negative balance between input and output has been substantial. The addition of significant amounts of chemical fertilizer offset past years’ nitrogen outputs. This solution increased the cost of production but did not return biomass yields to the levels achieved in the early settlement period, which suggests increased chemical fertilizer application did not have an overall positive effect on soil fertility or place agriculture in the RM in a stable state.
The second case study used by this article is the RM of Livingston, number 331, which is approximately 300 miles northeast of Wise Creek. It has a wetter climate and more varied topography, so it provides a contrast to the RM of Wise Creek. Despite their differences, these two RMs show common variations of Saskatchewan agriculture. The RM of Livingston is located in east central Saskatchewan along the border with the province of Manitoba and about 200 miles northwest of Saskatchewan’s provincial capital, Regina. Livingston’s boundaries form a rectangle that runs north-south along the Manitoba-Saskatchewan border. This configuration means there are noticeable climate and land variations within the RM. The top of the RM encompasses some of the Porcupine Hills, which are part of the Manitoba Escarpment. This part of the RM is nonagricultural land. The RM of Livingston is 520 square miles (1338 km2) with a population of 427 in 2001, which gave it the same population density—less than one person per square mile (0.3 person per square kilometer)—as Wise Creek (Statistics Canada 2013). The 2001 Agricultural Census reported 139 farms within the rural municipality, a sharp decline from 1916 when the census showed 2,112 people and 444 farms. The population density in 1916 was nearly four persons per square mile (1.5 persons per square kilometer), equivalent to that in Wise Creek (Dominion Bureau of Statistics 1918: 334).
Livingston makes an interesting case study due to its more northerly location and wetter climate. The precipitation measurement combines data from the nearby Arran, Pelly, and Kamsack weather stations to get a full data set for the 85-year period. The precipitation record is important because moist soils provide plants with growing conditions that allow for easier nitrogen uptake. In contrast, drier soils inhibit nitrogen uptake since it is the movement of water into the root system that delivers nitrogen (Mosaic Crop Nutrition 2016). Its higher precipitation makes Livingston better suited to agriculture. Livingston has gray and dark gray soils with bulk densities between 1.2 and 1.4 g/cm3. These soils have a greater range of clay content varying from 18 to 31 percent (CanSIS 2013; Saskatchewan Soil Survey et al. 1994: 5-1), and this analysis uses a mean of 26 percent for the clay content of the RM as a whole.
Livingston’s biomass yield increased more slowly and hit its first significant high point in 1951, the same year that Wise Creek’s yields were at their all-time low. Livingston had a greater number of hectares under crop and split this crop land between wheat, fallow, oats, and barley (figure 8). Its hay production was also higher (Dominion Bureau of Statistics 1918, 1931, 1941, 1951, 1961; Statistics Canada 1971, 1981, 1991, 2001). The wetter and cooler climate also created conditions for successful rapeseed (canola) production.
Hectares under crop in Livingston.

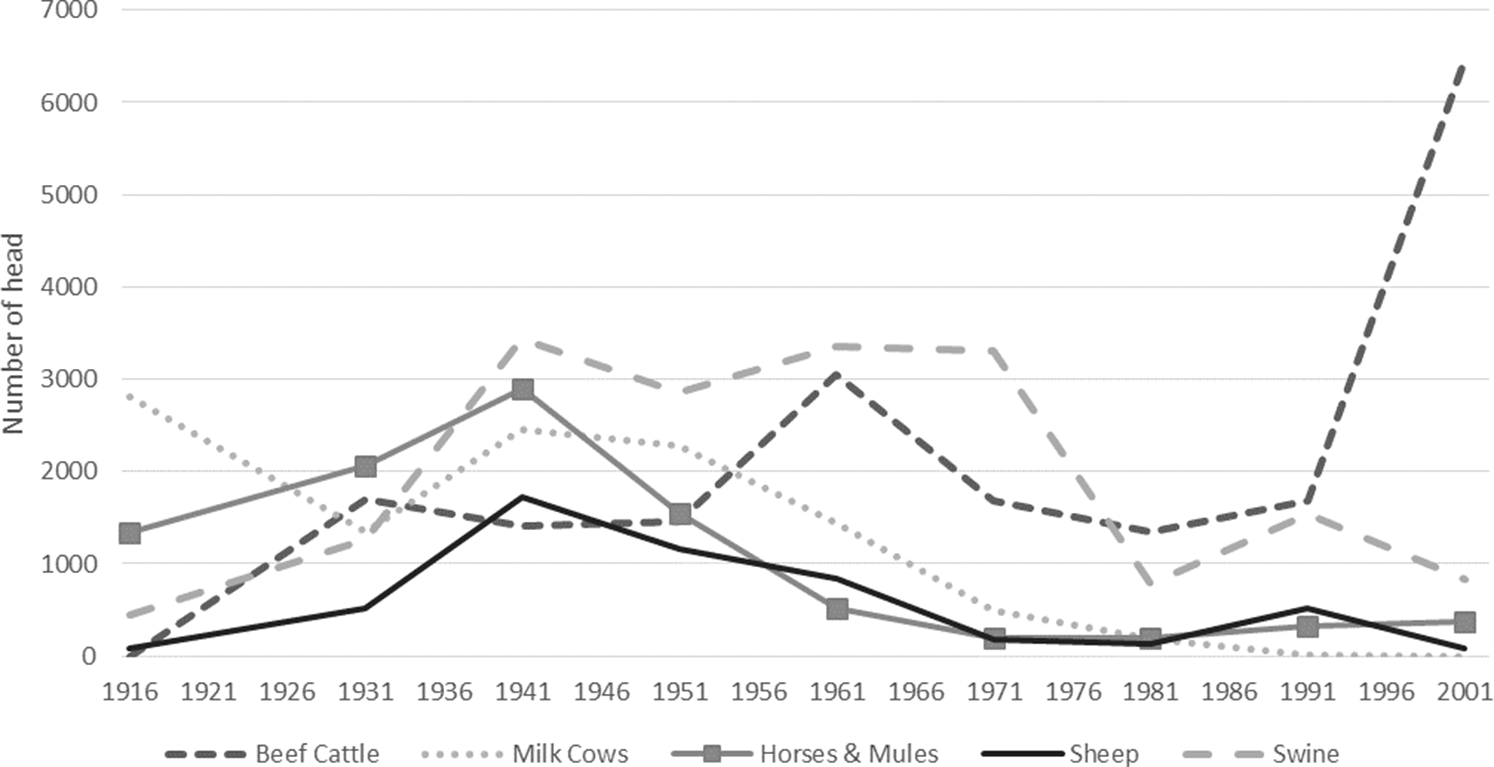
In Livingston farmers had easier access to markets for perishable animal products, so the decline in livestock was less intense than in Wise Creek where the area focused intensely on cereal production. Swine and sheep populations in Livingston increased after 1931 (figure 9), implying that farmers sought to offset the low market prices associated with the Great Depression through diversification by raising both livestock and crops for revenue. Sheep showed the typical sharp rise and fall of a fad, though this fad was a direct result of the restrictions on trade imposed by World War II. Wool was critical to the war effort and prior to World War II Canada had imported most of its wool. During the war, the federal government made a concerted effort to get Canadian sheep farmers to increase their flocks to reduce Canadian dependence on imported wool with publications such as “Canada Urgently Needs More Wool” (Agricultural Supplies Board 1942). After the war, Australia and New Zealand again dominated the wool market, which contributed to the decline of the total Canadian flock (Sawyer Reference Sawyer2017). The sheep population did not show significant increases until 1991. Given the droughts of the 1980s it is likely that sheep were a way for farmers in the area to remain diversified instead of focusing strictly on crops. Compared to cattle, sheep required less water and pasture per head, which would have been appealing in a decade that experienced reoccurring drought. Sheep, however, do not provide large quantities of manure for nutrient replenishment compared to cattle or swine. The number of swine in Livingston remained consistent between 1941 and 1971. This pattern fit with the trend Statistics Canada noted for the national swine herd. The 1970s were the first period of significant difficulties for the swine industry. A decline in swine numbers showed a clear response to low prices, as farmers moved away from less profitable livestock (Briggs Reference Briggs1947: 32; Brisson Reference Brisson2014: 3). Doing so also meant they lost access to the nutrients in the swine manure.
The Agricultural Census data for Livingston shows the typical trend of horses and mules declining as farms mechanized and no longer required animal power. This decline, however, happened later in Livingston compared to Wise Creek. Additionally, in Livingston animal power use and oat production was not closely linked. Oat production in Livingston took until after 1951 to drift downward, a full decade after horse and mule numbers declined. The slower drop in oats may have resulted from oats being a better performing cash crop in the wetter soils of Livingston.
The initial number of livestock was comparable between the two case studies. The one exception was that Livingston had almost twice the number of dairy cattle, partly a result of more settlements in the area providing markets for highly perishable dairy products. By 1920, Livingston farmers had access to several creameries located just outside of the RM including ones in Norquay, Kamsack, and Preeceville, as well as one in Swan River, Manitoba after 1909 (Church Reference Church1985; Nicholson Reference Nicholson2002). Cream was less fragile than milk and thus “from 1890–1950, the dairy industry revolved around shipping cream on the train to processing plants located within a fifty-mile radius” (Nicholson Reference Nicholson2002: 1). In comparison there was only one creamery, at Shaunavon, within an acceptable distance to Wise Creek (Church Reference Church1985: 136). As creameries consolidated, access to a local market for dairy products declined and thus dairying declined steadily until only one farm in the RM reported dairy cattle in 2001. While the Livingston and Wise Creek beef cattle herds were almost on par by 2001, the Livingston herd rebounded more slowly and from a much lower level. In Livingston 3,053 beef cattle and 1,443 dairy cattle produced a total of 86,261 kg of nitrogen in their manure in 1961. In comparison 3,349 head of swine only produced 9,093 kg of nitrogen. The more stable livestock numbers in Livingston provided part of the reason why the nitrogen input levels there remained almost static.
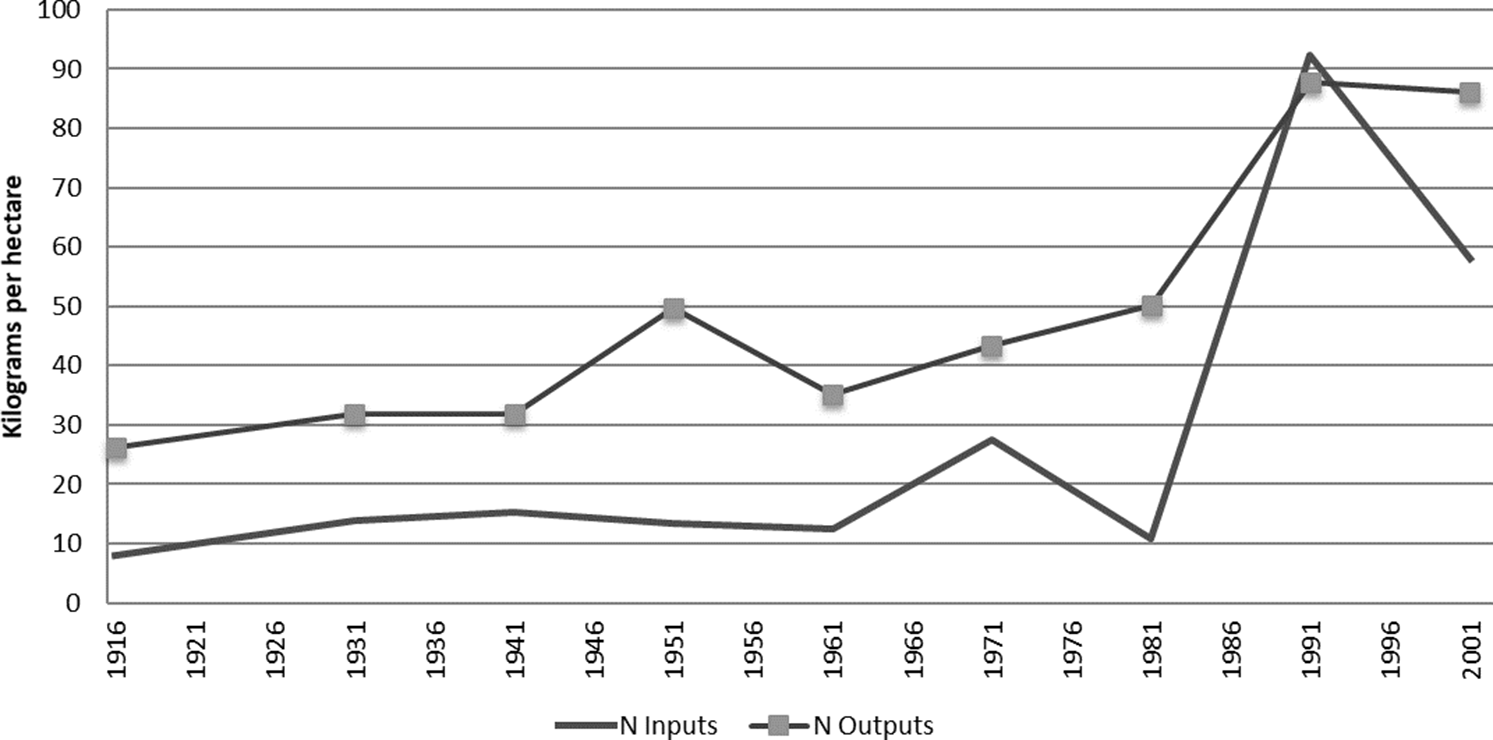
Even though the difference between nitrogen inputs and outputs was not as wide, Livingston still experienced long-term soil nitrogen depletion (figure 10). Additionally, nitrogen inputs immediately declined again after they briefly matched the inputs in 1991. Synthetic fertilizer use mirrored this trend.
Livestock in Livingston.

Nitrogen inputs versus nitrogen outputs in kilograms per hectare in Livingston.

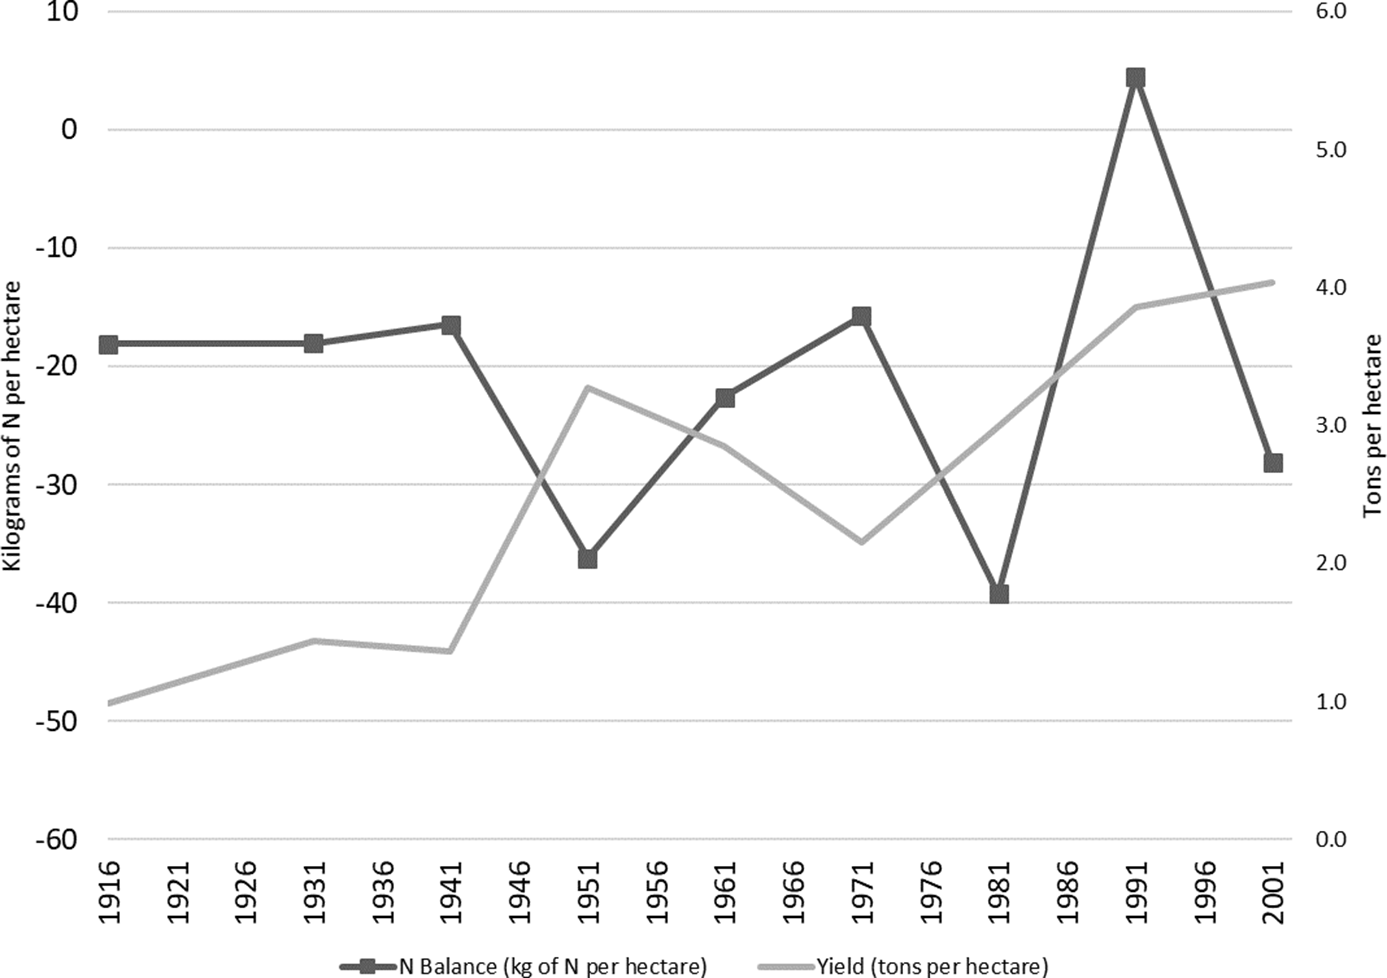
Nitrogen balance (kilograms of nitrogen per hectare) versus yield in tons per hectare in Livingston.

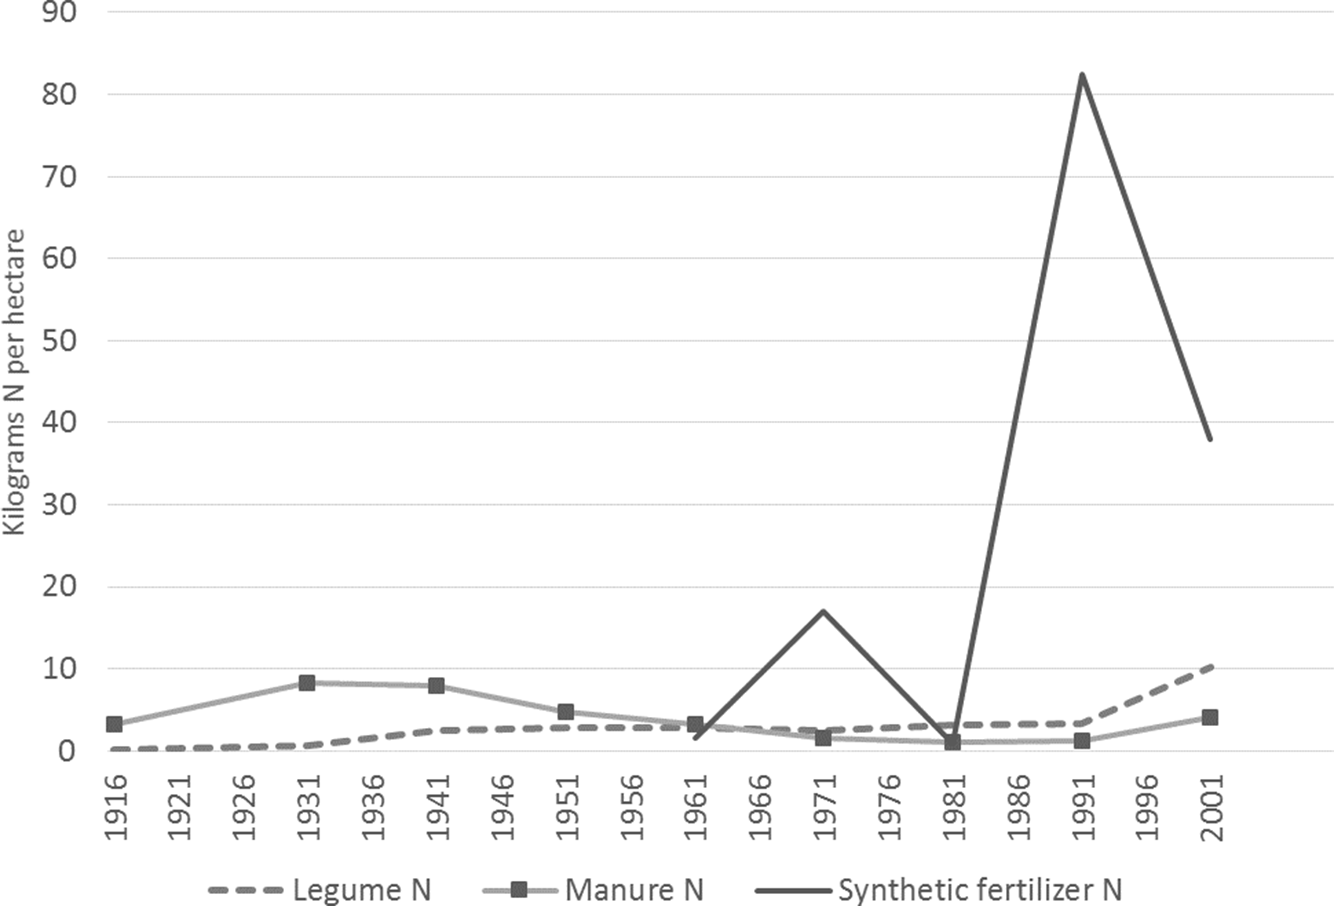
Nitrogen from types of fertilizer used in Livingston.

The nitrogen balance of Livingston (figure 11) was consistently negative except for 1991, which illustrates a soil mining process. There was a decline in livestock from the 1950s into the 1980s as the majority of agricultural production focused on crops, in particular wheat, oats, and canola, which meant less nitrogen from manure was available. Farmers in Livingston reported they returned animal bedding and manure to their fields (pers. comm., March 15, 2017). The strong decline in the nitrogen balance corresponded with a period of high biomass yields that began in 1951. The beginning of chemical fertilizer use, as reported in the Census, around 1961 resulted in a narrowing of the nitrogen imbalance. The 1981 low point of chemical fertilizer use also marked the worst nitrogen balance, –39 kg/ha, in 85 years. The nitrogen balance reflected the level of chemical fertilizer use. The only time the N balance was positive was in 1991, which was also the high point for nitrogen fertilizer use. The N balance was more inconsistent after 1961, reflecting the unevenness of synthetic fertilizer use as well as the overall decline in livestock production. As a consequence, the level of available nitrogen inputs was less consistent.
Of the potential legume crops, legume hay, including both alfalfa and clovers, had the highest production level in Livingston. The hay increase corresponded to the resurgence in livestock production after 1991. Between 1991 and 2001 hectares in hay increased from 1,472 to 6,252, which raised available nitrogen from 3.2 kg/ha to 10.2 kg/ha: a positive change of roughly 300 percent. Livingston farmers diversified much like farmers in Wise Creek. Increased hay cultivation was necessary to feed the larger population of cattle. Cattle ranching gave farmers another revenue stream and access to a lower-cost nutrient source through the animals’ manure.
The precipitation level in Livingston made it possible for farmers to access another revenue source by growing rapeseed or canola but growing it added another demand for nutrients to the crop rotation. Rapeseed provided industrial oils—principally marine lubricants—but due to its high erucic acid content was not edible. Through a publicly funded plant breeding program at Agriculture Canada Research Stations, Keith Downey developed the first edible variety of rapeseed (Busch Reference Busch2003: 47). In 1971, Span was the first commercially available low-erucic acid variety (Canola Council of Canada 2017b). Downey’s colleague, Baldur Stefansson, developed Tower rapeseed, which became available for commercial use in 1974. These new varieties transformed the industry (Canola Council of Canada 2017a). By the 1980s, this new type of rapeseed, renamed as “canola,” had become a health food staple in grocery stores due to its low saturated fat. It soon became a leading crop across the northern prairies. From an economic standpoint, canola was extremely useful to farmers as it was a high-value cash crop (Busch Reference Busch2003; Gupta and Pratap 2007; Jaska et al. Reference Jaska and Lawrence1997). While canola was another cash crop for farmers, it also took nutrients out of the soil so they had to compensate by adding more fertilizer to their fields.
The use of synthetic fertilizer in Livingston (figure 12) showed a much more uneven pattern compared to Wise Creek. Livingston was vulnerable to drought as the agricultural techniques and cropping practices in the RM were not already adapted to farming in a dry area. During seeding, unless weather forecasts strongly suggest otherwise, farmers based application rates for both seed and fertilizers on long-term average conditions for the area (pers. comm., March 15, 2017). When a crop failed due to a dry year, farmers considered it a year when the crop had not fully utilized the added nitrogen fertilizer—the crop failed before it could take up the nitrogen. In periods after a drought, therefore, farmers were more likely to assume that nitrogen remained in the soil instead of the drought-stricken crops using it; therefore, their application rates in the year following a drought were likely to be lower. The lower application rate was a cost-saving measure and prevented oversaturation of nitrogen in the soil once the drought finished.
Although not as well remembered as the drought of the 1930s, there were a series of short-term droughts that affected either all or significant parts of Saskatchewan’s agricultural land during the 1980s (Abbasi Reference Abbasi2014: 88). Three widespread droughts occurred in 1979/80, 1984, and 1988. Although one of the costlier natural disasters in Canadian history, the 10-year sampling method used for this study does not fully capture the 1988 drought. Environment Canada (2017b) notes that “the hottest summer on record, combined with half the normal growing season rainfall and a virtually snow-free previous winter, produced a drought that rivaled the 1930s in terms of intensity and duration of the dry spell.” The drought of 1979/80 was significant enough that Saskatchewan Minister of Agriculture Gordon MacMurchy replied to a question on the strength of Saskatchewan’s economy by saying “what I think Saskatchewan needs most between now and July 15, is rain to provide for us an abundant harvest. Saskatchewan needs that; Canada needs that; the world needs that—no question about that” (Saskatchewan, Legislative Assembly 1980: 2170). This drought influenced Livingston’s agricultural practice even after it ended.
The strong decline in nitrogen use in Livingston in the 1981 crop year correlates with the drought of 1979/80. There was a marked decline in yield between 1978 and 1979. Yield measurements were for the harvest of autumn 1979 and it is apparent that the harvest of 1980 was also low as a result of the drought. Since the crops failed because of drought, farmers understood that the crops had not used the nitrogen fertilizer added to the land. Lowering nitrogen use in the next year prevented nitrogen oversaturation and provided farmers with the additional benefit of reduced input costs (Government of Saskatchewan Ministry of Agriculture 2019). Lowering input costs was important since economic margins in agriculture after 1980 narrowed due to rising interest rates, inflation, input costs, and declining farm-gate prices. The farm-gate price is the price for a commodity less associated costs, such as transportation and handling, to get it to the buyer from the farm. Wayne Easter (Reference Easter2005: 7), the Parliamentary Secretary to the Minister of Agriculture and Agri-Food reported, “net farm income from market sources fell deeply in the 1980s and farmers have never recovered.” When a crop failure happened, farmers considered possible ways to reduce costs to recoup the previous year’s losses. A lower fertilizer application was one way to reduce these costs, which is why compared to 1971 the 1981 fertilizer application was extremely low.
As farmers increased the use of conservation tillage practices designed to reduce soil erosion and lower evaporation rates from soils the amount of summer fallow declined (Nelson Reference Nelson1997). In a review of studies on cropping practices and economics on the Canadian prairies, Robert Zentner et al. (Reference Zentner, Wall, Nagy, Smith, Young, Miller, Campbell, McConkey, Brandt, Lafond, Johnston and Derksen2002a) found that conservation tillage practices provided more economic benefit to farmers in higher soil moisture areas, which included the RM of Livingston. They also noted the incorporation of oilseeds and/or pulse crops as part of the overall crop rotation tended to provide a stabilizing effect for farm income. These findings suggest another reason why fallow declined and hectares under canola increased. Replacing fallow with canola meant that farmers had replaced one way to replenish soil nutrients (fallow) with a crop that used nutrients.
Early in the twentieth century, an initial period of relative stability in yields and soil mining gave way to a sharp increase in yields that matched the upswing in sheep production and peaked in 1951. The soil mining of this period was more intense, as less nitrogen returned to the soil because manure availability declined with fewer livestock. When combined with a steady level of legume cropping, it became apparent that the increased yield resulted from both introducing new nitrogen and using accumulated soil nitrogen. The consequences of increased soil mining are apparent in the decreased biomass yield between 1951 and 1961. The use of synthetic fertilizer in 1961, combined with a small upward trend in legume cropping, offset the decline of manure use so that nitrogen outputs increased. This was also the period when rapeseed entered the crop rotation cycle, which meant another crop was removing nitrogen from the soils of the RM.
The nitrogen output and input in Livingston only matched in 1991, a decade sooner than the inputs and outputs balanced in Wise Creek. However, in Livingston nitrogen inputs declined sharply after 1991, while outputs did not, which indicated continued soil mining in the RM. The amount of crop harvested increased steadily from 1971 to 2001, even though the amount of nitrogen removed from the soil varied significantly. The increased use of synthetic fertilizer in 1971 and 1991 allowed farmers to provide the soil with enough nitrogen to produce significant yields. The higher precipitation that supported better plant growth also helped farmers in Livingston. The unevenness of Livingston’s soil mining, as shown through the nitrogen balance, mirrored the unevenness of its yields.
Comparing Wise Creek with Livingston, it is apparent that Wise Creek was less productive agriculturally than Livingston except in the initial phase of settlement when Wise Creek’s nitrogen outputs were almost twice those in Livingston. The use of stored nitrogen was greater in Wise Creek, which accounts for its sharper initial output decline, compared to that of Livingston. While the input and output levels of the two rural municipalities were different, neither was sustainable, as neither consistently returned more nitrogen to the soil than was removed through agricultural practices. Farmers in both areas diversified to overcome the challenges connected with declining soil nitrogen. The higher precipitation in Livingston allowed farmers to add canola into their rotation as another cash crop to complement wheat. Yet, adding canola resulted in an increased in the demand for soil nitrogen because canola required nitrogen but did not replenish it. Greater diversification of agricultural practices provided farmers with a way to spread their economic risk but ultimately did not address the problem of declining soil nitrogen, as synthetic fertilizer was required in both case studies to maintain agricultural productivity.
Over the twentieth century farmers have trawled Butler’s ocean of grass (Reference Butler1872: 199) for nitrogen to net good yields. Yet, as they consumed the stockpile of nitrogen in the soil, they needed to add manure, then legumes, then synthetic fertilizer to maintain their yields. Agricultural practice needs adjustment if export-oriented agriculture in Saskatchewan is to continue and thrive. Constantly increasing application of synthetic nitrogen fertilizer is not economically sustainable and, as the two case studies show, unlikely to sustain yields at a consistently high level. Supplementing nitrogen with livestock manure comes with the extra consideration that land used for livestock grazing is not available for intensive cropping at the same time. Because crop yields have continued to outpace nitrogen inputs, perhaps the question to consider is: Can Saskatchewan agriculture sustain its current practice of soil mining? Synthetic nitrogen reinvigorated crop yields after 1961 and in the intervening years there was a positive trend in crop yields, although one that did not reach historic highs. Soil mining by itself is not sustainable, but with the addition of synthetic nitrogen fertilizers is the level of soil mining considered tolerable until the next innovation offsets declining nitrogen?
Acknowledgments
I am grateful for comments from Dr. Geoff Cunfer on an early draft of this paper. This research was supported by the Canadian Social Sciences and Humanities Research Council, Partnership Grant 895-2011-1020.