Introduction
Remote sensing in agriculture has continued to expand as pressure on farmers to produce crops more efficiently has increased. For profitable farming, farmers are exploring diverse cropping systems, resulting in a greater variety of weed control challenges. Integrating remote-sensing technology into agriculture to improve efficiency and inform management decisions has been a topic of research for decades (Lamb and Brown Reference Lamb and Brown2001). With improvements in sensor technology, data management, storage, and processing power, a resurgence of interest in agricultural remote sensing has occurred in the past 15 years (Hung et al. Reference Hung, Xu and Sukkarieh2014; Hunt et al. Reference Hunt, Daughtry, Mirsky and Hively2014; López-Granados Reference López-Granados2011). Remote sensing has been used to estimate crop yield and biomass (Bandyopadhyay et al. Reference Bandyopadhyay, Pradhan, Sahoo, Singh, Gupta, Joshi and Sutradhar2014; Casanova et al. Reference Casanova, Epema and Goudriaan1998; Diker and Bausch Reference Diker and Bausch2003; Hansen and Schjoerring Reference Hansen and Schjoerring2003; Ray et al. Reference Ray, Das, Singh and Panigrahy2006), water stress (Bandyopadhyay et al. Reference Bandyopadhyay, Pradhan, Sahoo, Singh, Gupta, Joshi and Sutradhar2014; Penuelas et al. Reference Penuelas, Filella, Biel, Serrano and Save1993), crop nutrient status (Cohen et al. Reference Cohen, Alchanatis, Zusman, Dar, Bonfil, Karnieli, Zilberman, Moulin, Ostrovsky, Levi, Brikman and Shenker2010; Goel et al. Reference Goel, Prasher, Landry, Patel, Bonnell, Viau and Miller2003; Jain et al. Reference Jain, Ray, Singh and Panigrahy2007), herbicide injury (Everman et al. Reference Everman, Medlin, Dirks, Bauman and Biehl2008; Henry et al. Reference Henry, Shaw, Reddy, Bruce and Tamhankar2004a), damage caused by plant diseases and insects (Del Fiore et al. Reference Del Fiore, Reverberi, Ricelli, Pinzari, Serranti, Fabbri, Bonifazi and Fanelli2010; Mahlein et al. Reference Mahlein, Rumpf, Welke, Dehne, Plümer, Steiner and Oerke2013), and the detection and control of weeds (Bolch et al. Reference Bolch, Santos, Ade, Cavender-Bars, Gamon and Towsend2020; Burks et al. Reference Burks, Shearer, Green and Heath2002, Reference Burks, Shearer, Heath and Donohue2005; Henry et al. Reference Henry, Shaw, Reddy, Bruce and Tamhankar2004b; Huang et al. Reference Huang, Lee, Thomson and Reddy2016; López-Granados Reference López-Granados2011; Medlin et al. Reference Medlin, Shaw, Gerard and LaMastus2000). Despite a growing body of research in which remote sensing in agriculture was used, additional research is needed to continue to narrow the gap between data collection and practical management decisions.
One application of remote sensing in agriculture is the site-specific management of weeds (Jurado-Expósito et al. Reference Jurado-Expósito, López-Granados, Atenciano, García-Torres and González-Andújar2003; López-Granados Reference López-Granados2011). Site-specific weed management can reduce the need for broadcast applications, limiting potential environmental impacts of herbicide use, tillage, soil compaction, off-target pesticide movement, and lowering overall input costs. Site-specific weed management requires accurate differentiation between crop and weed species to be able to control weed species while leaving crops untouched. Successful differentiation of plant species can be challenging because many weed and crop species share similar biophysical plant traits. Species-level discrimination using remote sensing has been successful using plant biophysical traits such as leaf morphology, canopy structure, and plant biochemistry (Asner Reference Asner1998; Gamon et al. Reference Gamon, Serrano and Surfus1997). More recent approaches have used complex machine-learning algorithms that use combinations of standard color photographs and multispectral images to successfully separate weed species from a planted crop (Dian Bah et al. Reference Dian Bah, Hafiane and Canals2018; Farooq et al. Reference Farooq, Jia, Hu and Zhou2019). Even with these approaches using color and multispectral images, other approaches may be necessary to further improve the reliability for crop and weed species to be distinguished from one another.
One approach for making the distinction between each of these species has focused on reflectance spectra, or the wavelengths of light reflected off the plant canopy (Gray et al. Reference Gray, Shaw and Bruce2009; Hemming and Rath Reference Hemming and Rath2001; Henry et al. Reference Henry, Shaw, Reddy, Bruce and Tamhankar2004a; Henry et al. Reference Henry, Shaw, Reddy, Bruce and Tamhankar2004b). These spectra can be collected through proximal sensors mounted on tractors or other vehicles, handheld proximal sensors, or via satellites or unmanned aerial vehicles (Thorp and Tian Reference Thorp and Tian2004). Hyperspectral remote sensing, or spectroscopy, provides a high degree of spectral resolution, capturing solar radiation reflected off plant surfaces in narrow wavelength bands collected between 350 and 2,500 nm (Jensen Reference Jensen2007). With the human eye and color photographs, the spectra detected are limited to visible light (VIS; 300–700 nm). However, wavelengths outside of the visible range such as the near-infrared (NIR; 701–1,300 nm), shortwave-infrared I (SWIR1; 1,301–1,900 nm), and shortwave-infrared II (SWIR2; 1,901–2,500 nm) may improve species differentiation by detecting differences unnoticed with the naked eye, with common photographic equipment, or even multispectral cameras (Ustin et al. Reference Ustin, Roberts, Gamon, Asner and Green2004). Remote sensing using spectroscopy has been used to discriminate between species in agricultural (Henry et al. Reference Henry, Shaw, Reddy, Bruce and Tamhankar2004b; Koger et al. Reference Koger, Shaw, Reddy and Bruce2004) and nonagricultural settings (Santos et al. Reference Santos, Hestir, Khanna and Ustin2012; Schmidt and Skidmore Reference Schmidt and Skidmore2003). Although previous research has been able to differentiate species in the VIS and NIR range (Cho et al. Reference Cho, Debba, Mathieu, Naidoo, Van Aardt and Asner2010; López-Granados Reference López-Granados2011), newer sensors can detect bands in the SWIR (1,300–2,500). SWIR spectra may provide additional information for the refinement of species differentiation algorithms, provide new spectra to be included in multispectral sensors, or provide additional utility of remote sensing in agriculture.
Although researchers have successfully been able to discriminate between crop and weed species in field settings using multispectral and hyperspectral remote sensing, these studies have been limited to only a few crops and weed species (Gray et al. Reference Gray, Shaw and Bruce2009; Hemming and Rath Reference Hemming and Rath2001; Henry et al. Reference Henry, Shaw, Reddy, Bruce and Tamhankar2004a, Reference Henry, Shaw, Reddy, Bruce and Tamhankar2004b; Koger et al. Reference Koger, Shaw, Reddy and Bruce2004). These species include common cocklebur (Xanthium strumarium L.), sicklepod [Senna obtusifolia (L.) Irwin & Barneby], pitted moringglory (Ipomoea lacunosa L.), and horsenettle (Solanum carolinense L.) in soybean [Glycine max (L.) Merr.] (Henry et al. Reference Henry, Shaw, Reddy, Bruce and Tamhankar2004a; Henry et al. Reference Henry, Shaw, Reddy, Bruce and Tamhankar2004b; Koger et al. Reference Koger, Shaw, Reddy and Bruce2004; Medlin et al. Reference Medlin, Shaw, Gerard and LaMastus2000); Palmer amaranth (Amaranthus palmeri S. Watson) in cotton (Gossypium hirsutum L.); climbing milkweed [Funastrum cynanchoides (Decne.) Schltr.] in orange [Citrus × sinensis (L.) Osbeck.]; ragweed parthenium (Parthenium hysterophorus L.) in carrot (Daucus carota L. var. sativus Hoffm.); London rocket (Sisymbrium irio L.) in cabbage (Brassica oleracea var. capitata); and johnsongrass [Sorghum halepense (L.) Pers.] in sorghum [Sorghum bicolor (L.) Moench ssp. bicolor] (Menges et al. Reference Menges, Nixon and Richardson1985). Although these studies address some problematic weed species in crops, the list of these species is not exhaustive and more research is needed. Furthermore, a previous study indicated that phenologic changes during a growing season can affect species differentiation (López-Granados et al. Reference López-Granados, Peña-Barragán, Jurado-Expósito, Francisco-Fernández, Cao, Alonso-Betanzos and Fontenla-Romero2008) and can be used to increase weed detection accuracy from hyperspectral remote-sensing data (Andrew and Ustin Reference Andrew and Ustin2008; Glenn et al. Reference Glenn, Mundt, Weber, Prather, Lass and Pettingill2005; Lass and Callihan Reference Lass and Callihan1997). However, limited research exists on optimal timing for species differentiation in cropping systems. Thus, the objectives of this study were to (1) determine if four common crops and four problematic weed species can be differentiated on the basis of their hyperspectral reflectance, (2) identify spectral regions that allow for species differentiation, (3) evaluate the effect of phenologic stage of crops and weeds on crop and weed differentiation, and (4) determine the impact of canopy structure on spectral reflectance using canopy- and leaf-level spectra.
Materials and Methods
Plant Potting
This study was conducted in 2016 and 2017 at North Carolina State University’s Horticulture Field Laboratory, Raleigh, NC (35°47′N, 78°41′ W). Plants representing most common or troublesome weeds in agronomic and horticultural crops [(cucumber (Cucumis sativus L.), peanut (Arachis hypogea L.), soybean, sweetpotato [Ipomoea batatas (L.) Lamm.], and weed species (Palmer amaranth, common ragweed (Ambrosia artimisiifolia L.), yellow nutsedge (Cyperus esculentus L.), and large crabgrass (Digitaria sanguinalis (L.) Scop.] (Webster Reference Webster2010, Reference Webster2014) were planted into 95-L pots (Table 1) on May 27, 2016, and May 24, 2017. Pots were watered for the first week after planting (WAP) to allow for seed germination and transplant establishment. After emergence, plants were thinned to a single plant pot−1. Sweetpotato was the only plant species that was not seeded; it was transplanted using nonrooted cuttings with 1 to 2 leaves.
Crop and weed species used for plant spectral analysis at the Horticulture Field Laboratory, Raleigh, NC, in 2016 and 2017.

Each pot contained two layers: the bottom layer contained 28 L of a soilless potting medium (Jolly Gardener 4P Growing Mix; Oldcastle Lawn and Garden, Poland Spring, ME), and the upper layer contained 38 L of native Norfolk loamy sand (Fine-loamy, kaolinitic, thermic Typic Kandiudults), with a humic matter of 0.41% and soil pH 6.0, collected from the Horticultural Crops Research Station near Clinton, NC (35°1′N, 78°16′W). The purpose of the soilless medium was to draw water from a water-filled tray while minimizing disturbance of the upper-field soil layer. The field soil was used to mimic soil reflectance that would be present in an agricultural field.
Pots were arranged in a randomized complete block design with four replications and placed in a large, polyethylene-lined, 1.2 × 2.4 m trays 76-mm tall to allow pots to be watered from the bottom. To ensure plants did not experience water stress, trays were filled with water twice daily (morning and evening). Each pot was fertilized every 14 d with 24-8-16 (N-P-K; Miracle-Gro; Miracle-Gro Lawn Products, Marysville, OH) at a rate of 270 kg ha−1. The study was terminated 10 WAP.
Spectral Data Collection
Five measurements for each pot were taken using a portable field spectrometer equipped with a handheld foreoptic with a 44-rad instantaneous field of view (PSM-2500; Spectral Evolution, Lawrence, MA). Each canopy measurement was collected weekly when weather was appropriate from nadir at 1 m above the plant canopy, resulting in a ground instantaneous field of view (GIFOV) of 0.44 m−2. Measurements were taken at full-intensity sunlight (10:00–14:00 hours). The spectrometer was calibrated using a white reflectance panel (Spectralon; LabsSphere, North Sutton, NH) approximately every 15 min to account for variations in sun angle and atmospheric conditions. Pots containing no plant material were used as a soil reference to ensure plants could be differentiated from the soil.
In addition to canopy-level spectra, leaf-level spectra from the upper and the lower plant canopy were collected immediately after canopy-level measurements using a leaf clip attachment (ILM-105; Spectral Evolution). The leaf clip used an independent light source containing a 5-W tungsten halogen bulb delivered to the leaf clip by fiber-optic cable to minimize the plant tissue degradation due to heat from the light source. The leaf clip allowed for additional data collection during times when canopy level data could not be obtained and for quantification of contributions of each portion of the canopy to the overall plant reflectance. Upper leaf measurements were taken on the newest unfurled leaf on each species. Data collected on species with compound leaves were taken from multiple leaflets on the uppermost leaf. Lower leaf measurements were taken on the most mature true leaves in the plant canopy.
Measurement of Plant Biological Characteristics
Plant height, leaf angle, phenologic stage, and soil moisture content were measured on each data collection date. Leaf angle was measured using a protractor with a weight attached to a lightweight string. Five leaves on each plant were measured to determine the mean leaf angle. Measurements were taken from the horizontal position, where 0° was perpendicular to the soil surface. Angles greater than 0° (i.e., more erect leaf types) were measured in positive degrees, whereas leaf angles less than 0° (i.e., leaf blade angled downward toward the soil surface) were given negative values. The phenologic stage was assessed using methods described by Meier (Reference Meier2001). Soil-moisture sensors (Watermark soil moisture sensor, model 200SS; The Irrometer Company, Riverside, CA) were inserted 0.15-m deep in two of four replications to monitor soil-water availability in the pots and to ensure plants were not water stressed during spectral measurements. Soil moisture sensors were not placed in all replications, because of the high cost of each sensor.
To assess environmental conditions and account for variability between years, daily mean temperature, precipitation, and growing degree-days were obtained from the North Carolina Climate Office for the nearest weather station at the NC State University Lake Wheeler Road Field Laboratory (35°43′N, 78°40′W) located approximately 6.5 km southeast of the study location. Weather at the study site was consistent across years (Table 2).
Average Monthly Temperature and Growing Degree-Days (base, 10 C) for Horticulture Field Laboratory, Raleigh, NC, from May to August for 2016 and 2017.

Data Analysis
All spectral reflectance data (350–2,500 nm) for each plot were graphed by date. Data quality was visually assessed to remove errant or noisy measurements caused by human error or environmental interference. Errant readings were noted during field measurements for removal. The mean spectral reflectance for each species for each date was calculated on the remaining spectral measurements. To examine spectral separation between all species, a nonparametric Kruskal-Wallis test on ranks (P ≤ 0.1) (Corder and Foreman Reference Corder and Foreman2009) by date, wavelength, and spectral type (i.e., canopy, uppermost-leaf, lowermost-leaf) was used. To further test for differences between individual species, a Mann-Whitney U (P ≤ 0.1) test was used for all possible pairwise species comparisons, and species were considered to be “differentiable” at these spectra when resulting P-values were less than 0.1. Both tests are nonparametric tests that do not assume the normal distribution of data. These tests use median values for data and can account for unequal numbers of species samples. Because there were many species comparisons for canopy level, upper leaf, and lower leaf, results where differences across multiple spectra and date were observed are discussed. Additional data are included as supplemental data or can be accessed in the report of Basinger (Reference Basinger2018). All statistical analyses and data visualization were performed in R, version 3.5.2 (R Foundation, Vienna, Austria).
Results and Discussion
Species Differentiation
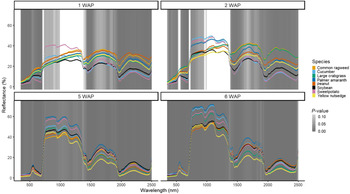
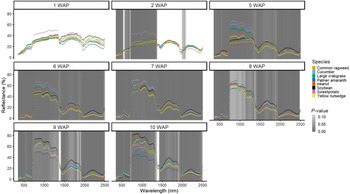
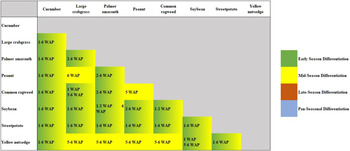
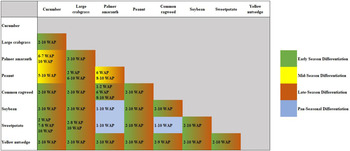
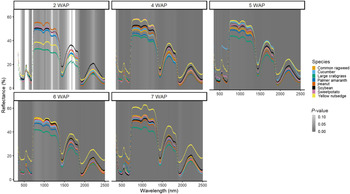
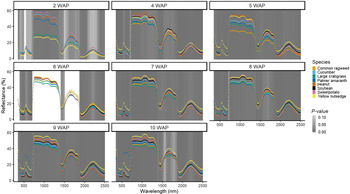
In both years, species were differentiable on the basis of their canopy hyperspectral reflectance. However, spectral regions where species were differentiable at P ≤ 0.1 were not consistent across all reading dates (Figures 1 and 2). Several species, such as yellow nutsedge, soybean, and sweetpotato, were consistently differentiable from other species throughout the season (Supplementary Figures S1–S6). Other species, such as Palmer amaranth, cucumber, and ragweed, showed early-season differentiation but were not differentiable at readings later in the season (Figures 3 and 4; Supplementary Figures S7–S14). Soil-moisture measurements collected at each reading date indicated that soil moisture did not fall below field capacity. Plants did not present any signs of nutrient deficiencies, and senescence that occurred in this study was natural and occurred after reproduction. Species separation has been noted by others (Gray et al. Reference Gray, Shaw and Bruce2009; Koger et al. Reference Koger, Shaw, Reddy and Bruce2004; Schmidt and Skidmore Reference Schmidt and Skidmore2003) but has not addressed season-long changes in plant phenology with changes in spectral reflectance.
Canopy-level spectral reflectance curves for crop and weed species, Raleigh, NC, 2016. Species are indicated by color and reflectance spectra grouped by weeks after planting (WAP). Wavelengths at which species differences, as indicated by the Kruskal-Wallis at test P ≤ 0.1, are indicated as a continuous variable behind the spectral reflectance curves.

Canopy-level spectral reflectance curves for crop and weed species, Raleigh, NC, 2017. Species are indicated by color and reflectance spectra grouped by weeks after planting (WAP). Wavelengths at which species differences, as indicated by the Kruskal-Wallis at test P ≤ 0.1, are indicated as a continuous variable behind the spectral reflectance curves.

Weeks after planting (WAP) in 2016 at which species could be differentiated. Measurements were taken at weeks 1, 2, 5, and 6 WAP. Species were considered differentiable if ≥10 wavelengths were significant according to the Kruskal Wallis test at the P ≤ 0.1 level.

Weeks after planting (WAP) in 2017 at which species could be differentiated. Measurements were taken at weeks 1, 2, 5, 6, 7, 8, 9, and 10 WAP. Species were considered differentiable if ≥10 wavelengths were significant according to the Kruskal Wallis test at the P ≤ 0.1 level.

Plant Phenology
Spectral differences between species were detected as early as 1 WAP in 2016 and 2 WAP in 2017 at the canopy level but were not constant season-long with changing plant phenology (Figures 1–4). Plant species in this study at gross, distinctly different phenologic stages according to Meier (Reference Meier2001), were often differentiable (Table 3). Therefore, plants with early-establishing canopies were more readily differentiated early in the season from species with more slowly establishing canopies. Early-season differentiation was seen for most species in the VIS and NIR, coinciding with the establishment of the plant canopy. The group-wise differences resulting from the Kruskal-Wallis test occurring early in the season were likely due to the quick canopy establishment of sweetpotato (transplanted), cucumber, and Palmer amaranth. Cucumber germinated (~4 d) and established a canopy (large cotyledons and large true leaves) more quickly than other species (Table 3). Palmer amaranth quickly established a canopy after germination, allowing for adequate leaf area for detection of the species compared with bare ground. Palmer amaranth’s rapid canopy establishment has been documented by others (Ehleringer Reference Ehleringer1983; Horak and Loughin Reference Horak and Loughin2006). Rapid canopy establishment resulted in higher absorbance in the spectra associated with chlorophyll a and b at 400 to 460 nm and 660 to 685 nm, respectively (Blackburn Reference Blackburn2007). Canopy establishment is also associated with greater NIR reflectance as a result of increased scattering in the leaf spongy mesophyll as leaf area increases (Asner Reference Asner1998; Jensen Reference Jensen2007), as seen in Figures 1 and 2.
Average Plant Phenology (BBCH Scale) With Weeks After Planting, Type of Spectral Measurement, Date, and Growing Degree-Days When Spectral Measurements Were Taken; Horticulture Field Laboratory, Raleigh, NC, from May to August for 2016 and 2017.

a Abbreviations: CR, common ragweed; CU, cucumber; LC, large crabgrass; PA, Palmer amaranth; PN, peanut; SB, soybean; SP, sweetpotato; WAP, weeks after planting; YN, yellow nutsedge.
b Cumulative growing degree-day calculated using a base temperature of 10 C from the day of crop and weed planting.
c Phenology determined using method of Meier (Reference Meier2001).
Seasonal phenologic changes are often associated with the accumulation of biomass, reproduction, and senescence. Cucumber and Palmer amaranth spectra showed an increase in reflectance during flowering in the VIS around 550 nm at 7 WAP (2017) for cucumber and 6 WAP (2016) and 8 WAP (2017) for Palmer amaranth compared with other species in the study (Figures 1 and 2). Changes in spectra due to phenology have been observed for weeds in other systems as well. Andrew and Ustin (Reference Andrew and Ustin2009) highlighted the small white flowers of perennial pepperweed (Lepidium latifolium L.), an invasive herb pervasive in the West and Midwest, as important for detecting spectral differences between it and other species in the landscape.
In the early season, differentiation of plant reflectance spectra was often tied to the VIS and NIR (Figures 1 and 2). Spectral differences between species after canopy establishment, in the latter part of the season, shift from the NIR to the VIS, SWIR1, and SWIR2 regions. Others have reported that SWIR spectral regions are associated with key plant structural components such as lignin, starch, and cellulose, often tied to plant maturation (Curran Reference Curran1989; Kokaly et al. Reference Kokaly, Asner, Ollinger, Martin and Wessman2009; Thenkabail et al. Reference Thenkabail, Enclona, Ashton and Van Der Meer2004). When some species were at maturation, such as Palmer amaranth, cucumber, and sweetpotato, other species such as peanut, yellow nutsedge, and soybean were still in a vegetative or reproductive stage. Furthermore, at soybean flowering, sweetpotato, Palmer amaranth, and cucumber had begun to senesce, which is indicated by the lower reflectance in the NIR and SWIR regions and increase in reflectance in the VIS regions as chlorophyll is broken down. Absorbance in the VIS between 550 nm and 700 nm became less as both of these species began to senesce, reducing chlorophyll absorbance from 8 WAP to 10 WAP for cucumber and Palmer amaranth (Figure 2). Because Palmer amaranth and cucumber followed similar phenologic patterns throughout the season, they were often spectrally indistinguishable over many spectra (Supplementary Figures S7 and S8). At the time that cucumber and Palmer amaranth are beginning to senesce, peanut, soybean, and large crabgrass are beginning reproduction. Species that were phenologically different from one another were often more easily distinguishable, especially in the VIS, SWIR1, and SWIR2 regions. These include peanut and soybean (Supplementary Figures S4 and S5), sweetpotato and soybean (Supplementary Figures S5 and S6), and large crabgrass and cucumber (Supplementary Figures S9 and S10). Although phenology is not the only component of species differentiation, it plays a key role in seasonal changes in reflectance spectra.
Differences in plant phenology, such as the quick establishment of leaf canopies, the timing of plant emergence, the emergence of reproductive structures, or plant senescence, can be useful when using remote sensing to differentiate between species. Other studies have looked at spectral differences at distinct phenologic time points (Burks et al. Reference Burks, Shearer, Green and Heath2002; Peña-Barragán et al. Reference Peña-Barragán, López-Granados, Jurado-Expósito and García-Torres2006), but the present study shows that spectra change with even minor changes in plant phenology. Because these phenologic changes between species are not aligned, changing phenology can be exploited for species separation but may not be consistent from year to year, based on environmental conditions. This approach does require knowledge of the biology and ecology associated with the species of interest, and plant phenology should be considered when using remote sensing for species differentiation.
Spectral Regions of Interest
Throughout the season the VIS region (350–700 nm) was important for species differentiation. Differentiation consistently occurred in pairwise comparisons of species in broad spectral regions around the blue (450 nm) and red (670 nm) (Supplementary Figures S1–S14) and are tied to plant chlorophyll content (Xue and Yang Reference Xue and Yang2009). Some species in this study had a variable green color (namely, sweetpotato and nutsedge) around the green spectra (550 nm). In addition, NIR spectra (701–1300 nm), as previously mentioned, were important for early-season differentiation. SWIR1 and SWIR2, especially around peaks in these regions (1,550–1,690 nm and 2,025–2,200 nm for SWIR1 and SWIR2, respectively), in addition to VIS, can provide species differentiation and can change significantly throughout the season. The optimal time to take these measurements is between 2 and 5 WAP. Spectral differences between species in SWIR1 and SWIR2 were typically present by 5 WAP in both years. The SWIR1 and SWIR2 spectral regions have not been included in previous weed/crop differentiation research (Koger et al. Reference Koger, Shaw, Reddy and Bruce2004; López-Granados et al. Reference López-Granados, Peña-Barragán, Jurado-Expósito, Francisco-Fernández, Cao, Alonso-Betanzos and Fontenla-Romero2008; Menges et al. Reference Menges, Nixon and Richardson1985; Peña-Barragán et al. Reference Peña-Barragán, López-Granados, Jurado-Expósito and García-Torres2006), to our knowledge. The inclusion of these spectral regions in SWIR1 and SWIR2 for future sensor development could provide additional data that could be used for spectral differentiation and improve the accuracy of future site-specific management techniques.
Canopy Versus Leaf-Level Spectra
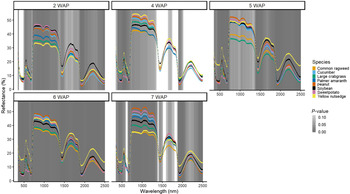
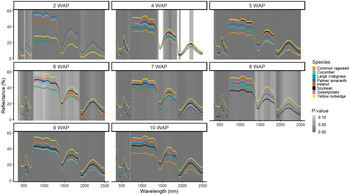
As plant phenology changes throughout the season, biophysical changes such as cuticle thickness, anthocyanin accumulation, and canopy structure may affect reflectance spectra (Ahmadiani et al. Reference Ahmadiani, Robbins, Collins and Giusti2016; Asner Reference Asner1998; Dayan et al. Reference Dayan, Green, Weete and Hancock1996; Islam et al. Reference Islam, Yoshimoto, Terahara and Yamakawa2002). Many of these biophysical changes can be detected on the leaf level, but not all of these changes translate to canopy-level spectra (Figures 1, 2, 5–8). Studies using only leaf-level spectra negate gross morphologic properties (e.g., leaf angle, plant canopy structure, the presence of inflorescence) but may provide additional information for species discrimination (Henry et al. Reference Henry, Shaw, Reddy, Bruce and Tamhankar2004b; Vaiphasa et al. Reference Vaiphasa, Skidmore, de Boer and Vaiphasa2007). In the present study, with a 0.44-m2 GIFOV, data collected from the canopy level comprised mixed spectra containing soil and foliage. The mixed spectra collected from the canopy accounts for the gross morphology and leaf arrangement of each species. Leaf-level measurements enable the determination of differences occurring within the measured leaf, removing effects of plant morphology. Results of this study demonstrate that certain species have unique spectra on the leaf level that were not always present in the canopy-level spectra.
Lower leaf spectral reflectance curves for crop and weed species, Raleigh, NC, 2016. Species are indicated by color and reflectance spectra grouped by weeks after planting (WAP). Wavelengths at which species differences, as indicated by the Kruskal-Wallis at test P ≤ 0.1, are indicated as a continuous variable behind the spectral reflectance curves. Common ragweed spectra are not included at 2 WAP, because of slow weed emergence.

Lower leaf spectral reflectance curves for crop and weed species, Raleigh NC, 2017. Species are indicated by color and reflectance spectra grouped by weeks after planting (WAP). Wavelengths at which species differences, as indicated by the Kruskal-Wallis at test P ≤ 0.1, are indicated as a continuous variable behind the spectral reflectance curves. Common ragweed and soybean spectra are not included at 2 WAP, because of slow emergence.

Upper leaf spectral reflectance curves for crop and weed species, Raleigh NC, 2016. Species are indicated by color and reflectance spectra grouped by weeks after planting (WAP). Wavelengths at which species differences, as indicated by the Kruskal-Wallis at test P ≤ 0.1 are indicated as a continuous variable behind the spectral reflectance curves. Common ragweed spectra are not included at 2 WAP, because slow weed emergence.

Upper leaf spectral reflectance curves for crop and weed species, Raleigh, NC 2017. Species are indicated by color and reflectance spectra grouped by weeks after planting (WAP). Wavelengths at which species differences, as indicated by the Kruskal-Wallis at test P ≤ 0.1, are indicated as a continuous variable behind the spectral reflectance curves. Common ragweed and soybean spectra are not included at 2 WAP, because of slow emergence.

Sweetpotato
Leaf-level spectra for sweetpotato exhibited unique reflectance when compared with other species in the study. Sweetpotato exhibited a notable absorption feature in upper leaves at 550 nm normally denoted by a peak in green reflectance (Wu et al. Reference Wu, Chavana-Bryant, Prohaska, Serbin, Guan, Albert, Yang, van Leeuwen, Garnello, Martins, Malhi, Gerard, Oliviera and Saleska2017) (Figures 7 and 8). New leaves of ‘Covington’ sweetpotato are often a burgundy color due to high levels of the anthocyanins cyanidin and peonidin (Ahmadiani et al. Reference Ahmadiani, Robbins, Collins and Giusti2016; Islam et al. Reference Islam, Yoshimoto, Terahara and Yamakawa2002), which have absorbance spectra at 540 nm and 546 nm, respectively. The presence of these anthocyanins in young sweetpotato leaves is likely the cause of the absorption feature around 550 nm (Asen et al. Reference Asen, Stewart and Norris1972; Rustioni et al. Reference Rustioni, Bedgood, Failla, Prenzler and Robards2012). The concentration of anthocyanin in the young leaves act as photoprotectants, because anthocyanin concentration decreases with increased leaf shading (Islam et al. Reference Islam, Jalaluddin, Garner, Yoshimoto and Yamakawa2005). Leaves of ‘Covington’ sweetpotato transition to green as they mature. Despite the differences seen in the upper leaves of sweetpotato, the absorbance seen around 550 nm is not detected in the canopy-level reflectance (Figures 1 and 2). This could be due to the relatively low ratio of newly emerged burgundy leaves to mature green leaves. However, using spectra that are unique to specific crops or weeds could be exploited to provide additional parameters for species separation and improved site-specific management.
Yellow Nutsedge
In addition to unique spectra of sweetpotato, leaf-level spectra for yellow nutsedge tended to have higher overall reflectance across the VIS, SWIR1, and SWIR2 for upper and lower leaf measurements compared with other species in the study (Figures 5–8). Other researchers have noted that the leaf surface and visual appearance differ from that of other weed or crop species, including soybean (Dayan et al. Reference Dayan, Green, Weete and Hancock1996). Furthermore, yellow nutsedge in this study had high amounts of wax on the leaf surface. Low reflectance at 1 WAP for yellow nutsedge may be linked to a lack of development of these leaf traits. Brighter reflectance at measurements after 1 WAP may be related to this thick waxy cuticular layer in addition to a thick upper epidermis and uniformly distributed Kranz anatomy, which is common in C4 plants and distinguished by thick cell walls and chlorenchyma cells containing chloroplasts surrounding vascular bundles in the leaf (Wills Reference Wills1987; Wills et al. Reference Wills, Hoagland and Paul1980). The development of accessory and Kranz cells characterized by thicker cell walls (Wills et al. Reference Wills, Hoagland and Paul1980) may increase light scattering, resulting in brighter reflectance in the VIS, SWIR1, and SWIR2 wavelengths. Differences observed in the SWIR1 and SWIR2 regions are often related to the development of lignin, cellulose, and starch in the plant (Youngentob et al. Reference Youngentob, Renzullo, Held, Jia, Lindenmayer and Foley2012). Previous studies (Cho et al. Reference Cho, Debba, Mathieu, Naidoo, Van Aardt and Asner2010; López-Granados Reference López-Granados2011) were able to differentiate species without using spectra in the SWIR1 and SWIR2 bands. However, the results from the current research suggest that both crop and weed species respond differently in the SWIR areas of the reflectance spectra. As a result, these spectra could be used to differentiate between species.
Plant Morphology
Leaf angle for most species was not consistent across the season and leaves tended to be more erect from 1 to 3 WAP. As each species matured, the leaf angle became more horizontal from 4 to 10 WAP, with some species having leaves angled down toward the soil surface (Figure 9). Other researchers have noted that reflectance spectra are influenced by leaf angle (Asner Reference Asner1998), and changes in leaf angle with changing phenology may affect the differentiation of species over time (Andrew and Ustin Reference Andrew and Ustin2009). In our study, plants that had horizontal foliage had similar spectral properties at the canopy level (Figures 1, 2, 9). Yellow nutsedge and large crabgrass, two species that have narrow erect leaves, were spectrally different at the upper and lower leaf level across measurement dates. Both species initially exhibited an erect growth habit. However, large crabgrass became more prostrate at 3 to 4 WAP, whereas yellow nutsedge maintained upright growth (Figure 9), resulting in changes in spectral reflectance at the canopy level. The influence of canopy structure on spectral reflectance has been observed in previous research (Asner Reference Asner1998; Santos et al. Reference Santos, Hestir, Khanna and Ustin2012; Serbin et al. Reference Serbin, Singh, McNeil, Kingdon and Townsend2014; Xiao et al. Reference Xiao, Zhao, Zhou and Gong2014). Yellow nutsedge reflectance on the leaf level was high across the spectra measured (Figures 5–8) but had low reflectance in NIR and SWIR at the canopy level, indicating that canopy biophysical characteristics (Table 3; Figure 9) influenced overall reflectance (Figures 1 and 2). Also, the thickening of cuticular wax as leaves age (Yeats and Rose Reference Yeats and Rose2013) may contribute to changes in spectral reflectance (Lu Reference Lu2013). This change in cuticular thickness could also explain differences in upper and lower leaves of these species, because lower leaves would have developed a thicker cuticular layer. It should also be noted that differences in gross morphology alone do not ensure that species are spectrally dissimilar. In this study, Palmer amaranth and cucumber were not differentiable across large regions of spectra (Supplementary Figures S7 and S8) despite very different plant morphology. Palmer amaranth is an upright weed (Horak and Loughlin Reference Horak and Loughin2006), whereas cucumber has a prostrate growth habit. The converse can also be true where species with similar morphology tend to have similar spectra. Cucumber and sweetpotato are both prostrate in growth habit but were spectrally similar in both years of the study (Supplementary Figures S13 and S14). Although others have noted that spectral differences may be tied to gross morphology, these spectral differences are likely tied to both plant morphology and phenology.
Weekly mean leaf angle for 10 wk after planting (WAP) for peanut, cucumber, soybean ‘AG6535’, sweetpotato ‘Covington’, and Palmer amaranth, common ragweed, yellow nutsedge, and large crabgrass, Raleigh, NC, 2017. A leaf angle of 0° is parallel with the soil surface. Positive angles are more erect leaf angles and negative angles are indicative of leaf angles below parallel.

In this research, we have demonstrated that hyperspectral reflectance can be used to distinguish crop and weed species in situ. We have also further elucidated that small changes in phenology, in a little as a week, can affect plant spectra. In this study, species differentiation occurred across phenologic and seasonal time points, which have been noted by others in limited agricultural (Peña-Barragán et al. Reference Peña-Barragán, López-Granados, Jurado-Expósito and García-Torres2006) and nonagricultural (Ouyang et al. Reference Ouyang, Gao, Xie, Guo, Zhang and Zhao2013) settings. These changes in phenology can result in changes in leaf area, plant canopy structure, leaf color, or development of inflorescence or fruit. Plant phenology and biophysical characteristics have been linked to changes in hyperspectral reflectance spectra (Lausch et al. Reference Lausch, Salbach, Schmidt, Doktor, Merbach and Pause2015; Ouyang et al. Reference Ouyang, Gao, Xie, Guo, Zhang and Zhao2013; Schmidt and Skidmore Reference Schmidt and Skidmore2003). Plants at very different phenology and/or with different morphology positively contribute to differences in species reflectance spectra but are not distinctly tied to one or the other. We have demonstrated that early-season spectra used for differentiation of species were often tied VIS and NIR spectra. However, as plants continued to mature, differences in species spectra remained differentiable in the VIS, but the SWIR1 and SWIR2 regions increased in importance. Furthermore, in this study, we have demonstrated that unique leaf-level spectra that could be used for species differentiation are not always present in canopy-level spectra. Differences in biophysical and phenologic characteristics between species could be used to further aid in separating weed and crop species from one another using spectroscopy. We also demonstrated that differentiation of species does have an important temporal component and that spectra, when collected at a closely timed temporal frequency, are more likely to catch phenologic stages at which species can be differentiated.
Differentiation between species was analyzed by wavelength and did not account for the spectral difference over the entirety of the measured spectra. Additional analysis methods considering the shape and magnitude of the whole spectral reflectance may provide additional insight into spectral variations between species, which may include using principal component analysis, Bhattacharyya distance, Jefferies-Matusita distance, or discriminant analysis. Because of the importance of the phenologic stage on differentiation in our study, future studies should consider phenology when investigating species differentiation. To continue to close the gap between data collection and management decisions, researchers should examine the impact of mixed species on differentiation. We believe that to make species discrimination for site-specific weed management a viable option in the future, integration of multiple disciplines (e.g., machine learning, remote sensing, and agronomy) is required.
Acknowledgments
The authors thank the staff at the Horticulture Field Laboratory for their help in the maintenance of the study. Special thanks to Matthew Waldschmidt, Cole Smith, Matthew Bertucci, Spencer Monaco, Catherine Monaco, Andrea Genna, Anna Wyngaarden, Rachel Berube, and Lauren Deans for their assistance in study maintenance and data collection. Thanks to Christiana Ade and Megan Amanatides for their guidance and assistance in the data processing. This research received no specific grant from any funding agency, commercial, or not-for-profit sectors. No conflicts of interest have been declared.
Supplementary material
To view supplementary material for this article, please visit https://doi.org/10.1017/wet.2020.92