Introduction
Design research informs and supports practice by developing knowledge to improve the chances of producing successful products (Chakrabarti, Reference Chakrabarti2010). Therefore, designers must understand the emerging design trends. As the human, various emotional needs for automotive interior design will become an important core value of automotive culture. For the general public, extreme pursuits are not what they need in their daily lives. The design style and positioning of automobiles based on the needs of the general consumer has long been an impulsive purchase factor for the automobile consumption culture that affects drama (Chen et al., Reference Chen, Guan, Deng and Chang2000a), while the car design based on the emotional needs of individuals is extremely important.
Goal of vehicle interior design and affective engineering
The top five countries in the global automotive market are China, United States, Japan, India, and Germany (Chen et al., Reference Chen, Guan, Deng and Chang2000b). Every year the famous automobile magazine Wards Auto host “Wards 10 Best Interiors” conference and chosen for the publication's award the best 10 car interior that focus of the texture, material, comfort, shape, layout, and good overall design, etc., the nominated above picks from all the nowadays vehicle models in the global automotive market. In 2018, the 10 Best Interiors award models include Chevrolet, Hyundai, Infiniti, Kia, Lexus, Porsche, Lincoln, Land rover, ram, and Toyota. It will be seen from this that would find obvious that the value of the car interior is not only determined by the brand and the price. The automobile manufacturers began incorporating vehicle interior design direction in response to the driver's emotional needs.
A design is a plan by which some undesired reality is changed into some desired reality (Chakrabarti, Reference Chakrabarti, Chakrabarti and Subrahmanian2008). In human-centered design, user research drives design decisions by providing an understanding of end users (Roschuni et al., Reference Roschuni, Goodman and Agogino2013). According to Blessing et al. (Reference Blessing, Chakrabarti, Wallace and Cross1992, Reference Blessing, Chakrabarti and Wallace1995), the goal of design research is to develop knowledge to make the design more effective and efficient and to enable design practice to develop more successful products. Affective engineering is being increasingly used to describe a systematic approach to the analysis of consumer reactions to candidate designs. It has evolved from Kansei engineering, which supports communication across the disciplinary boundaries of the team and informs the conceptual design decision-making process when compromising between appeal and function (Delin et al., Reference Delin, Sharoff, Lillford and Barnes2007). Nagamachi (Reference Nagamachi1995) proposed Kansei engineering as a consumer-oriented technology for new product development to understand consumers’ Kansei preferences and practically improve product design.
In the present study, sensory experience and perceived value evaluation models were employed in the experiments to identify the factors that affected participants’ perceptions of images of automotive interior design. The results of both experiments were analyzed to identify the design factors that affected participants’ Kansei perceptions of interior design. The evaluation results of their sensory experiences and perceptions of value may serve as a reference for future automotive interior design.
The following three steps were performed for experiment preparation: (1) Kansei keyword selection: a wide variety of Kansei keywords were compiled and those suitable for a Kansei experiment on automotive interior design were selected; eight Kansei keywords were finally identified from the selected keywords by using hierarchical cluster analysis. (2) Vehicle sample selection: expert interviews and surveys were conducted to collect a wide variety of images of automotive vehicles and to obtain relevant information. The collected automotive images were divided into Asian, American, and European car models according to the country of origin and then into white-collar, middle-class, and general public brands according to buyer attributes. Each brand was then classified into A, B, and C segments, and a total of 27 types of vehicle images were identified for further real-vehicle experimentation. (3) Expert interviews and interior component classification: five automotive designers were recruited to identify 12 aspects (items) of the interior space based on its design, material, and color. These 12 items were then divided into 40 categories of design elements. After the experiment preparation was completed, two experiments on automotive interior design were performed: Experiment 1 (sensory experience) and Experiment 2 (perceived value evaluation). In Experiment 1, 60 participants with at least 5 years of driving experience were recruited to experience using 27 vehicle samples, and they rated each sample by assigning 1–7 points to each of the previously selected eight Kansei keywords based on their sensory experience. Hayashi's quantification theory type 1 (QT1) was performed on these scores to calculate the weight relationship between participants’ Kansei perceptions and the interior design elements. Experiment 2 was conducted by inviting 60 participants with car-purchasing experience for a perceived value evaluation of the eight Kansei keywords. First, automotive interior images were randomly shown to the participants, and the following four dimensions for measuring a consumer perceived value (CPV) were introduced: quality, emotion, price, and society (Sweeney and Soutar, Reference Sweeney and Soutar2001). According to the aforementioned dimensions, each participant completed a survey including items pertaining to the influence level of the eight Kansei keywords. Factor analysis was performed on the scores assigned by the participants to derive the influencing factors of these dimensions.
This study separately conducted experiments concerning Kansei image and perceived value using two models – the sensory experience and perceived value evaluation models – to identify the correlations between Kansei values for the automotive interior design given by users. The experiments aimed to assess participants’ sensory experience and perceptions of value. The results related to the sensory and psychological expectations of the participants concerning automotive interior design were determined after incorporating the assessment of designed items as determined in Experiment 1 with the factors confirmed in Experiment 2. Moreover, the participants’ descriptions of their perceptions can be concretized into design factors, thereby enabling automotive interior designers and developers to understand what users demand for interior design and in turn fulfill customized design requirements. This study determined user perceptions of automotive interior design by experimentally exploring users’ sensory experience and perceptions of value. Similar research methods can be applied in studies of automotive appearance and components in the interest of meeting consumers’ Kansei demands.
Sensory experience
In 1995, the Japanese scholar Mitsuo Nagamachi proposed the Kansei engineering method, a consumer-oriented technology for new product development. KE is defined as “translating technology of a consumer's feeling and image for a product into design elements” (Nagamachi, Reference Nagamachi1989). Kenichi Yamamoto, the President of MAZDA Motor Corporation, stated that cars must contribute to cultural creativity and that this concept should be the focus for developing the automotive culture.
Numerous studies have employed KE to explore topics on cars. For example, Jindo and Hirasago (Reference Jindo and Hirasago1997) studied the design of car interiors and cockpits; Lai (Reference Lai2005) and Chang (Reference Chang2007) examined driver preferences regarding car appearance; Luo investigated the design of wheel hubs; Smith and Fu (Reference Smith and Fu2011) examined the Kansei design of car head-up displays; and Satake et al. (Reference Satake, Xin, Tianming, Hansuebsai, Ando, Sato, Kajiwara and Ohsawa2011) investigated the emotional assessment of automotive exterior colors. For many people, particularly those with long commute times, cars have effectively become multifunctional living spaces. With the development of technologies such as global positioning systems and MP4 players, people use their cars as a space for media consumption, as a personal communication center, or as an interconnected workplace. Many people spend two or more hours in their cars engaged in tedious routine driving tasks every day (Rosli et al., Reference Rosli, Ariffin, Sapuan and Sulaiman2014). To improve the quality of this time so that it becomes more useful and safer for drivers, providing a high-quality sensory experience to users and generating effective perceived value evaluations of the insides of automobiles are essential.
Among extant research on the five senses, Jordan (Reference Jordan2000) explored the relationship between car interiors and the five senses, and indicated that when car interiors appeal to user needs, they can generate consumer satisfaction and promote sales. Chen et al. (Reference Chen, Guan, Deng and Chang2000a, Reference Chen, Guan, Deng and Chang2000b) reported that functionality is not the only factor influencing product perception and preferences; instead, consumer purchase intentions and use behaviors can be developed through comprehensive product assessments based on actual experiences derived from the five senses (hearing, sight, smell, touch, and taste). Takahashi (Reference Takahashi2008) revealed that with the rise of the experience economy, products have become increasingly similar. If products can be designed to stimulate the five senses, they can enhance multiple interactions in the form of experiential marketing that consumers enjoy. Soota et al. (Reference Soota, Singh and Mishra2000) stated that the manufacturers must realize customer needs and expectations and modify existing or new products to achieve market success. Lin (Reference Lin2007) argued that it is crucial for companies to develop their service quality by reducing the gap between functionality and customer satisfaction.
Perceived value evaluation
Customers perceive value in all purchase procedures, even during the time before the purchase (Woodruff, Reference Woodruff1997). CPV, which is more individualistic and personal than quality, is a higher-level abstraction than a specific product attribute and is a tradeoff between what is paid and received by the consumers, whereas quality is only a component received by consumers in the value equation (Zeithaml, Reference Zeithaml1998). Parasuraman and Grewal (Reference Parasuraman and Grewal2000) considered CPV to be the most crucial indicator of repurchase intentions. Sweeney and Soutar (Reference Sweeney and Soutar2001) measured CPV by using four dimensions: quality (measured by the quality of received services or product performance), emotion (measured by the level of emotions experienced by the customer when purchasing or receiving services), price (measured by comparing the price and functions of the product or the service purchased by the consumer), and society (measured by the social perceptions of the consumer's image after purchasing or using the product). In summary, CPV is an overall evaluation of what is paid or received by the consumer, complying with the statement of Cronin et al. (Reference Cronin, Brady and Hult2000) that repurchase intentions are often influenced by CPV. Perceptions are a crucial factor affecting consumers’ preferences and purchasing behavior; thus, a comprehensive evaluation of consumers’ perceptions can be used to infer their purchasing behaviors (Chen et al., Reference Chen, Guan, Deng and Chang2000a, Reference Chen, Guan, Deng and Chang2000b). Because CPV is based on consumers’ perceptions, Kansei images are critical for influencing consumers’ preferences toward a product (Pu et al., Reference Pu, Chen and Shieh2015). Hsiao et al. (Reference Hsiao, Tsai and Wu2009) indicated that customers generally spend approximately 3 min for examining the exterior of a vehicle product but spend 15 min for inspecting the interior design, implying the importance of automotive interior design. Thus, the present study not only adopted a Kansei engineering perspective but also conducted perceived value experiments to comprehensively identify the factors affecting consumers’ perceptions toward automotive interior designs.
Methodology and stimuli
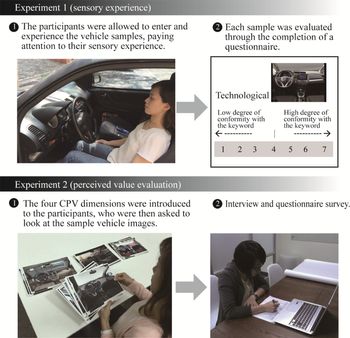
Two experiments were conducted in this study. In Experiment 1 (sensory experience), 60 participants with at least 5 years of driving experience were recruited to drive 27 selected vehicle samples and rate each of them by assigning 1–7 points to each of the eight Kansei keywords. The sensory experience experiment was initiated when the participants entered the vehicle. The scores were then analyzed using QT1 to calculate the weight relationship between participants’ Kansei perceptions and the interior design elements. Experiment 2 (perceived value evaluation) was performed by inviting 60 participants with car-purchasing experience to view vehicle images. The researcher introduced the aforementioned four CPV dimensions to the participants. Subsequently, the participants viewed the sample vehicle images and filled out questionnaire items pertaining to the influence level of the eight previously selected Kansei keywords according to these dimensions. Factor analysis was performed on the scores assigned by the participants to determine the factors influencing these four dimensions.
The experiments lasted for 2 days with each participant engaging in the sensory experience experiment on the first day and perceived value evaluation on the second day (Fig. 1).
Experimental procedures.

The following four steps were performed for experiment preparation: Kansei keyword selection, vehicle sample selection, expert interviews and interior component classification, and participant selection and analysis. These steps are provided in further detail below.
(1) Kansei keyword selection
A total of 30 participants with a design background were recruited to select suitable keywords:
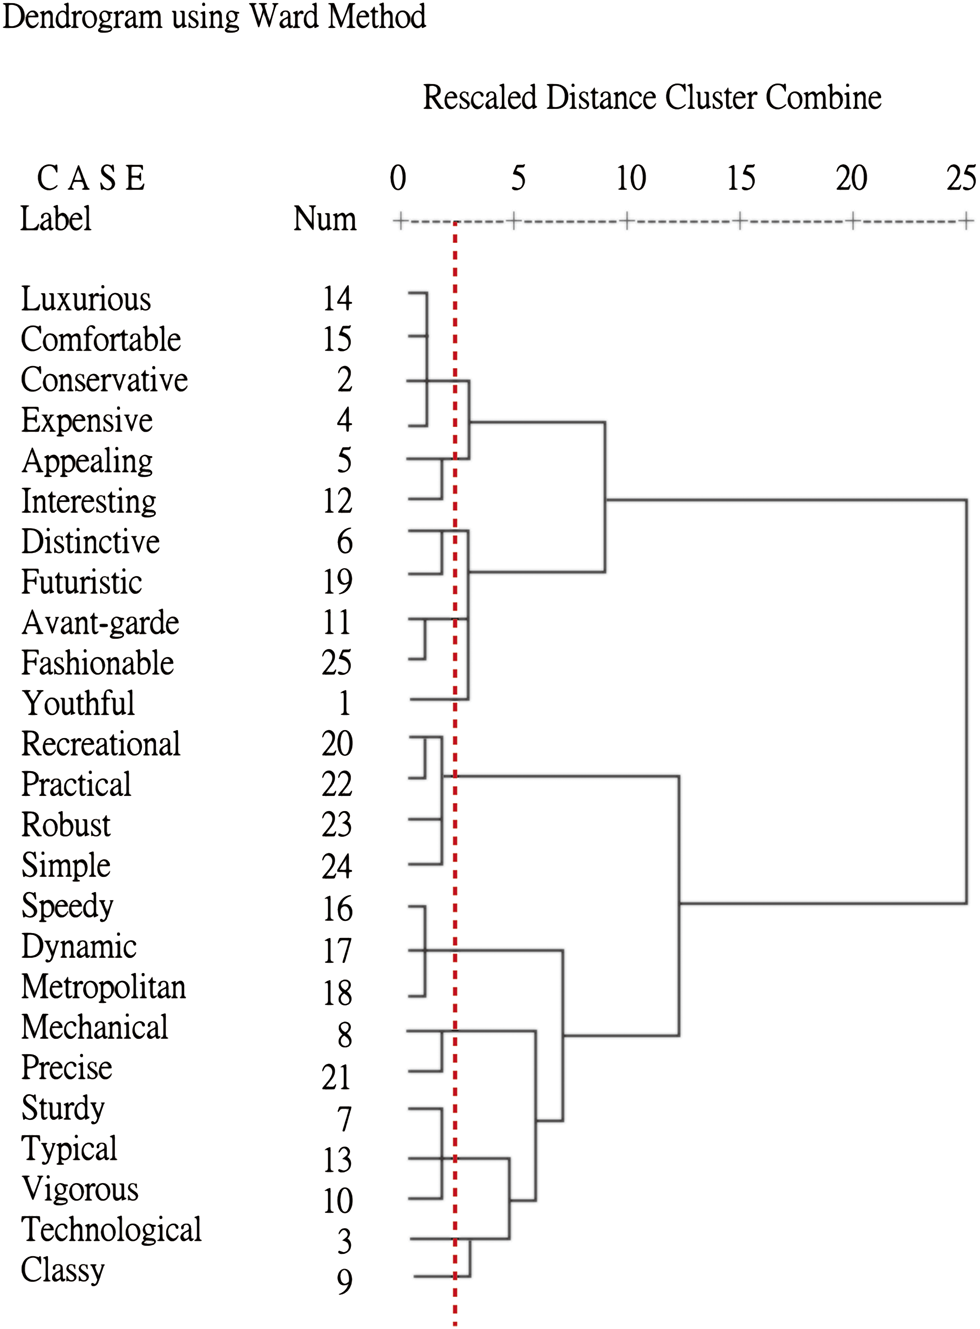
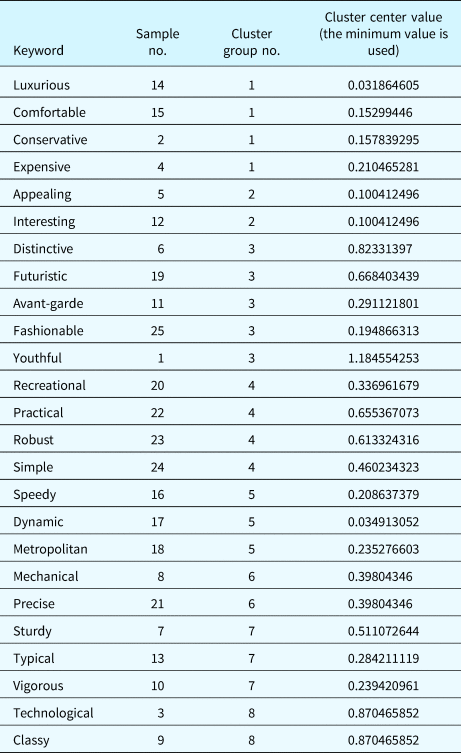
1. Collection and identification of suitable Kansei keywords: by referring to previous studies of Kansei engineering, the research team identified 100 keywords suitable for describing an automotive interior. When experiencing and evaluating automotive interior, users tend to focus on visual and haptic experience. Therefore, words such as novel and clean are less appropriate. 2. Rating and classification of the keywords: the research team invited 30 experts, to select appropriate keywords for describing automotive interior by rating the 100 keywords on a scale of 1–5 points according to their professional judgment. A total of 25 keywords that received an average score in excess of 3.8 were selected. Next, the research team used a hierarchical cluster analysis to classify the words according to their similarity. Because the participants would be required to rate the designs of various automobile models, it was necessary that only simple and accurate words be selected to avoid overlong experiments that would exert excessive pressure on the participants. Thus, the hierarchical cluster analysis was conducted to produce an accurate selection (Fig. 2). Selection of representative words: the analysis results indicated that the words were categorized into eight groups. Subsequently, multidimensional scaling was employed to determine the word in each category that was the closest to the center; this was the word with the lowest value. The resultant eight words were the Kansei keywords that optimally represented their groups from the participants’ perspective (Table 1). Thus, the representative keywords for the eight clusters were luxurious, interesting, fashionable, recreational, dynamic, precise, vigorous, and technological.
Fig. 2.Keyword clustering.
 Table 1.
Cluster center value calculation


(2) Vehicle sample selection
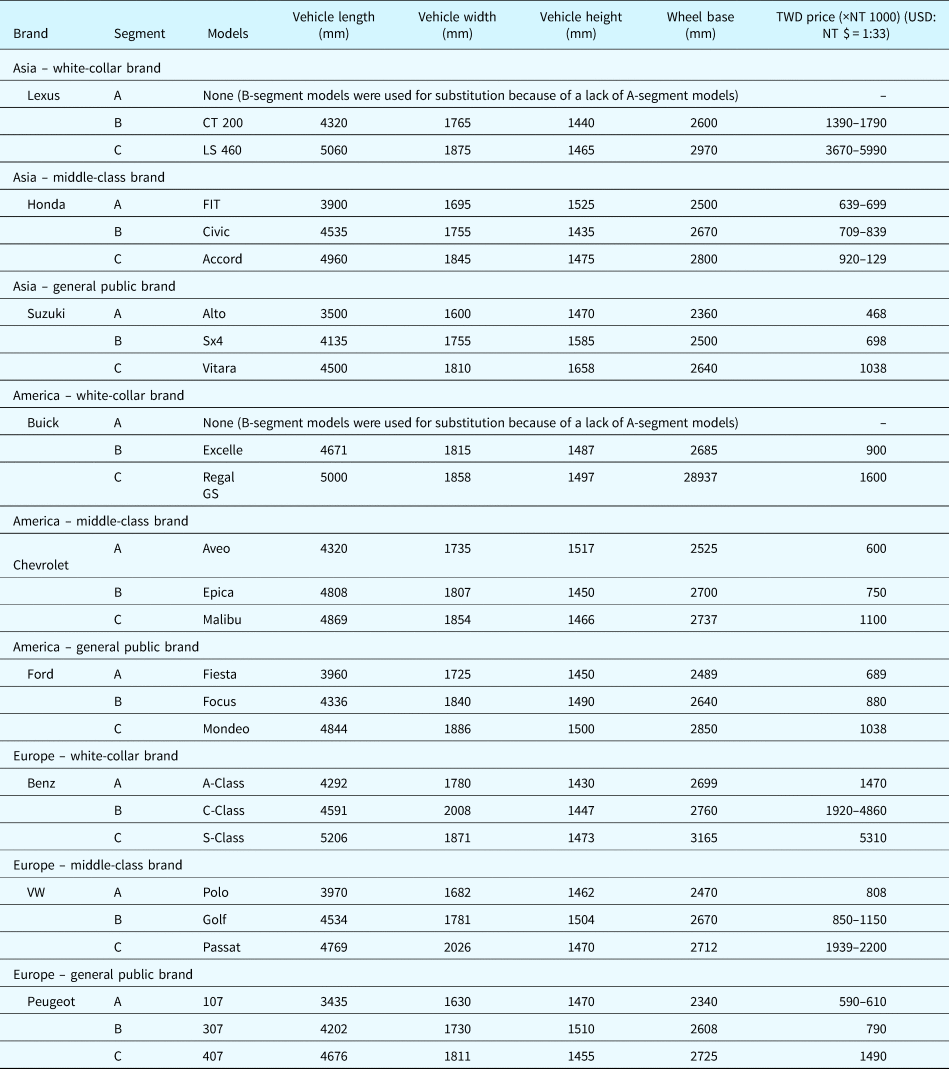
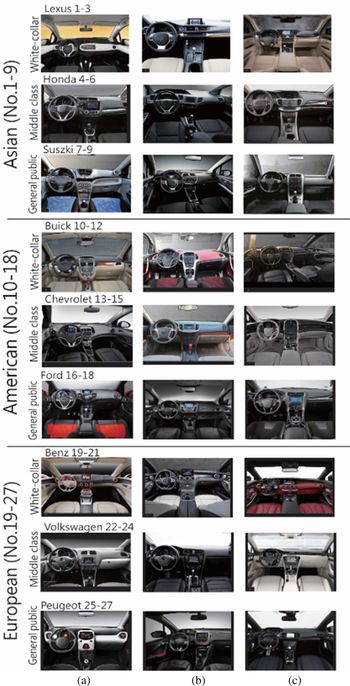
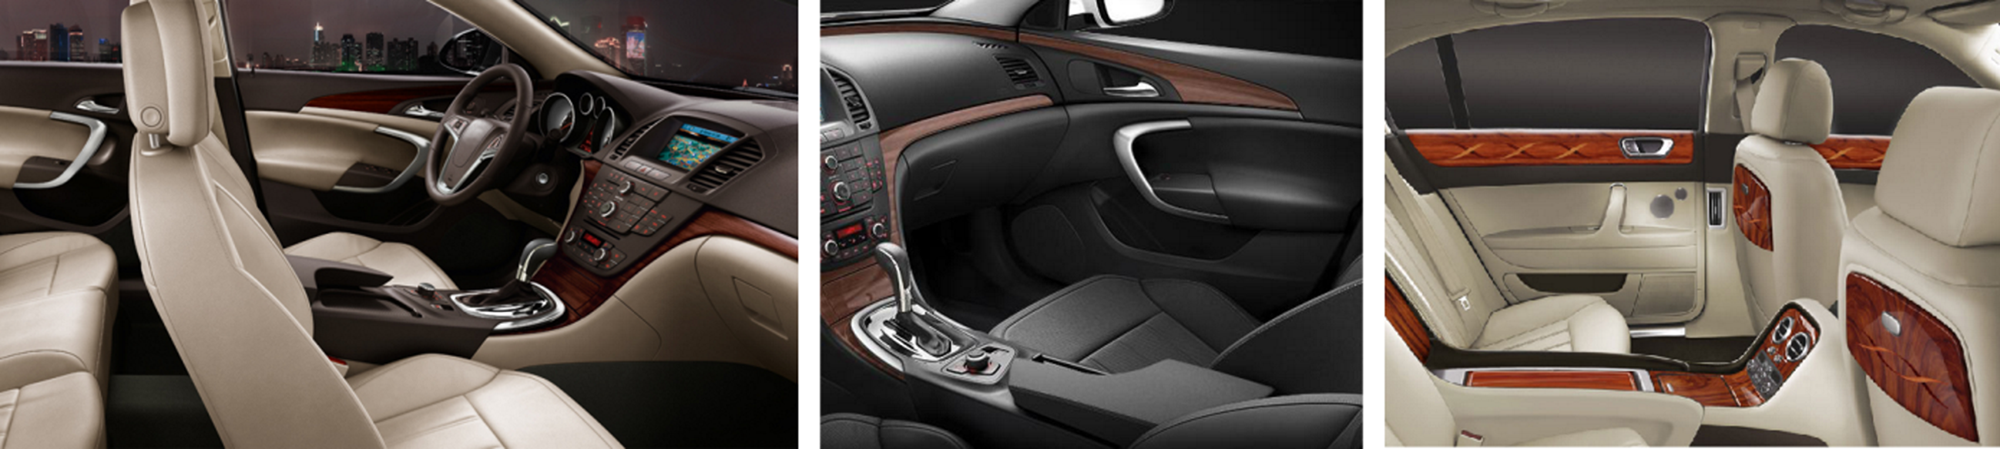
A wide variety of images of automotive vehicles on the market were compiled, and the information of these vehicles was collected. Based on expert opinions, these images were first divided into Asian, American, and European car models according to the country of origin and then into white-collar, middle-class, and general public brands according to buyer attributes. For each brand, images of vehicle interior designs were collected. For instance, vehicle interior design images of Asian brands, including Toyota, Honda, Subazu, Nissan, and Suzuki, were compiled and divided according to buyer attributes into three groups, each of which was then classified into A, B, and C segments. For example, car models for Suzuki, one of the general public brands, therefore included Alto, SX4, and Grand Vitara models, determined according to Suzuki's segments. Accordingly, a total of 27 types of vehicles were obtained according to their place of origin (Asia, America, and Europe), buyer attributes (white collar, middle class, and general public), and individual segment (A, B, and C). Real-life models of these 27 samples were used for the subsequent experiment (Table 2). The interior designs of these models are illustrated in Figure 3. Before the initiation of the sensory experience experiment, the researcher concealed the models’ brand logo to reduce the influence of the brand image on participants’ perceptions.
Vehicle samples used in Experiment 1

Interior design of sample models.

(3) Expert interviews and interior component classification
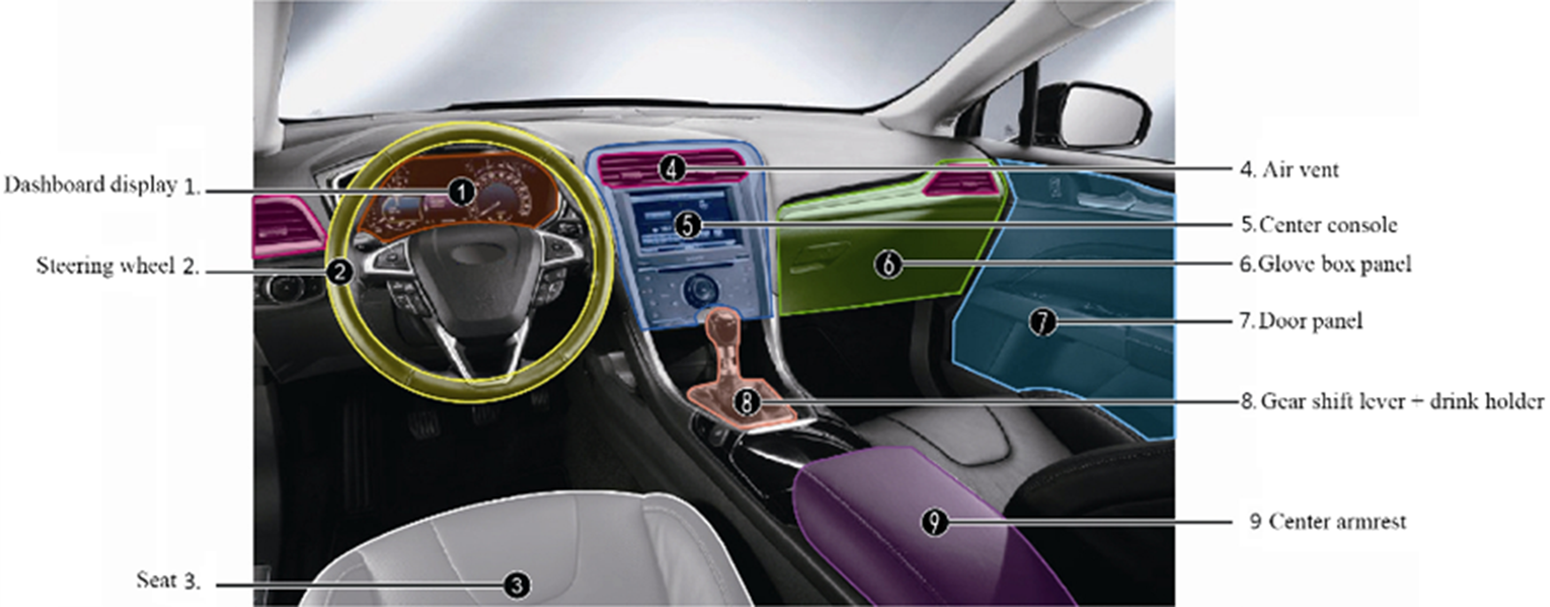
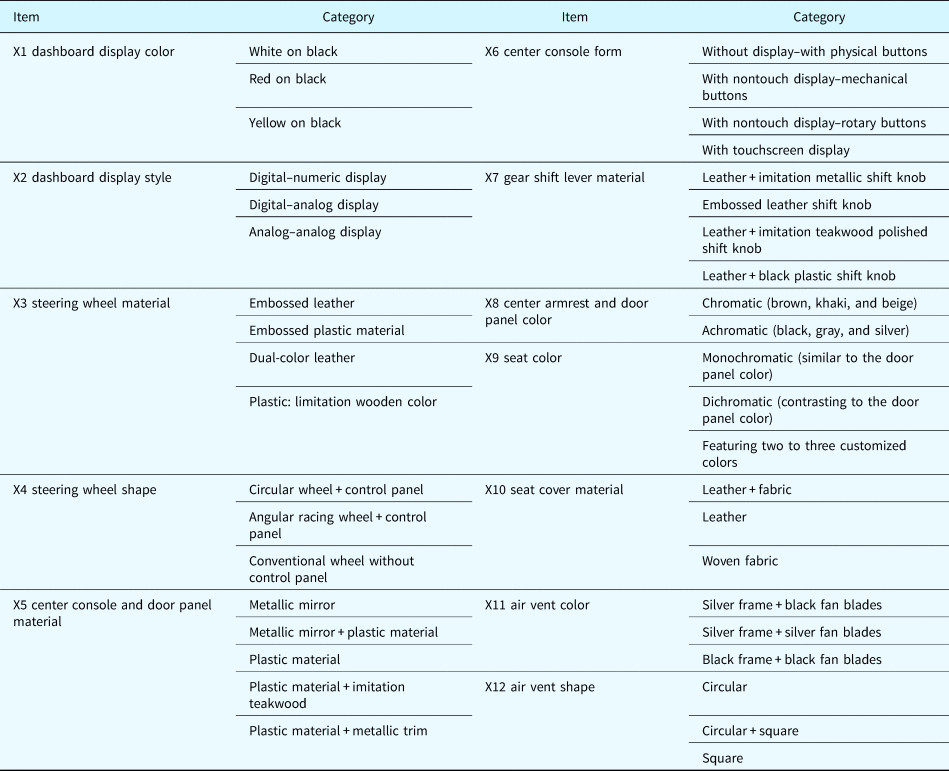
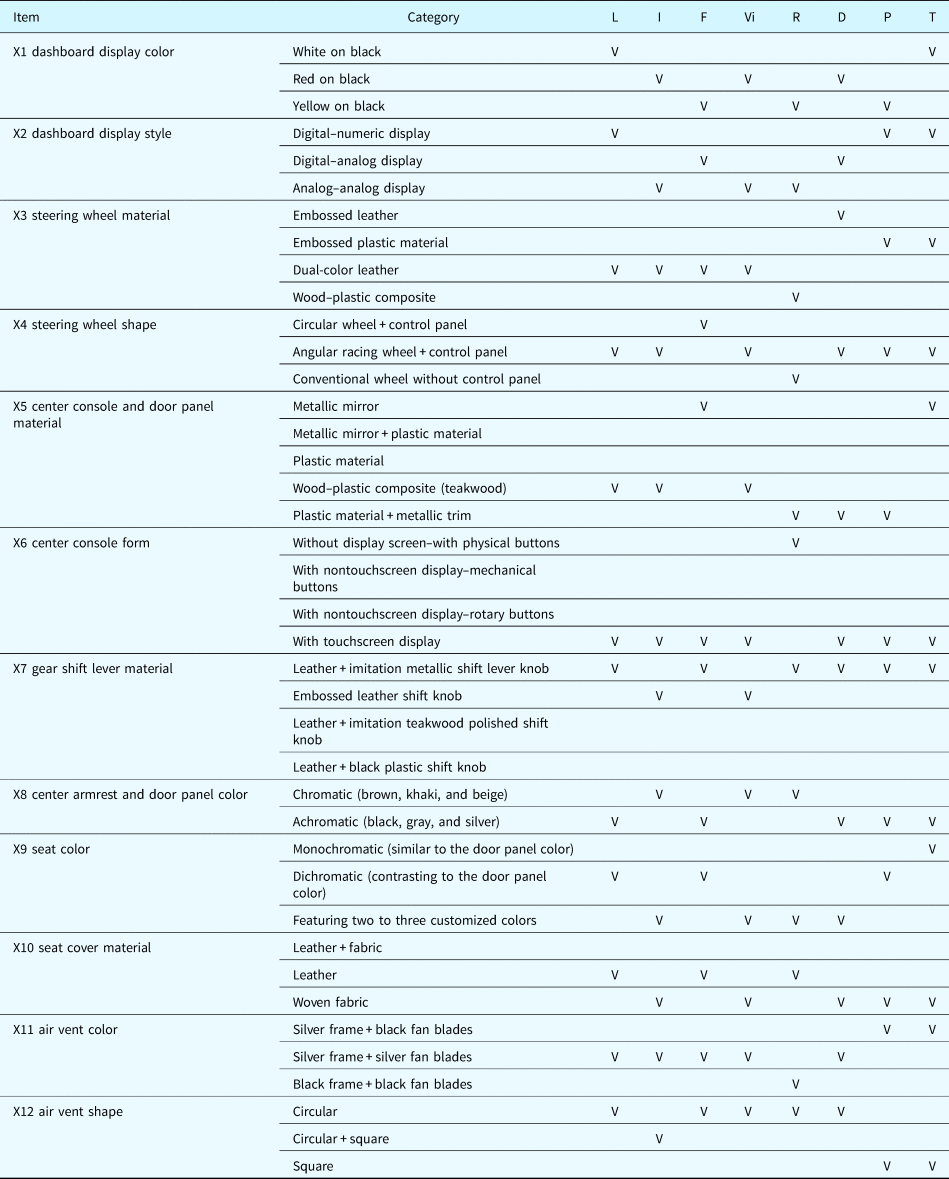
According to the interviews of five automotive design experts, the researcher divided the interior operating space into nine areas (Fig. 4) and then classified these areas into 12 items according to the attributes of these items, including dashboard display color, dashboard display style, steering wheel material, steering wheel shape, center console and door panel color, center console form, gear shift lever material, central armrest and door panel color, seat color, seat material, air vent color, and air vent shape. These 12 items were further divided into 40 categories according to their style or form, material, and color (Table 3).
Automotive interior space.

Automotive interior design classification

(4) Participant selection and analysis
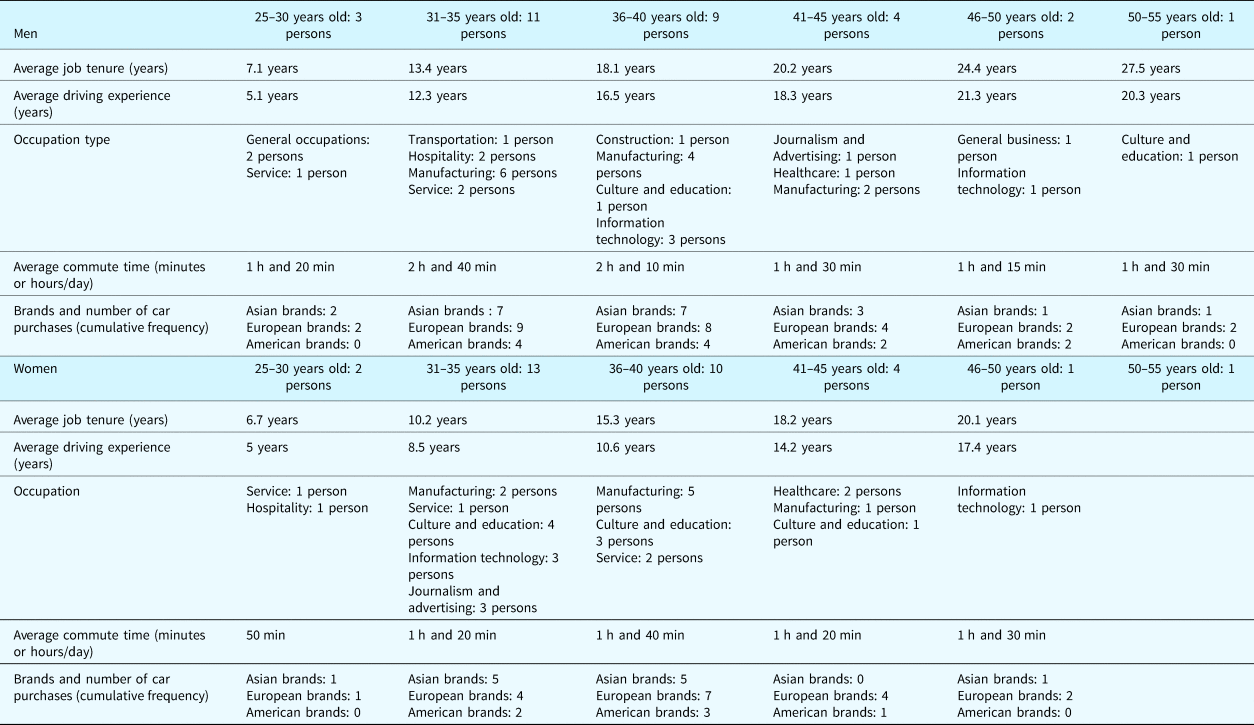
A total of 60 participants were recruited to engage in the two experiments. The participants were aged between 25 and 55 years, the number of men and women was both 30, and they had all been driving cars for ≥5 years and had purchased cars. Table 4 presents the age, working experience, job tenure, driving experience, occupation, daily commuting time, and car-purchasing experience of the participants. The daily commute averaged 1 h and 30 min, indicating that the participants generally spent considerable time in the car. Men had purchased two cars on average, whereas women had purchased one. The likelihood of car purchase was high among the participants aged 25–55, suggesting that automobiles were a common transportation tool. Thus, this study aimed to understand consumer psychology by identifying the automotive interior design that best met consumers’ expectations.
Description of the participants

Experiments and analyses
Sensory experience
QTI was adopted for the experiment concerning the sensory experience. When assessing product quality, QTI is often performed by measuring the affecting weight and levels of product factors based on the preferences among users. The resultant scores from Experiment 1 were used to calculate the partial correlation coefficients for 12 items (i.e., x1–x12) and weights of each category. An item with a high partial correlation coefficient has a considerable effect on perception, a category weight indicates the item with the highest demonstrated the effect in its category, and a multiple correlation coefficient (R; explained variation) represents the reliability of the predictive value concerned. An item with an R value of 0.40–0.69 indicates a high correlation with the predictive-value reliability. An item with an R value of 0.7–1.00 suggests an extremely high correlation with the predictive-value reliability.
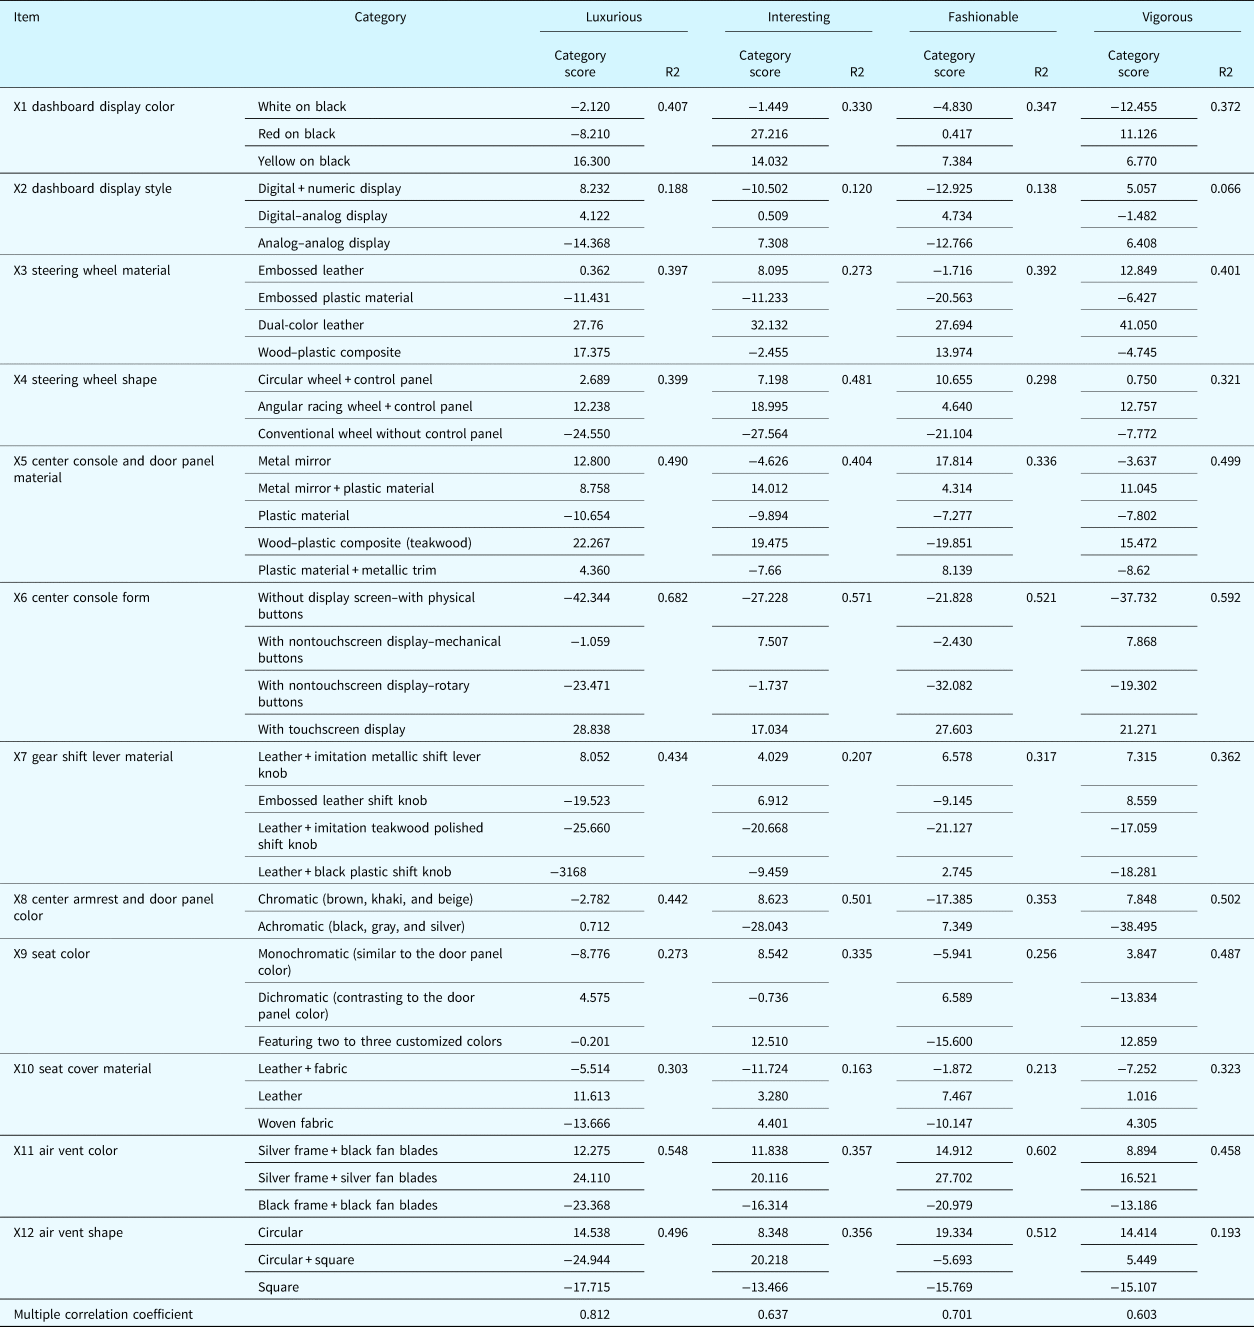
In terms of luxurious, interesting, and vigorous, X6 center console form showed the highest partial correlation coefficients among all items, and with touchscreen display exhibited the highest category scores among all categories under X6, and the multiple correlation coefficients of the three aforementioned keywords were all higher than 0.6, suggesting a high correlation. In terms of fashionable, X11 air vent color showed the highest partial correlation coefficient among all items (i.e., 0.602); silver frame + silver fan blades exhibited the highest category score among all categories under X11, and the multiple correlation coefficient was 0.701, implying a high correlation (Table 5).
Analysis of interior design items stratified by luxurious, interesting, fashionable, and vigorous

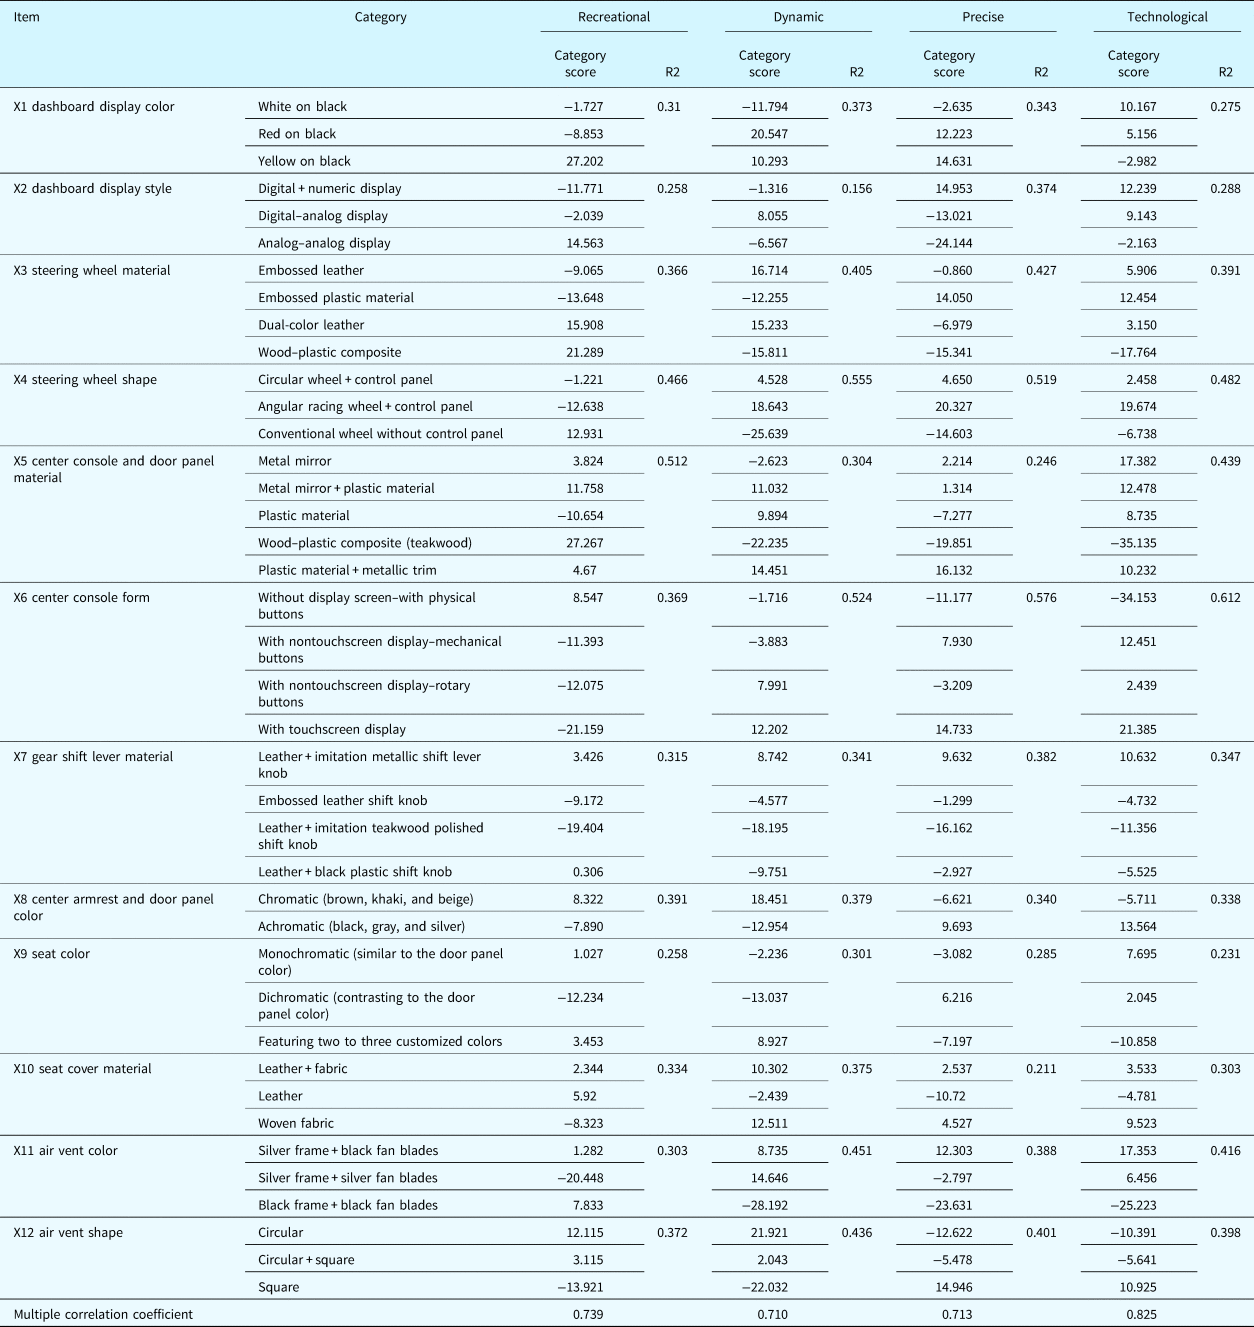
In terms of recreational, X5 center console and door panel material showed the highest partial correlation coefficient among all items (i.e., 0.512); plastic material + imitation teakwood exhibited the highest category score among all categories under X5, and the multiple correlation coefficient was 0.739, suggesting a high correlation. In terms of dynamic, precise, and technological, X6 center console form showed the highest partial correlation coefficients among all items, and the multiple correlation coefficients were all higher than 0.7, implying a high correlation (Table 6).
Keyword analysis: recreational, dynamic, precise, and technological

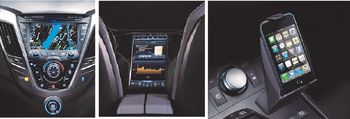
A comprehensive analysis of the results of Experiment 1 (sensory experience) demonstrated that X6 center console form and its category with touchscreen display exerted the largest influence on the perceptions of luxurious, interesting, vigorous, dynamic, precise, and technological, conforming to the current trend of the prevalent use of touchscreen displays. Nowadays, consumers generally consider an interface that features touchscreen functions, three-dimensional simulation, and real-time interaction as more entertaining and technological than one involving conventional push buttons or rotary buttons. In addition, touchscreen operation, which has become a major trend for current technological devices (e.g., automotive navigation systems, mobile phones, and car televisions), enables multiple functions and a consistent operating procedure, which can affect consumers’ perceptions (Fig. 5).
Touchscreen devices.

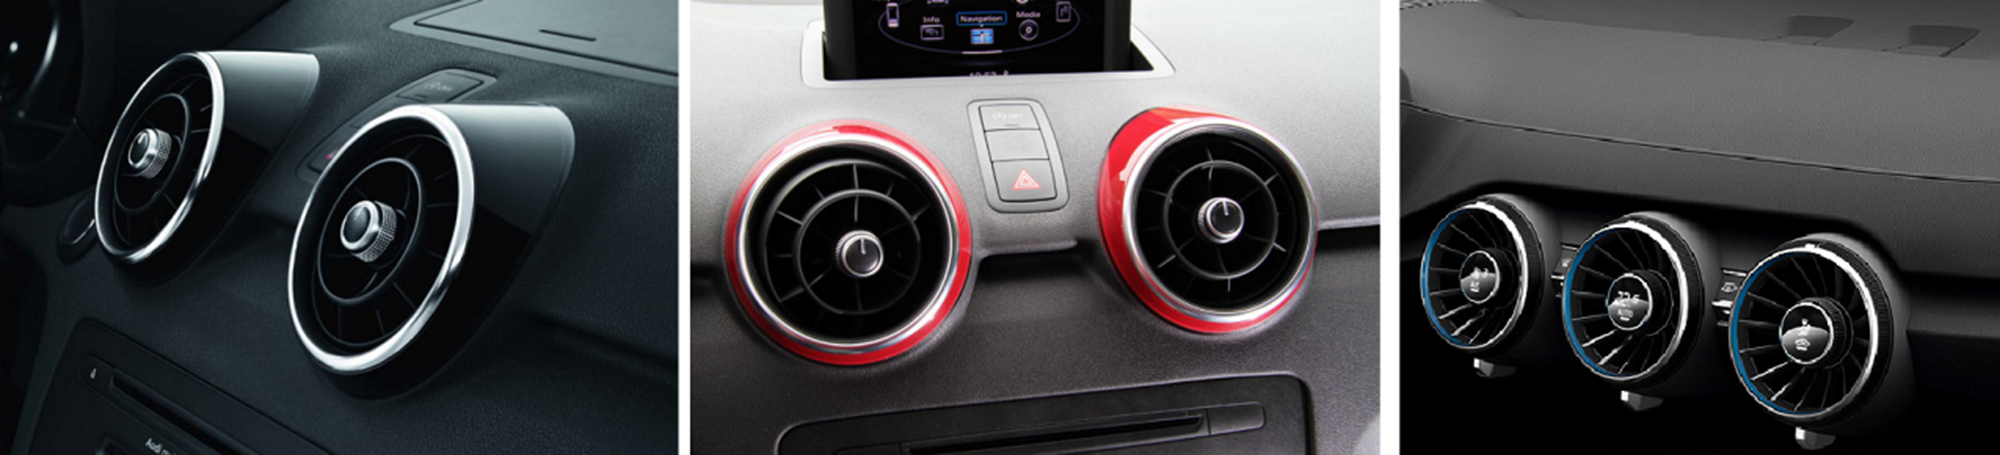
X11 air vent color and its category silver frame + silver fan blades exerted the largest influence on the perceptions of fashionable because the participants regarded silver frames and silver fan blades as more trendy than black frames, and these features were considered more capable of highlighting the vehicle's interior design. Silver frames and silver fan blades are mostly installed in the interior spaces of racing vehicles. The participants indicated that fan blades in glossy metallic colors create a fashionable look for vehicle interior design (Fig. 6).
Silver frames and silver fan blades.

X5 center console and door panel material and its category plastic material + imitation teakwood exerted the largest influence on the perceptions of recreational, because the participants indicated that plastic materials incorporating imitation teakwood trims generate a natural look and impart a sense of recreation from imagined teakwood fragrance evoked from the visual teakwood imitation (Fig. 7).
Plastic materials with imitation teakwood trims.

QT1 was applied to analyze the weight relationship between the participants’ perceptions of the selected eight Kansei keywords and the interior design elements. Table 7 displays the categories that received the highest weights under the aforementioned keywords, indicating the interior design elements that exerted the largest influence on participants’ perceptions.
Category weights

L, Luxurious; I, Interesting; F, Fashionable; Vi, Vigorous; R, Recreational, D, Dynamic; P, Precise; T, Technological.
Perceived value evaluation
Experiment 2 was conducted by inviting 60 participants with car-purchasing experience for a perceived value evaluation of the eight Kansei keywords. To assess reliability, the Cronbach's alpha was calculated and found to be 0.838, 0.87, 0.836, and 0.82 for the price, emotion, quality, and society dimensions, respectively, indicating the high reliability of all variables investigated in this study.
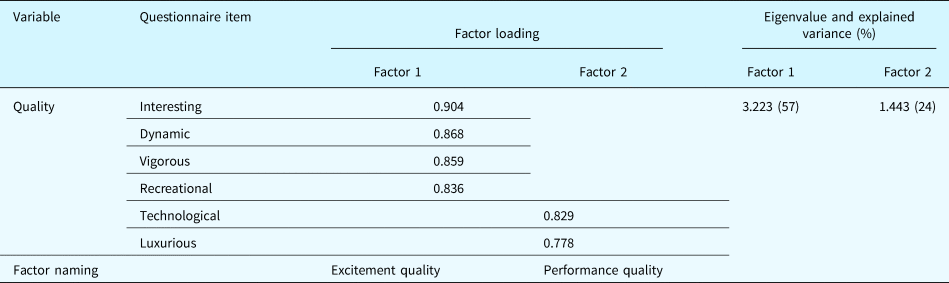
Factor analysis was conducted to extract the influencing factors based on these four CPV dimensions. As shown in Table 8, for the quality dimension, two primary factors were extracted that explained 57% and 24% of the variance (i.e., 81% in total). Four items (interesting, dynamic, recreational, and vigorous) constituted Factor 1, and two items (technological and luxurious) constituted Factor 2. According to the attributes of the items associated with the quality dimension, these two factors were named Excitement Quality and Performance Quality. The remaining two items, fashionable and precise, were excluded because they did not reach the minimum factor loading.
Exploratory factor analysis for the Quality dimension

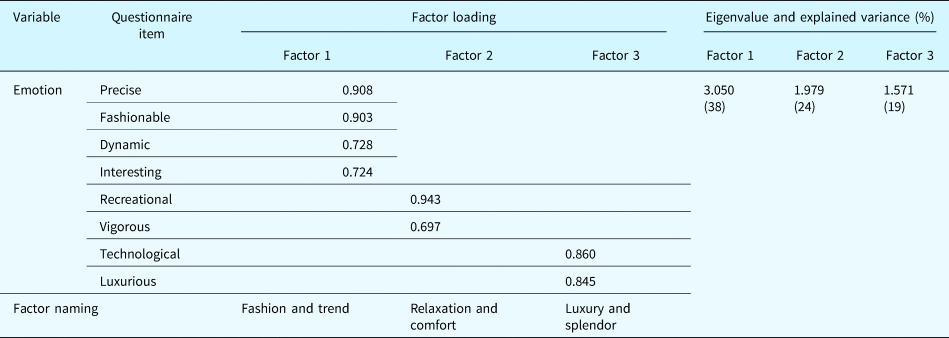
As shown in Table 9, for the emotion dimension, three primary factors were extracted that explained 38%, 24%, and 19% of the variance (i.e., 81% in total). Four items (precise, fashionable, dynamic, and interesting) constituted Factor 1, two items (recreational and vigorous) constituted Factor 2, and two items (technological and luxurious) constituted Factor 3. These three factors were named Fashion and Trend, Relaxation and Comfort, and Luxury and Splendor.
Exploratory factor analysis for the Emotion dimension

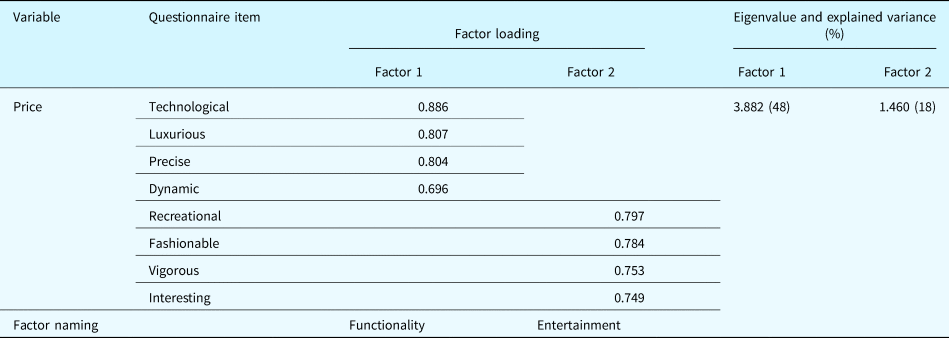
As shown in Table 10, for the price dimension, two primary factors were extracted that explained 48% and 18% of the variance (i.e., 66% in total). Four items (technological, luxurious, precise, and dynamic) constituted Factor 1, and four items (recreational, fashionable, vigorous, and interesting) constituted Factor 2. According to the attributes of the items associated with the price dimension, these two factors were named Functionality and Entertainment.
Exploratory factor analysis for the price dimension

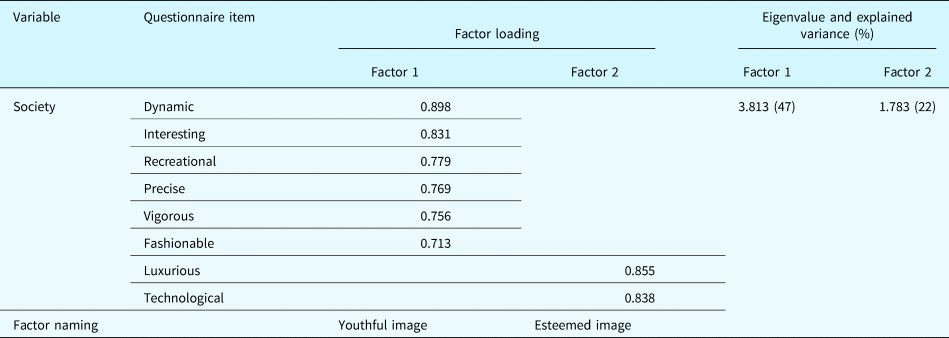
As shown in Table 11, for the society dimension, two primary factors were extracted that explained 47% and 22% of the variance (i.e., 69% in total). Six items (dynamic, interesting, recreational, precise, vigorous, and fashionable) constituted Factor 1, and two items (technological and luxurious) constituted Factor 2. According to the attributes of the items associated with the society dimension, these two factors were named Youthful Image and Esteemed Image.
Exploratory factor analysis for the Society dimension

Nine factors were extracted after a comprehensive analysis of the results of Experiment 2 (perceived value evaluation) and the questionnaire scores obtained through factor analysis. Two factors were obtained under the quality dimension: Excitement Quality and Performance Quality; three were obtained under the emotion dimension: Fashion and Trend, Relaxation and Comfort, and Luxury and Splendor; two were obtained under the price dimension: Functionality and Entertainment; and two were obtained under the society dimension: Youthful Image and Esteemed Image. Among the selected Kansei keywords, technological and luxurious shared the same four factors (i.e., Performance Quality, Luxury and Splendor, Functionality, and Esteemed Image), implying that the participants not only perceived vehicle interior design as technological and luxurious but also evaluated it as equipment that provides adequate functionality and performance and exudes a sense of novelty and splendor. In addition, vigorous and recreational shared the same four factors (i.e., Excitement Quality, Relaxation and Comfort, Entertainment, and Young Image), implying that the participants not only perceived vehicle interior design as vigorous and recreational but also evaluated it as entertainment equipment that functions as decorations with a sense of liveliness and youthfulness.
Integrated analysis of the experiments
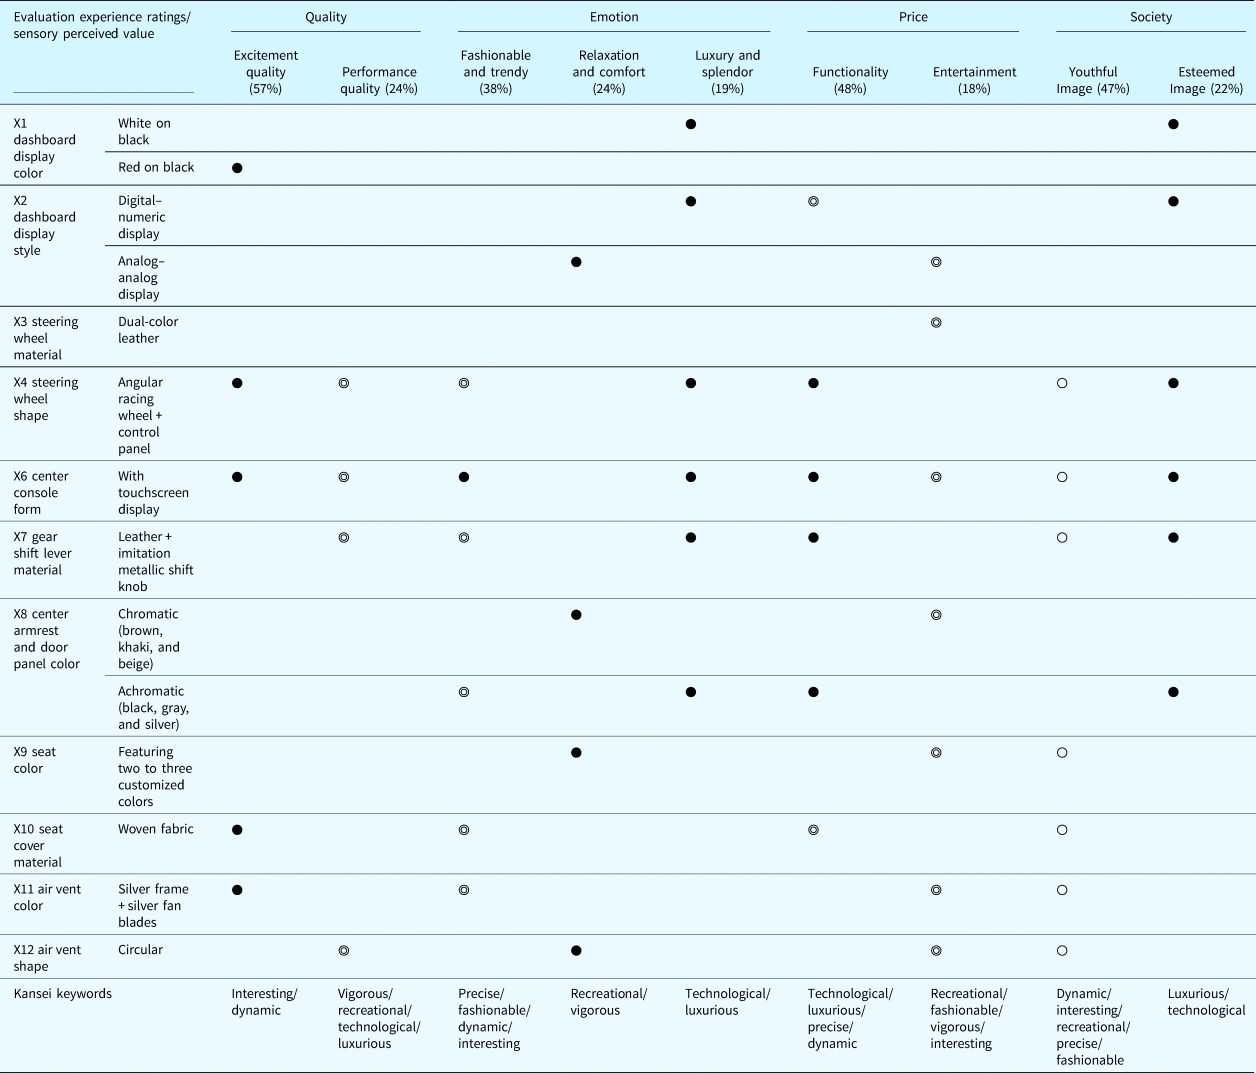
This study integrated the sensory experience results with the perceived value evaluation by matching 12 design items in the sensory experience experiment (Table 7) with nine factors extracted from the perceived value experiment (Table 12). As shown in Table 12, five items in the left column corresponded to the Excitement Quality factor, namely the red on black (colors of dashboard display), angular racing wheel + control panel (steering wheel shape), touchscreen display (center console form), woven fabric (seat cover material), and silver frame + silver fan blades (air vent color). The aforementioned items were perceived as interesting and dynamic. The symbol ● means that the indicated design item simultaneously fulfilled two perceptions (100%) with high correlations. Four items corresponded to the Relaxation and Comfort factor that was linked with the perceptions of recreational and vigorous, and six items matched the Luxury and Splendor factor and Esteemed Image factor that was associated with the perceptions of technological and luxurious.
Correlations among the experimental results

●, 100% match of the item with the Kansei combination; ◎, 75% match of the item with the Kansei combination; ○, 66% match of the item with the Kansei combination.
Additionally, four items in the left column corresponded to the Performance Quality factor, which triggered the perceptions of vigorous, recreational, technological, and luxurious. However, each item only satisfied three out of the four perceptions. Therefore, the symbol ◎ was used to indicate a lower matching level (75%). Regarding the Youthful Image factor, seven items were related to perceptions of dynamic, interesting, recreational, precise, vigorous, and fashionable. However, each of these seven items only satisfied four out of the said perceptions (66%), yielding the lowest matching level (Table 12).
According to the results of the two experiments, the researchers could determine the correlations in user perceptions. Furthermore, these results exhibited that design items had various levels of influence on sensory experience and perceived value, thereby indicating the perceptions of automotive interior design among the public. The associated factors can also be used to help understand the mental expectations of consumers with respect to the design of desired products.
Conclusion and suggestions
By conducting two experiments based on Kansei engineering, this study confirmed the factors that affect user perceptions of automotive interior design. Moreover, the correlations among those perceptions were determined through critical analysis.
The result of Experiment 1 (sensory experience) suggested that the perceptions of luxurious, interesting, vigorous, dynamic, precise, and technological were mostly affected by the center console form, and that its category with touchscreen display received the highest weight, indicating that in addition to perceiving the vehicle interior as luxurious, technological, dynamic, and interesting, the participants considered high-tech electronic information devices and real-time interactivity as the most influential factors. An automobile is highly similar to a portable mobile device. When waiting or resting in an automobile, passengers tend to use the information equipment of the center console for communication or online activities. A touchscreen center console aligned with the functions of mobile phones and tablets is the interior design element that most adequately meets drivers’ expectations. With respect to the perception of fashionable, air vent color had the highest partial coefficient among all items, namely the category silver frame + silver fan blades. This result indicated that the participants regarded the design of silver with streamlined components to be fashionable. The center console and door panel material had the highest partial coefficient with respect to recreational perception, specifically the category plastic material + imitation teakwood. This result suggested that natural materials created the perception of a recreational atmosphere for users and the combination of various materials was the deciding factor.
The results of Experiment 2 (perceived value evaluation) indicated that nine factors under the four CPV dimensions affected the selected Kansei perceptions. A comparison of Table 7 (category weights) with Tables 8–11 (exploratory factor analysis of the four CPV dimensions) indicated that technological and luxurious shared the same four factors (i.e., Performance Quality, Luxury and Splendor, Functionality, and Esteemed Image) and corresponded to the same six interior design elements (i.e., white on black under X1 dashboard display color, digital–numeric display under X2 dashboard display style, angular racing wheel + control panel under X4 steering wheel shape, with touchscreen display under X6 center console form, leather + imitation metallic shift lever knob under X7 gear shift lever material, and achromatic [black, gray, and silver] under X8 center armrest and door panel color). This finding suggested that innovative operating equipment (e.g., the real-time user interface of a steering wheel and center console) in achromatic metallic colors most effectively demonstrates the luxury and technological features of a vehicle interior design and that a vehicle interior design featuring a touchscreen operating interface that can be connected to personal mobile devices offers maximum functionality. Moreover, vigorous and recreational shared the same four factors (i.e., Excitement Quality, Relaxation and Comfort, Entertainment, and Youthful Image) and corresponded to the same four interior design elements (analog–analog display under X2 dashboard display style, chromatic [brown, khaki, and beige] under X8 center armrest and door panel color, featuring two to three customized colors under X9 seat color, and circular under X12 air vent shape). This finding suggested that stress-reducing and entertaining operating components, a colorful interior design, customized colors showing individuality, and circular or round-shaped components provide stress relief to users and overall present a youthful and esteemed image.
To integrate the findings concerning sensory experience with those of perceived value evaluation, this study determined the correlations between the 12 items in Experiment 1 and nine factors in Experiment 2. The results indicated that five design factors affected the perceptions of interesting and dynamic under the factor of Excitement Quality, four items jointly affected vigorous and recreational under the factor of Relaxation and Comfort, and the perceptions of technological and luxurious were simultaneously affected by six consistent design items under the factors of Luxury and Splendor and Esteemed Image. The experimental results confirmed the decisive design elements that affect user perceptions. Specifically, the perceptions of interesting and dynamic were linked to steering wheels and center consoles with easy-to-operate designs, silver air vents, red-on-black dashboards, and fabric seat covers; vigorous and recreational were associated with customized and colorful interior displays, streamlined structure, and digital–analog dashboards. The participants perceived an easy-to-operate steering wheel, a center console with touchscreen display, and monochromatic interior displays made of metals and leather as representative of technological and luxurious designs.
This study assessed automobiles that were currently available on the market with respect to Kansei (emotional) factors and their influence on the participants. One of the limitations of this study was that all selected models were those currently available on the market and all the levels of the selected models had various design levels from the participants’ perspective. Additionally, only cars with designs accepted by consumers rather than future designs were considered in this study. Further research on future vehicles using smart technology should also be done, and the findings of such a study could serve as a reference for automotive interior design in the future. Furthermore, this study only selected 27 automotive models because the two experiments required a long time for the participants to rate multiple interior designs. Thus, virtual reality could be adopted in future studies to save more time for experiments.
This study established a model that incorporated factors that affected the sensory experience and those that affected users’ perceptions of value. The findings can serve as a reference for automotive interior designers and as a basis for studying automotive exterior design, equipment design, and service design. The results of this study and future studies can be used to better satisfy the emotional expectations and requirements of automobile drivers.
Ching-Chien Liang is a PhD Candidate in the Department of Industrial Design, National Cheng Kung University. He holds a Bachelor of Fine Arts and a Master of Design in which he explored Emotional Design. His research interests include Kansei Engineering and Emotional Design Research. His current research focuses on the automotive systems engineering design and product development, in particular, the Kansei Engineering for products.
Ya-Hsueh Lee received her PhD (2014) degrees in Industrial Design from National Cheng Kung University (NCKU). Her interests include visual communication design, graphic design, printing design, package design, and Kansei engineering research. Nowadays, she focuses on the cognition and communication, the quantitative describing method for design elements, and the tactile Kansei research for product material surface.
Chun-Heng Ho is an Associate Professor in the Department of Industrial Design at the National Cheng Kung University, Taiwan. He received his PhD degree from the College of Design at the Georgia Institute of Technology in the United States. His research interests include Design Cognition and Kansei Engineering. Currently, he also serves as an Executive Director of the Taiwan Institute of Kansei, and the Editor-in-Chief of the Journal of Kansei (ISSN 2409-6326). You may visit his website at http://myweb.ncku.edu.tw/~hochor or contact him by email at hoch@mail.ncku.edu.tw.
Kuo-Hsiang Chen is the Dean of School of Art and Design at the Fuzhou University of International Studies and Trade, China. He received both of his PhD and MS degrees from the Institute of Design, IIT. Before taking the deanship, he has served as Dean for the College of Communication and Design at I-Shou University, Taiwan and taught Industrial Design at National Cheng Kung University for 25 years. His principal research interests cover: form languages, style cognition, interface design, and Kansei engineering. Dr Chen currently serves as a section editor for the Journal of Design and the International Journal of Design. He has publications in areas of form and style languages, computer-supported formal design, influential factors in interface design, and Kansei engineering.