I. INTRODUCTION
Near-equiatomic NiTi shape memory alloys have been used in a wide range of applications in medicine, engineering, and consumer goods owing to their unique capabilities to recover large deformation strains and to perform mechanical works. In many of these applications, shape memory alloys are actuated by temperature variations. In this regard, actuation temperature window and hysteresis are important design parameters, for example, for proportional control and as shape memory actuators.Reference Chakraborty, Tang, Bame and Tang1–Reference Botterill and Grant4
It has been established in the literature that transformation intervals of thermoelastic martensitic transformations are caused by the continuous storage of elastic strain energies.Reference Ortin and Planes5–Reference Wayman and Tong9 Thus, determination of the values of the intervals is important for understanding the micromechanisms of these transformations, for determining the thermodynamic parameters of these transformations, and for mechanics modeling using these parameters. Transformation thermal parameters reported in the literature are usually determined by thermal analyses, for example, differential scanning calorimetry (DSC),Reference Ortin and Planes5, Reference Liu and McCormick10 thermomechanical analysis,Reference Uchil, Mohanchandra, Ganesh Kumara, Mahesh and Murali11 and electrical resistance measurement.Reference Kakeshita, Takeguchi, Fukuda and Saburi12–Reference Otsuka, Ren and Takeda14 It is common knowledge that DSC measurement is subjected to kinetic influences of the measurement process; thus, validity of transformation interval values determined under finite heating and cooling rates needs to be verified. This study conducts experiments specifically designed to determine the true values of temperature intervals of two thermoelastic martensitic transformations in three alloys.
In addition, there are also long-standing debates on whether a martensitic transformation is athermal,Reference Otsuka, Ren and Takeda14–Reference Müller, Klemradt and Finlayson16 where the transformation occurs over a temperature interval, or isothermal,Reference Planes, Pérez-Reche, Vives and Mañosa17–Reference Kustov, Salas, Santamarta, Cesari and Humbeeck21 where the transformation proceeds with time at a given temperature. The experiments reported in this study also help elucidate the time/temperature dependence of the transformations concerned.
II. EXPERIMENTAL PROCEDURES
Two commercial near-equiatomic NiTi alloys were used in this study, one with a nominal composition of Ti-50.2 at.% Ni and the other with Ti-50.8 at.% Ni. Both alloys were supplied in wire form of 1 mm in diameter. The wires were cold rolled and then cut into 4-mm-long small pieces before heat treatment under argon protection. The Ti-50.2 at.% Ni alloy was annealed at 923 K. The Ti-50.8 at.% Ni was solution-treated at 1123 K followed by water quenching. These two alloys exhibit B2↔B19′ martensitic transformations. Ni43Co7Mn39In11 alloy was also used in this study. The alloy was prepared by arc melting in water-cooled copper crucible. The button-shaped ingot was precut into small pieces with a low-speed diamond cutoff wheel and then annealed at 1273 K for composition homogenization. This alloy is a typical intermetallic compound and exhibits a L21↔orthorhombic martensitic transformation.
Transformation behavior of the samples was characterized by means of DSC analysis using a TA Instrument Q10 DSC (TA Instruments, New Castle, DE) in flowing N2. Two different techniques were used, including continuous heating/cooling and interrupted heating/cooling measurements. For the continuous measurement, two different heating/cooling rates of 0.5 and 10 K/min were used. The interrupted measurements were conducted at a heating/cooling rate of 10 K/min. For these measurements, the cooling or heating process was interrupted at different stages amidst the transformation temperature range with a thermal arrest for 60 s, followed by continuation of the cooling or heating process.
III. RESULTS
A. Interrupted DSC measurement of martensitic transformations
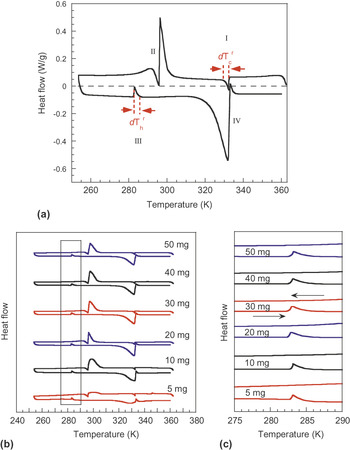
This study relies on abrupt thermal arrest amidst a martensitic transformation and continuation of the measurement after the arrest. The TA Q10 DSC instrument used (in general all DSC instruments) is not designed to conduct interrupted analysis because of the intrinsic instrument and sample thermal inertias. To evaluate the influence of thermal inertia, interrupted DSC measurements were conducted amidst and outside the transformation temperature range. Figure 1(a) shows such a measurement for a Ti-50.2 at.% Ni sample. The heating and cooling rate used was 10 K/min. Thermal arrest I was on cooling in austenite state, thermal arrest II was within the temperature interval of the B2→B19′ transformation, thermal arrest III was on heating in the martensitic state, and thermal arrest IV was in the middle of the reverse B19’→B2 transformation. It is seen that upon thermal arrest, the heat flow dropped from the measurement baseline to neutral. Upon restart, at 10 K/min, the recovery “time,”  and
 , of the heat flow from thermal arrest to the baseline level was ∼2 K in both the austenitic state on cooling and the martensitic state on heating, when there was no transformation involved. It is known that the separation of the base lines is due to thermal mass inequity between the sample and the reference, and the recovery “time” is directly related to the magnitude of the baseline separation, sample mass (sample thermal inertia), and heating/cooling rate (instrument thermal inertia). In this regard, in the following experiments, care has been taken to minimize the baseline separation by adjusting the reference mass in addition to using samples of small masses.
Interrupted differential scanning calorimetry measurements of the transformation behavior of Ti-50.2 at.% Ni at 10 K/min with (a) thermal mass of 20 mg, (b) samples of different thermal masses ranging from 5 to 50 mg, and (c) enlarged view of part of curves shown in (b).

Figure 1(b) shows the influence of sample mass on the interrupted DSC measurement of the transformation. Part of Fig. 1(b), contained in the dashed line frame, is enlarged and shown in Fig. 1(c) for better comparison. It is evident that, for the experimental conditions used, thermal mass in the range of 5–50 mg does not cause variation to thermal arrest recovery time.
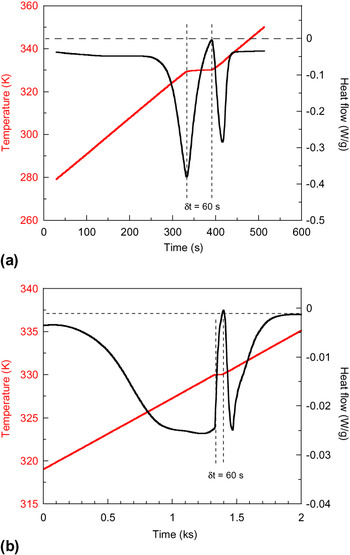
Figure 2 shows temperature and heat flow evolution curves with time during interrupted DSC measurements at two different heating rates of 10 [Fig. 2(a)] and 0.5 K/min [Fig. 2(b)]. The DSC curves show the reverse B19′→B2 transformation on heating, with a thermal arrest within the transformation range. In both cases, the arrest duration was 60 s. It is seen that in both cases, the temperature was stable during the thermal arrest and that the heat flow decreased to neutral within 60 s. It is also evident that during isothermal arrest, the endothermic heat flow continued, implying continuation of the B19’→B2 phase transformation process.
Evolutions of temperature and heat flow with time during differential scanning calorimetry measurement with thermal arrest at 300 K at (a) 10 K/min and (b) 0.5 K/min.

These experimental evidences presented above demonstrate the validity of the thermal arrest experiments, with the influences of instrument inertia and sample mass being negligible for the intended measurements.
B. Ti-50.2 at.% Ni alloy
1. Transformation behavior in continuous DSC measurement
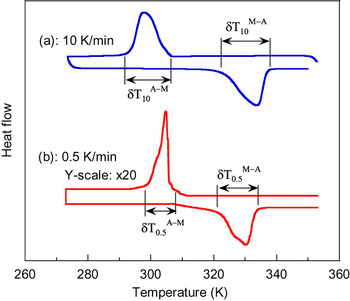
Figure 3 shows the transformation behavior of the Ti-50.2 at.% Ni alloy annealed at 923 K. Curve (a) was measured at a cooling/heating rate of 10 K/min and curve (b) was measured at 0.5 K/min. The y-scale of curve (b) has been enlarged by 20 times to reveal the transformation peaks for easy comparison. The alloy exhibits a single-stage B2↔B19’ martensitic transformation, with a thermal hysteresis of η 10 = 32 K at 10 K/min and η 0.5 = 27 K at 0.5 K/min, as determined at the maximum heat flow of the transformations. The latent heat of the transformation was determined to be  J/g and
 J/g at 0.5 K/min and
 J/g and
 J/g at 10 K/min. In average, the latent heat measured at 0.5 K/min is 24% smaller than that measured at 10 K/min. As reported earlier, the latent heats measured at 10 K/min are regarded a more reliable estimate of the true value, and the lower values determined at 0.5 K/min are attributed to the sensitivity limitations of the instrument used.Reference Meng, Yang, Liu and Nam22
Continuous differential scanning calorimetry measurements of the transformation behavior for Ti-50.2 at.% Ni at 10 and 0.5 K/min.

The starting temperatures for the forward and reverse transformations are approximately the same for the two different heating/cooling rates, with  K and
 K and
 K and
 K. However, the finishing temperatures of the transformations differ significantly between the two measurements, with
 K and
 K and
 K and
 K. The difference between the starting and the finishing temperatures is the temperature interval of the transformations. The temperature intervals determined at 10 and 0.5 K/min are
 K,
 K,
 K, and
 K. The transformation intervals are significantly smaller at 0.5 K/min than at 10 K/min. The smaller values determined at 0.5 K/min are obviously the more reliable measure of the true transformation intervals.Reference Meng, Yang, Liu and Nam22
2. Interrupted DSC analysis at 10 K/min
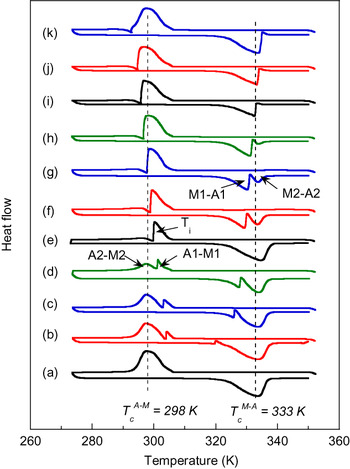
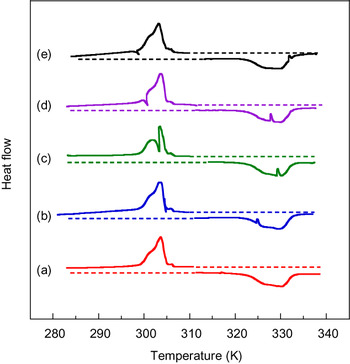
Figure 4 shows interrupted DSC measurements with thermal arrests during the forward or the reverse transformations. The cooling/heating rate was 10 K/min for all the measurements. Curve (a) shows the full continuous transformation cycle without interruption. The thermal arrest divided a transformation peak into two stages, denoted A1-M1 and A2-M2 for the forward transformation and M1-A1 and M2-A2 for the reverse transformation. It is seen that the thermal peak size of A1-M1 increased progressively at the expense of that of A2-M2 with increasing interruption temperature. For the forward transformation on cooling, thermal arrest at 298 K caused the total disappearance of A2-M2, as evident in curve (g), even though the thermal arrest temperature is still within the transformation interval with respect to the uninterrupted full transformation cycle shown in curve (a). This temperature is recorded as the critical termination temperature for the forward transformation,  . Similarly, for the reverse transformation, thermal arrest at 333 K caused the total disappearance of M2-A2, as evident in curve (i). This temperature is denoted the critical termination temperature for the reverse transformation,
 .
Interrupted differential scanning calorimetry measurements of the transformation behavior of Ti-50.2 at.% Ni at 10 K/min.

The exothermic/endothermic heats of the A1-M1, A2-M2, M1-A1, and M2-A2 transformations, denoted ΔH A1-M1, ΔH A2-M2, ΔH M1-A1, and ΔH M2-A2, respectively, are shown in Fig. 5 as functions of the thermal arrest temperature Ti. The dashed horizontal lines indicate the latent heats of the transformations measured from the continuous DSC transformation cycle at 10 K/min,  and
 . Both exothermic and endothermic heats are expressed as positive values in the figure. Also shown in the figure are the total heat for the forward and the reverse transformations, defined as
 and
 , respectively.
Absolute values of latent heat determined by interrupted measurement at different stages during the B2↔B19′ martensitic transformation at cooling/heating rate of 10 K/min: (a) forward transformation and (b) reverse transformation.

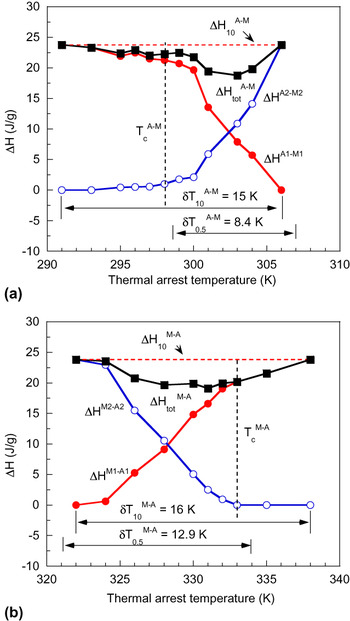
For the interrupted forward transformation, as shown in (a), ΔH A1-M1 increases and ΔH A2-M2 decreases with decreasing thermal arrest temperature. The summation of the two,  , falls below the latent heat of the uninterrupted transformation cycle,
 , with a minimum amid the transformation temperature range. This deficit of latent heat,
 , indicates a loss of the latent heat measurement, or transformation volume captured, during the interrupted forward transformation. The maximum value of the heat loss is 5 J/g, corresponding to 21% of
 . The critical termination temperature identified in Fig. 4,
 K, is also indicated in the figure. Below
 , ΔH A2-M2 is practically zero.
The reverse transformation showed similar behavior, as shown in (b). ΔH M1-A1 increases at the expense of ΔH M2-A2 as the thermal arrest temperature increases.  remains below
 , with a maximum deficit of 4.7 J/g, corresponding to 20% of
 . The critical temperature identified in Fig. 4,
 K, is also indicated in the figure. Above
 , ΔH M2-A2 is zero.
It is interesting to note that  and
 determined from the interrupted DSC measurements equal the finishing temperatures of the forward and reverse transformations determined at 0.5 K/min cooling and heating rate, that is,
 and
 , respectively.
3. Interrupted DSC analysis at 0.5 K/min
Figure 6 shows the interrupted DSC measurement of the transformation behavior of Ti-50.2 at.% Ni at a cooling/heating rate of 0.5 K/min. Because of the excessive time required, measurements were taken only at the vicinity of the transformation. Curve (a) is an uninterrupted transformation cycle. It shows small transformation temperature intervals of  K and
 K. For the reverse transformations, thermal arrests made little change to the overall profile and size of the thermal flux peak. This is obviously related to the lower maximum heat flux intensity of the reverse transformation peaks relative to that of the forward transformation peaks.
Interrupted differential scanning calorimetry measurements of the transformation behavior of Ti-50.2 at.% Ni at 0.5 K/min.

Figure 7 shows measurements of the transformation latent heats as functions of the thermal arrest temperature, with (a) showing ΔH A1-M1, ΔH A2-M2, and  for the forward transformation and (b) showing ΔH M1-A1, ΔH M2-A2, and
 for the reverse transformation. These parameters show similar trend as those described in Fig. 3. However, it is evident that the heat losses between
 and
 and between
 and
 are negligible.
Absolute values of latent heat determined by interrupted measurement at different stages during the B2↔B19′ martensitic transformation at cooling/heating rate of 0.5 K/min: (a) forward transformation and (b) reverse transformation.

C. Ti-50.8 at.% Ni alloy
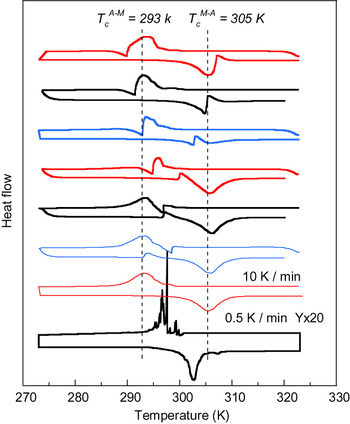
Figure 8 shows the transformation behavior of a Ti-50.8 at.% Ni alloy as measured at 10 K/min. The samples were solution treated at 1153 K for 1.8 ks. Also shown in the figure is a measurement conducted at 0.5 K/min for comparison. The y-scale of the curve measured at 0.5 K/min is enlarged 20 times for easy viewing. The alloy exhibited a single-stage B2→B19′ transformation, similar to the Ti-50.2 at.% Ni alloy but at lower temperatures and with smaller latent heats. The transformation temperatures, as determined from the DSC curve measured at 0.5 K/min, are  K,
 K,
 K, and
 K. The latent heats of the transformations, as determined from the DSC curve measured at 10 K/min, are 10.1 J/g for the forward transformation and 12.6 J/g for the reverse transformation. The two critical termination temperatures are determined to be
 K and
 K.
Interrupted differential scanning calorimetry measurements of the transformation behavior of Ti-50.8 at.% Ni.

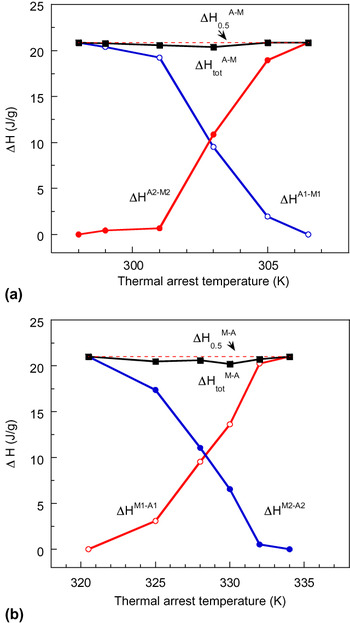
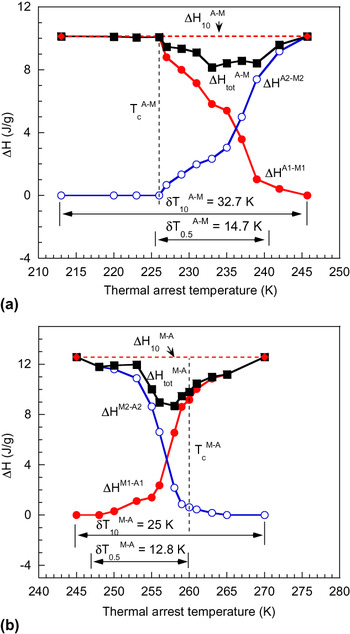
Figure 9 shows the evolution of transformation latent heats as functions of the thermal arrest temperature, with (a) showing the forward B2→B19′ transformation and (b) showing the reverse B19′→B2 transformation. All the thermal parameters show similar trend as those described in Fig. 5, with ΔH A1-M1 increasing at the expense of ΔH A2-M2 as the thermal arrest temperature decreases for the forward transformation and ΔH M1-A1 increasing at the expense of ΔH M2-A2 as the thermal arrest temperature increases for the reverse transformation. Also,  remains below
 and
 remains below
 . The maximum relative heat loss for the interrupted forward transformation is 21% (2.2 J/g) and that for the interrupted reverse transformation is 30% (3.8 J/g).
Absolute values of latent heat determined by interrupted measurement at different stages during the B2↔B19′ martensitic transformation in Ti-50.8 at.% Ni at cooling/heating rate of 10 K/min: (a) forward transformation and (b) reverse transformation.

D. Ni43Co7Mn39In11
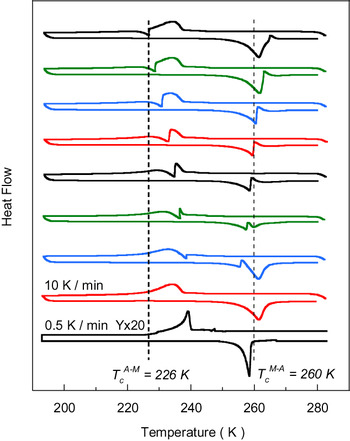
Figure 10 shows similar DSC measurements of the martensitic transformation behavior of a Ni43Co7Mn39In11 alloy. The y-scale of the transformation curve measured at 0.5 K/min has been enlarged by 20 times for easy comparison with the rest. The alloy exhibited a single stage L21↔orthorhombic transformation. The transformation temperatures determined at 0.5 K/min are  K,
 K,
 K, and
 K. The latent heats of the transformations, as determined at 10 K/min, are 5.2 J/g for the forward and 5.9 J/g for the reverse transformations. The two critical termination temperatures are determined to be
 K and
 K.
Interrupted differential scanning calorimetry measurements of the transformation behavior of Ni43Co7Mn39In11.

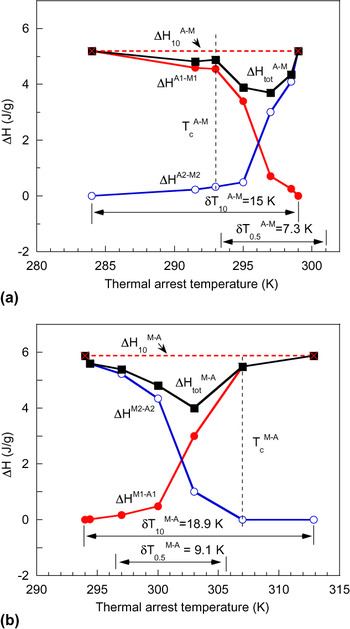
Figure 11 shows the evolution of transformation latent heats as functions of the thermal arrest temperature, with (a) showing the forward L21→orthorhombic transformation and (b) showing the reverse orthorhombic→L21 transformation. The maximum relative heat loss for the interrupted forward transformation is 29% (1.5 J/g) and that for the interrupted reverse transformation is 35% (2.1 J/g).
Absolute values of latent heat determined by interrupted measurement at different stages during the L21↔orthorhombic martensitic transformation in Ni43Co7Mn39In11 at cooling/heating rate of 10 K/min: (a) forward transformation and (b) reverse transformation.

IV. DISCUSSION
A. Transformation temperature intervals and elastic energy
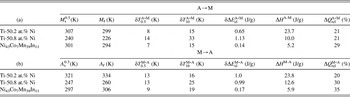
Behavior of thermoelastic martensitic transformations in shape memory alloys has been commonly characterized by means of DSC. It has been established in a previous study that transformation intervals are more reliably determined at very low heating/cooling rate (e.g., 0.5 K/min), whereas transformation latent heat is more reliably determined at above 5 K/min.Reference Meng, Yang, Liu and Nam22 Under these conditions, the latent heats and transformation intervals of the B2↔B19′ martensitic transformation in two near-equiatomic NiTi alloys and the L21↔orthorhombic transformation in the Ni43Co7Mn39In11 are determined. The results are summarized in Table I. In the table, M s, M f, A s, A f, and δT 0.5 are based on measurements made at 0.5 K/min, whereas δT 10 and ΔH are based on measurements conducted at 10 K/min.  and
 denote the maximum relative heat lost during the interrupted DSC measurement at 10 K/min, for the forward and reverse phase transformations, respectively.
Transformation characteristic parameters of three shape memory alloys during (a) forward transformation and (b) reverse transformation.

Values of transformation intervals obtained from the interrupted DSC measurement are essentially the same as those obtained from the continuous DSC measurement at 0.5 K/min. These values are significantly smaller than those determined at 10 K/min; for example,  is 53%, 42%, and 47% of
 for the Ti-50.2 at.% Ni, Ti-50.8 at.% Ni, and the Ni43Co7Mn39In11 alloys, respectively. It is evident in the experimental results presented that the starting temperatures of the transformations (i.e., M s and A s) are not affected by the cooling and heating rate, but the finishing temperatures (i.e., M f and A f) are significantly delayed by higher cooling and heating rates. Retardation of the finishing temperatures is caused by the kinetics of thermal conduction of the sample as well as the instrument. By using the interrupted DSC measurement and the slow cooling/heating measurement methods, the true finishing temperatures of the B2↔B19′ transformations are determined to be
 K and
 K for the Ti-50.2 at.% Ni alloy,
 K and
 K for the Ti-50.8 at.% Ni alloy, and
 K and
 K for the Ni43Co7Mn39In11 alloy.
It is well established that the occurrence of transformation interval is due to the continued increase in thermodynamics resistance to the transformation during the transformation process, thus the thermoelasticity.Reference Roitburd and Kurdjumov23 For thermoelastic martensitic transformations in shape memory alloys, this increase in thermodynamic resistance is due to the increases in internal elastic strain energy caused by the lattice distortion of the martensite.Reference Ortin and Planes5–Reference Wayman and Tong9, Reference Wollants, Roos and Delaey24 With this understanding, transformation intervals have been used to estimate the change in elastic strain energy during the process of the transformation.Reference Salzbrenner and Cohen25 With the transformation interval values determined, elastic strain energy changes of the transformations in the two alloys may be estimated.
The specific elastic strain energy created over an infinitesimal step of transformation at a random stage corresponding to martensite volume fraction f m may be expressed as ΔE el(f m) = (T(f m) − M s)ΔS; thus, the difference between (or the change of) the specific elastic energy stored at the end of transformation (T(f m) = M f) and at the start of the transformation (T(f m) = M s) is δΔE el = δTΔS. Using ΔS NiTi = 0.074 J/gKReference Liu and McCormick10, Reference Liu and McCormick26, Reference McCormick and Liu27 and ΔS NiCoMnIn = 0.019 J/gK,Reference Ito, Imano, Kainuma, Sutou, Oikawa and Ishida28 as estimated using the data shown in Table I, δΔE el values for the forward and the reverse transformations are determined as summarized in Table I.
B. Isothermal and athermal martensitic transformation
Given the diffusionless nature, martensitic transformations are generally considered to proceed in an explosive manner in the form of propagation of mechanical waves within the lattice, or in other words, the speed of sound in the matrix.Reference Krumhansl29 This implies that the transformation process is time independent and has nil temperature interval. With the introduction of accumulation of stored elastic strain energy (more precisely the variation of specific stored elastic strain energy ΔE el(f m) during the process of the transformation), the transformation becomes temperature dependent over an interval, that is, thermoelastic.Reference Roitburd and Kurdjumov23 In such transformation, amount of the product phase formed is dependent only on temperature, and not time. This is intrinsically determined by the diffusionless nature of the transformations, where a time-dependent, probability-controlled process is absent. Such transformations are typically referred to as athermal transformations in the literature.Reference Cao, Krumhansl and Gooding30, Reference Vives, Ortín, Mañosa, Ràfols, Pérez-Magrané and Planes31
There are, however, debates in the literature of the occurrence of martensitic transformations in another manner, that is, isothermally with time.Reference Kakeshita, Takeguchi, Fukuda and Saburi12, Reference Kozuma, Murakami, Kawano and Otsuka13, Reference Kakeshita, Kuroiwa, Shimizu, Ikeda, Yamagishi and Date18, Reference Sordelet, Besser, Ott, Zimmerman, Porter and Gleeson32, Reference Wakasa and Wayman33 Kakeshita et al. first proposed a mechanism based on probability of nucleation of the martensite due to energy fluctuation, thus the incubation time required for the transformation, for the Fe–Ni–Mn system.Reference Kakeshita, Kuroiwa, Shimizu, Ikeda, Yamagishi and Date18 They further suggested that all martensitic transformations can be regarded time-dependent isothermal processes, with the more conventional martensitic transformations being “athermal” only because of their extremely short incubation times. Otsuka et al. disputed that notion and demonstrated in NiTi that no martensite is formed at temperatures just above the M s temperature over prolonged periodsReference Otsuka, Ren and Takeda14 and concluded that martensitic transformations may proceed in a totally athermal manner and may proceed even when atomic diffusion is totally suppressed. Planes et al.Reference Planes, Pérez-Reche, Vives and Mañosa17 later conducted a careful experiment by monitoring acoustic emission of the sample during thermal arrest in the midst of the martensitic transformation and compared the behaviors of CuAlNi and CuZnAl systems. They proposed a unified theory based on the relative time scales of energy fluctuation, rate of driving force production, and rate of system relaxation, from a theoretical perspective. The main conclusion of their analysis is that an athermal transformation, in an absolute sense, does not exist (so does not the distinction between isothermal and athermal transformations in the classical concept), and all martensitic transformations obey the same set of laws. A time effect is observed when the characteristic time for energy fluctuation, which is characteristic and specific to a particular transformation system, is comparable to or greater than the characteristic time scale for driving force production, which is a measure of the rate of temperature change (cooling/heating rate). In this regard, the observation of a time effect is only a matter of the rate of temperature change relative to the nature of the transformation for a given system. We agree with this concept.
What may be extended a step further in this discussion from Planes concept are the origins or nature of these time-dependent aspects. In addition to energy fluctuation, there exist some nonelastic events in the local scene during a martensitic transformation. Being a mechanical process, the transformation front interacts with existing defects in the matrix, causes dislocation movements and generates new dislocations, and experiences “frictional” resistance. Such interactions are nonelastic in nature and are time dependent. Interactions with these defects either relax the stress hindrance to the propagation of the transformation interface or block the propagation.
In this study, we conducted calorimetric measurements during thermal arrests within the temperature windows of the forward and reverse transformations for two different martensitic transformation systems. The near-equiatomic NiTi alloys represent typical ductile solid solution matrix prone to internal plastic deformation and thus are expected to be more time dependent. The NiCoMnIn alloy represents a typical intermetallic compound of brittle matrix and damages by cleavage fracture, thus expected to be less time dependent. In addition, the calorimetric measurements not only allow detection of the time effect but also provide some quantitative information of the extent of “time-induced” martensitic transformation.
It is seen in Fig. 4 that at cooling/heating rate of 10 K/min, maximum heat losses of 21% and 20% were recorded for the forward and reverse transformations, respectively, in the Ti-50.2 at.% Ni alloy. Similar values of 21% and 30% were also recorded for the Ti-50.8 at.% Ni alloy and 29% and 35% for the Ni43Co7Mn39In11 alloy. These heat losses signify the “time-induced” transformation during the thermal arrest. However, at 0.5 K/min, no obvious heat loss was recorded. The heat losses of 3.8% and 3.7% for the forward and the reverse transformations recorded are within the experimental error of the DSC heat measurement. The apparent time-dependent transformation at 10 K/min is thus clearly related to the effect of thermal equilibration to dissipate the large latent heat during thermal arrest, thus an artifact of the thermal inertia.
V. CONCLUSION
The main findings of this study may be summarized as follows:
(1) DSC measurement at the conventional 10 K/min cooling and heating rate overestimates the finishing temperatures of both the forward and the reverse transformations by retarding the completion of the processes. This leads to overestimation of the transformation temperature intervals.
(2) True values of the transformation finishing temperatures and intervals may be determined at very slow cooling and heating rate or by interrupted thermal measurement. The transformation temperature intervals are found to be 8.4 and 12.9 K for the forward and reverse B2↔B19′ martensitic transformation of the Ti-50.2 at.% Ni alloy and 14.7 and 12.8 K of the Ti-50.8 at.% Ni alloy and 7.3 and 9.1 K for the L21↔orthorhombic martensitic transformation of the Ni43Co7Mn39In11 alloy. These values are significantly smaller than those determined at cooling and heating rate of 10 K/min.
(3) An apparent time-dependent effect was observed for DSC analysis at cooling and heating rate of 10 K/min but not at 0.5 K/min. This observation is attributed to the effect of thermal equilibration to dissipate the latent heat during the continuous thermal measurement, thus an artifact. Both the B2↔B19′ martensitic transformation in near-equiatomic NiTi and the L21↔orthorhombic transformation in the Ni43Co7Mn39In11 are time-independent athermal processes within the time domain concerned in DSC measurement.
ACKNOWLEDGMENT
This work was supported by the Korea Research Foundation Grant funded by the Korean Government (MEST) (KRF-2008-220-D00061).