


1. Introduction
1.1. Aim of study and organization of this paper
The purpose of the present study was to gain detailed information on the influence of the subglacial water pressure on the velocity of a glacier. Findelengletscher was chosen for this study because a pilot study had revealed a sensitive reaction of the glacier to changes in melt-water input. In particular, some instances of a diurnal cycle of velocity had been observed (Reference IkenIken, 1978). These observations suggested that the classic concept of sliding with bed separation (Reference LliboutryLliboutry, 1968, Reference Lliboutry1979; Reference KambKamb 1970; Reference IkenIken, 1981; Reference FowlerFowler, in press) might be relevant for this glacier. The present study indirectly confirms this conjecture.
This paper is arranged as follows:
Experimental results are presented together with a discussion of the immediate implications in section 2:
-
2.2. Water-level variations.
-
2.3. Velocity records and relation to water pressure.
-
2.4. Special events in the drainage system.
-
2.5. Experiments carried out by other investigators.
Observational facts are compared with theoretical predictions in section 3:
-
3.1. The relation between subglacial water pressure and sliding velocity.
-
3.2. The water pressure in subglacial conduits.
The probable situation of the drainage system of Findelengletscher in spring is described in section 4. Section 5 is a summary of results.
1.2. Description of the glacier
Findelengletscher is a temperate valley glacier; the valley section is 3 km long and 500–1000 m wide. It descends in several steps; the mean slope, taken over 2 km around the study area, is 6.5°. On the steeper sections the glacier is heavily crevassed, partly because it began advancing in 1979. As a consequence of the broken surface, there are hardly any streams other than rills on the glacier surface, and the melt water may perhaps reach the glacier bed at many places. A map of the study area is shown in Figure 1. The contour lines indicating the glacier bed refer to radio echo-soundings (Wächter, unpublished). Seismic soundings (Reference SüsstrunkSüsstrunk, unpublished) have revealed two reflecting horizons, 10–15 m apart on the south side of the glacier, and 20–60 m apart on the north side. On the south side the lower of these horizons coincides with the horizon reflecting the radar waves. On the north side, however, the radar waves seem to have been reflected at the upper seismic horizon or, in some places, at an even higher horizon. A possible interpretation for the south side of the glacier is the existence of a dirt layer in the basal ice. This interpretation is corroborated by the fact that bore holes penetrated the upper horizon there; the drilling progress was slow in the last 5–10 m, and the drill stem became scratched. (It is surprising, however, that a layer which could be penetrated by the hot-water drill caused a reflection of seismic waves.) No certain interpretation can be given for the north side of the glacier; one possible explanation could be a layer of ground moraine overlying the rock bed. (No bore holes have been drilled on the north side so far.)
Map of the study area. Thin contour lines: glacier surface, contour interval 10 m. Thick contour lines: glacier bed (from radio echo-soundings by H.P. Wächter), contour interval 20 m, Poles of transverse profiles (A to D) are numbered, starting at the margin with 1. Pole D2 is between bore holes 9 and 10.

2. Measurements, Results, and Preliminary Discussions
2.1. Field techniques
Four lines (A to D) of poles on the left side of the glacier at distances of 300 m were surveyed several times daily. The instruments were Kern–DKM2A and Wild–T2 theodolites with automatic levelling. They were screwed on to short metal instrument poles cemented into rock and insulated with foam pads. The marker poles were frozen into the ice using a salt/ice mixture.
Twenty-five bore holes were drilled to the glacier bed with a hot-water drill described elsewhere (Reference IkenIken and others, 1977). The water levels were recorded with VDO membran gauges and 6-channel Goerz “Miniscript” recorders. The tolerance of records corresponds to an uncertainty in heights of water levels of ±2–4 m, depending on the performance of individual gauges. The bore holes were flushed for several hours daily, in general with a constant measured water discharge in the range of 0.2–0.4 1/s. Flushing was accomplished by means of a water-line system of hoses sucking water from pools or crevasses up-glacier. Small natural streams were flowing only into hole 7 and, from 7 June onward, into holes 4 and 6.
Seismic activity was recorded with two standard micro-earthquake recorders operating in the frequency range 2–50 Hz. They were situated near the centre line and separated by a distance of 870 m.
2.2. Water-level variations
2.2.1. The records
Eleven bore holes connected with the subglacial drainage system for different periods of time (in a pilot study in 1980, five holes out of eight connected). Near the margin, drilling was less successful than in the central part of the glacier. In the connected holes the water level dropped quickly to a depth of approximately 70 m below the surface. In at least two cases this happened before the drill had reached the glacier bed; when the holes were re-drilled later, they could be made a few metres deeper. Some of the holes, or their connections with the subglacial drainage system, soon became obstructed in spite of efforts to flush them. The water-level records indicate whether there was an efficient connection between a hole and the subglacial drainage system; if the connection was poor, the water level would rise when the water input was turned on, or drop when the water input was turned off. The pressure records for such holes do not give a reliable indication of the pressure in the subglacial drainage system.
The pressure records of four holes which had good connections with the subglacial drainage system during most of the time are shown in Fig. 2b, together with the velocities of two poles, the discharge of the terminal stream, and air temperatures. Figure 2a gives additional velocity data. The variations of water level in these holes were in general quite similar and obviously correlated with the velocity variations. On a more detailed scale, the individual records show frequent, irregular deviations from the general trend. In June, diurnal variations in water levels became distinct, with peaks in the late evening. There were two cases when a systematic phase shift occurred between records of bore holes at different locations with respect to distance down-glacier. the large peaks on 30 May and 12 June, These events will be considered in a later paragraph. Although the four holes were located in different zones with respect to slope and longitudinal compression of the glacier (Fig 3), the water level was very roughly, that is within approximately 10 m, at the same depth below surface in all of them. This applies also to holes 8 and 9 during the brief period when they had connections.
Velocity records for poles near the centre line of the glacier. Broken lines indicate mean velocities over periods when no short-interval measurements were made.
b. Top: velocity of two poles of profile c. Broken lines indicate mean velocities over periods when no short-interval measurements were made.
Upper middle: depth of the water level below surface in four bore holes.
Lower middle: discharge of the terminal stream (by courtesy of Grande Dixence, S.A.). Broken line: a dam had broken and discharge data refer to only part of the outlet stream.
Bottom: thick line: air temperature near the glacier terminus (by courtesy of Grande Dixence, S.A.).
Thin line: temperature of the free atmosphere at the 700 mbar level near Payerne (by courtesy of Schweizerische Meteorologische Anstalt).

Longitudinal sections through the part of glacier studied. (a) Vertical section along a straight line through bore holes 1, 7, and 10. Poles or bore holes which were located at a significant distance from this section are indicated with broken tines. (b) Section following approximately the Talweg of the glacier and passing through bore hole 4.

In the two semi-marginal holes, 1 and 5, where the ice is only 110 and 85 m thick, respectively, the water levels tended to be somewhat deeper. That is, the piezometric surface, which approximately paralleled the ice surface in the central part of the glacier, appeared to drop slightly towards the margin; transverse profiles over the ice surface were almost horizontal in the study area. The record of hole 5, which was situated on a relatively steep slope (and thus may not be representative for semi-marginal positions in general) is shown in Figure 4. The record of the other hole, 1, was only very brief. On the whole, the conclusion that water levels in semi-marginal positions were lower, is not absolutely certain, because data are too few.
Water-level record in semi-marginal bore hole 5 (the record in hole 4 is shown by a thin line for comparison). At hole 5, the glacier is only 85 m thick, and the pressure gauge was at a depth of 78 m. The record is shown by a broken line when the water level was below the gauge.

Water-level records for holes 7 and 10 are quite different from the others; the daily peaks occurred earlier and the water levels were usually higher (see Fig 5). A small local melt-water stream was flowing into hole 7. Additional water input through one or two hoses is indicated in Figure 5 with “+” signs; it caused a significant rise in water level in hole 7. This means that the hole had a poor connection with the subglacial drainage system. The maximum daily water level is therefore markedly shifted towards the time of maximum discharge into the hole. In early June, the snow depth was 0.5 m in this area. According to Reference BurkimsherColbeck and Davidson (1973), the maximum melt-water volume flux from such a snow cover should be expected in the early afternoon. No stream was flowing into hole 10 from the surface but it is conceivable that the hole communicated with a system of nearby crevasses. The records would then indicate impeded drainage of that system and a considerable storage capacity at shallow depth (approximately 20 m below surface). Storage at that depth caused a time delay of daily maximum water levels. In this hole the water level was not much affected by water input through hoses.
Water-level record in bore holes 7 and 10 with particular drainage conditions. (The record of bore hole 11 is shown for comparison.)
+ water is led into hole 7.
‡ water input enlarged (flow through two hoses).
− water input through one hose stopped.
= water input through both hoses stopped.
When the water-level record was greatly disturbed by artificial input through the hoses, it is shown with a broken line.

In summary, the majority of bore holes had similar water-level records with daily maximum levels in the late evening. These records correlated with the velocity variations of the glacier. In the two semi-marginal holes, the water levels were often a few metres deeper. Two holes had quite different records; the water levels tended to be higher and reached the daily maximum several hours earlier. The water level of one of these holes (7) was definitely affected by a local melt-water stream flowing into the hole.
2.2.2. Preliminary conclusions on the drainage system
In the study area, small melt-water streams were flowing into many crevasses and presumably reached the glacier bed. It is noteworthy that the existence of such streams did, in general, not cause deviations from the uniform depth of water levels in different bore holes. Furthermore, the very marked Footnote * diurnal variations in discharge of these streams did not affect the variations of subglacial water pressure. The recorded pressure maxima occurred up to 6 h later than the maxima of melt-water flow from the thin local snow cover. The synchronous response of pressure variations in different bore holes excludes a delay due to water storage as a possible reason. We believe that the water-pressure variations corresponded to the variations of melt-water flow originating in the large area up-glacier where the snow cover was still 2–3 m thick. Which are the conditions to render possible the dominating influence of water flow from areas up-stream and the suppression of effects of the numerous local streams?
First, it is necessary to assume that the discharge from the upper glacier contributed the largest proportion of the total discharge (precisely, of the total discharge in that section of a conduit where the largest part of the total hydraulic head is consumed). Secondly, one has to assume that the loss of hydraulic head along the local tributaries was small, even during times of peak discharge. Either they joined a larger stream with melt water from the upper glacier after a quite short distance (this presupposes a large number of such streams) or the gradient of hydraulic head along the tributaries was small, or both. (The records of hole 7 demonstrate what happens if this condition is not fulfilled.)
Subglacial streams may either flow in semi-cylindrical channels melted into the ice or flow through existing subglacial cavities (Reference LliboutryLliboutry, 1968), or seep through sediments. Which of these flow modes appears to correspond best to the observed facts?
Seepage through till can be ruled out as a major mechanism of subglacial flow in this area because of the very low seepage velocity in till (Reference Lambe and WhitmanLambe and Whitman, 1979, tables 3.2 and 19.1). More permeable sediments, namely remnants of a former outwash plain, are not likely to be present in the study area but may exist down-stream of it, below a riegel (personal communiccation from C. Schluechter).
If water flows through subglacial cavities, a slight increase of water pressure causes an immediate expansion of the cavities and also opens connections to neighbouring strings of cavities, which prevents a large build-up of water pressure. In contrast, a compact channel adjusts much more slowly to a change in pressure.
The characteristics outlined above suggest that the small local melt-water streams largely flowed through subglacial cavities. That would explain why the strong variations of discharge were accompanied by only small variations in water pressure. Furthermore, extensive bed separation would also provide an explanation for the sensitive reaction of the velocity of the glacier to the variations of water pressure. The subglacial water pressure can affect the sliding velocity only if it acts on a large proportion of the glacier bed (and not just in the vicinity of a few channels).
2.3. Velocity records. The relationship between subglacial water pressure and velocity of the glacier
In Figure 2a, the horizontal component of the surface velocity of poles near the centre line of the glacier is plotted against time; a similar plot for two poles of profile c is shown at the top of Figure 2b. (The method of calculation of short-term velocities and of the estimation of tolerances is described in Appendix I.)
Velocity variations of longer duration and larger amplitude were in general similar at profiles B to D. (An obvious exception is the marked velocity peak occurring at profile D on 7 June.) Velocities measured at profile c, which was in the centre of the study area, correlate best with the water-level data, also shown in Figure 2b. In Figure 6, the velocity of pole C3 is plotted against the mean depth of water levels in bore holes 3, 4, 6, and 11, which were all between 160 and 175 m deep. The points of this plot were selected subject to certain conditions, as explained in Appendix II. The plot shows some remarkable features from which important conclusions can be drawn:
-
(1) The points cluster along a distinct curve which appears to have an asymptote where the subglacial water pressure approaches the ice-overburden pressure or a value close to that. (At its centre line, the glacier is 180 m deep and the ice-overburden pressure is equivalent to that of a column of water 162 m in height; the corresponding water level is 18m below the surface).
-
(2) A functional relationship is still distinct down to water levels as low as 80 m below the surface.
-
(3) Data points of different periods, indicated by different symbols, are approximately on the same curve. This applies even to the data from the pilot study in June 1980. (Exceptions are the low-pressure points of the period 30 May–4 June 1982.)
Velocity of pole C3 as a function of the subglacial water pressure (shown as depth of water level below surface). The water pressure, equal to the ice-overburden pressure σ0 at the centre line, corresponds to a depth of water level of 18 m below the surface. Different symbols refer to different periods:
☐ large open symbols indicate that the scatter of depths of water levels in different bore holes was small, as well as the scatter of velocity values at profiles B to D.
∎ small, full symbols indicate a larger scatter.
↑ upward pointing arrows indicate that cavities were presumably shrinking (water levels were dropping). In this case, the sliding is too small compared to the steady state.
↓ downward pointing arrows indicate that cavities were presumably growing. In this case, the sliding velocity is too large compared to the steady state.
The lower part of the figure is an enlarged section.

The first feature will be discussed in a later paragraph. Feature (2) permits a definite conclusion to be drawn on the mechanism of water-pressure dependent motion relevant in the study area. There is no doubt that it is the sliding motion which is affected by the water pressure, and that the short-term variations of measured surface velocity are related to those of the sliding velocity. Possible mechanisms are:
-
(a) Growth of water-filled cavities at the glacier sole as a function of subglacial water pressure (e.g Reference LliboutryLliboutry, 1968, Reference Lang, Lang, Leibundgut and Festel1978, Reference Lliboutry1979; Reference IkenIken, 1981) or, in Reference WeertmanWeertman’s (1979) terminology with some modification, non-uniform growth of a water layer which has a non-uniform and locally substantial thickness.
-
(b) Decoupling of glacier sole and bed where the glacier is afloat.
-
(c) Increased sliding when the pore pressure in subglacial sediments is large enough that deformation of subglacial sediments can take place (Reference BindschadlerBoulton, 1979).
In the study area the glacier is up to 180 m thick. It can only be afloat if the water level is not deeper than 18 m below the surface. Clearly, mechanism (b) above is inadequate to explain most of the velocity variations.
Deformation of granular sediments (c) is possible if

where τ is the shear stress, σ0 the overburden pressure, p w the pore pressure in the sediment, and F r is the friction factor, a constant.
For densely packed granular sediments, F r is in the range of 0.8–1.1; for loose packing F r is between 0.6 and 0.7 (Reference Lambe and WhitmanLambe and Whitman, 1979). Near the centre line, at the glacier sole, σ 0 = 15.9 bar = 15.9 × 10 5 Pa and τ ≈ 1 bar = 105 Pa.
(The latter figure was estimated from glacier geometry. Assuming that the sliding velocity is constant along a transverse profile, one finds with a geometric shape factor of 0.58 and a mean surface slope, taken over 2 km, of 6.5° that τ ≈ 1.05 bar. Assuming, alternatively, that the basal shear stress is constant along a transverse profile, one finds T ≈ 0.9 bar.) Choosing Fr = 0.6, a low value favourable for shearing of the sediment, we find from Equation (I)

This water pressure at the glacier sole corresponds to a depth of water level of 35 m or less. The functional relationship in Figure 6 obviously extends to much greater depths of water levels. If the subglacial sediments are not granular but rich in clay, deformation may be possible at a lower pore pressure. In this case, however, the permeability would be very low (in the order of 10−6 mm/s) and simultaneous variations of water pressure at various places in spite of storage would be very unlikely.
We therefore conclude that it is the mechanism of formation of water-filled cavities at the glacier sole which is operating in the study area. This conclusion is in agreement with the considerations in section 2.2.2. The existence of extensive bed separation implies that the amount of sediment between the bedrock and the glacier sole cannot be very large; if it were, the sediments would tend to fill up cavities and interconnecting channels, and prevent an uneven pressure distribution at the glacier sole which is the pre-condition for cavity formation.
Feature (3) concerned the approximate invariability of the functional relationship with respect to time or progress of the melt season. Strict invariability implies that neither the basal shear stress nor the proportion of the glacier sole affected by water-pressure variations in the subglacial conduits changes with time. In fact, if for instance the basal shear stress increases, the sliding velocity at a certain subglacial water pressure also increases and then the data points would be above the present curve. On the other hand, if small subglacial channels are abandoned while a few large ones grow, presumably a smaller proportion of the glacier sole would be affected by water-pressure changes in the channels. In this case, an increase in the subglacial water pressure does not cause as large a velocity increase as before, and the data points would be on the right side of the present curve. Of course, the extent of the cavity network and the degree of interconnection varies as a function of water pressure; but this function did not change significantly in the course of time. Exceptions are the data points depicted by triangles and referring to the period 30 May–4 June 1982, which are somewhat above the drawn curve. A possible explanation is that during the significant drop in water level following the high-pressure event on 29/30 May a large number of cavities became essentially disconnected and temporarily retained a higher pressure than that in the conduits. (Such a situation is depicted by the broken line in Figure 12 in section 3.1.) Eventually, these cavities may have drained further by seepage resulting in a corresponding adjustment of water pressure within them (for a given bed topography the pressure in isolated cavities is a function of their volume and of the sliding speed).
2.4. Special events in the drainage system
2.4.1. Drainage of a small lake into the glacier
In the night and early morning of 6/7 June approximately 3000 m3 of water drained from a small lake through the moraine near theodolite-station A. The water was then flowing along the glacier margin and into a moulin just up-stream of profile B.
Features in the data were:
-
(a) On 7 June, between 10.00 and 16.30 h, the horizontal velocity increased strongly at all poles of profile D but at no other survey marker. (The velocity of pole D3 is shown in Figure 2a.)
-
(b) During the same period (i.e. between two surveys) pole Cl moved upward by 14 mm in addition to the normal vertical movement and later downward by the same amount (Fig 7). None of the other poles showed a significant deviation from the regular vertical movement.
-
(c) The records of subglacial water pressure were not affected. (Holes 3, 4, 6, 7, and 11 were functioning at that time.)
Vertical displacement of poles of profiles C and D. In the night of 6/7 June, a small lake had drained into the glacier; only at pole CI the vertical displacement seems to have been affected.

These observations suggest that the water could not enter the main cavity network before it had reached approximately profile D. It seems to have flowed in the area beneath pole Cl causing there a temporary uplift that was possibly localized because of the small ice depth. Apparently, the conduits in the marginal zone were not connected with the main cavity network. This is plausible if indeed the water level was parallel to the glacier surface, which implies a relatively small subglacial water pressure near the margin. The scarcity of connecting bore holes near the margin can perhaps be explained in this way. At profile D and just below, the glacier is crevassed and appears to descend over a step or knob on the south side of the valley. Possibly, the water could enter the cavity network near this irregularity in the glacier bed.
The local velocity increase should be accompanied by longitudinal straining of the ice and consequently by a downward movement of the ice at or up-stream of profile D. This was, however, not observed. A very speculative explanation is that the downward movement was compensated by an upward movement due to subglacial water storage.
2.4.2. Waves of high water pressure travelling down the glacier
Two events of waves of high water pressure were observed in the spring of 1982: on 30 May and on 12 June. A similar event had been observed in 1980. That event had been preceded by a period of very strong melt while a similar relationship to such periods was not obvious in 1982.
The wave of 30 May 1982
The situation before the event: 25 and 26 May were sunny and warm; the following days were cooler and more cloudy. At profile c the snow melt varied between 4 cm of snow/d from 24 to 25 May, 5.5 cm/d from 26 to 28 May, and 3 cm/d from 29 to 31 May. The mean snow depth was 0.6 m on 29 May. The velocity of the glacier and the discharge of the terminal stream increased slightly and gradually from 26 to 29 May (Fig 2b).
The event: in the evening of 29 May the water level in the bore holes began to rise very rapidly; at first in the upper bore holes but some hours later in the lower ones. In two holes, 3 and 11, the water rose to a higher level than corresponded to the ice-overburden pressure (no water flowed into these holes from the surface). The water level remained high for a few hours and then dropped gradually. The typically sharp rise and gradual decrease in water levels and of seismic activity is depicted in Figure 8. The times of rising and of maximum water levels in various bore holes are listed in Table I together with data on seismic activity. The scatter of wave velocities, also given in this table, is in part due to uncertainty in interpretation (the leading edges of pressure curves, for instance, were disturbed by the ordinary daily fluctuations of water pressure). To some extent, however, this is real. After the event the water pressure fell to particularly low values and the connections of some bore holes with the subglacial drainage system became obstructed.
Fig. 8. Water level in two bore holes and seismic activity at two seismographs during the passing of a wave of high water pressure.

Various water-filled crevasses and a small supraglacial lake drained in the night 29/30 May. A lake of turbid water formed temporarily at the southern margin between profiles C and D; its level had a maximum before 08.00 h on 30 May. The discharge of the terminal stream increased strongly on 30 May. A dam broke, and therefore only part of the total discharge was recorded, and the time of maximum discharge may have been later than shown in Figure 2b.
In the night of 29/30 May the horizontal velocity nearly doubled (during a shorter, not observed period it was probably much larger). At profile A, and only there, the velocity was already quite high in the afternoon of 29 May (Fig 2a), The velocity data do not demonstrate the propagation of the wave beyond that, because no measurements had been made overnight.
In the records of vertical displacement, however, the passing of the wave can be recognized quite distinctly (Fig 9). The descending part of these graphs resembles the decrease of a draining reservoir and is thus suggestive of temporary water storage during the passage of the wave of high water pressure. This question is considered in detail in Appendix III. The analysis in Appendix III suggests that temporary water storage, equivalent to a layer of 100 mm thickness, had occurred. That analysis is based on the assumption that the (few) measurements of longitudinal straining of the ice at the glacier surface are not very different from the longitudinal straining averaged over the ice thickness. In a recent paper by Balise and Raymond (1985) it has, however, been shown that this assumption is wrong, if the perturbation of sliding velocity is restricted to a section of the glacier bed which has a length in the order of the ice thickness. The validity of the result in Appendix III is therefore doubtful.
Vertical displacement of several poles during the passing of the wave of high water pressure.

The measurements show that the maximum upward displacement was completed 4–5 h after the maximum of water pressure, at a time when the water level had dropped by about 15 m. (The last statement refers to hole 11 and profile D. The maximum water pressure was recorded at hole 11 at 05.30 h. If the wave of high water pressure travelled with a velocity of, say, 125 m/h down-glacier, it would have arrived at pole D2 at 05.50 h and at pole D3 at 06.10 h. The maximum upward displacement of poles D2 and D3 was measured at approximately 10.00 and 11.00 h, respectively.)
The wave of 12 June 1982
In the preceding week the weather was cloudy and not very warm. The wave passed during a time of dense fog and some drizzle.
The event showed some distinct differences compared to that of 30 May:
-
(a) The basal water pressure stayed well below the ice-overburden pressure in all bore holes.
-
(b) The rise and decrease of water pressure was more gradual. In two holes (3 and 4) the peak of water pressure consisted of several maxima (Fig 2b).
-
(c) In the lower part of the observed area the water-pressure peak had become low, and the seismic activity hardly exceeded the background noise.
-
(d) The velocity of the wave of high pressure was distinctly smaller than that of 30 May (Table I).
-
(e) The variation in vertical displacement of the ice was smaller by at least an order of magnitude.
The wave of 16 June 1980
In that year not much melt had occurred before 12 June. The snow cover was still 2 m thick at profile B. Between 12 and 14 June an unusually high temperature with a clear sky and strong winds caused very high melt-water production which stopped abruptly on 15 June. One bore hole, 80 m east-north-east of hole 11 (Fig 1), was functioning in this pilot study. The water-level record shows two peaks, on 15 and 16 June (Fig 10). The maximum level (on 16 June) was 26 m below the surface, which corresponds to a basal water pressure of 0.9 bar below the ice-overburden pressure. Glacier movement was measured at profiles B and D. The data suggest the propagation of a wave (Fig 10). The velocity of propagation can, very approximately, be determined from the records of vertical displacement. The result is a velocity of ≈ 67 m/h which is comparable to that of 12 June 1982.
(The distances given in the table are the projections of the distances between two holes on the valley axis.)

Fig. 10. Wave of high water pressure on 16 June 1980: horizontal velocity and vertical displacement of two poles B3* and D3 * near the 1982 poles B3 and D3. water level in a bore hole between these poles, discharge at the terminus, and air temperature at the terminus and of the free atmosphere at 700 mbar (by courtesy of Grande Dixence, S.A. and Schweizerische Meteorologische Anstalt). The dotted line is an extrapolation of the vertical displacement of pole D3*, indicating the probable time of maximum upward displacement.

Source of waves
There was no obvious relation between the events of high water pressure and periods of strong melt in 1982, and yet the discharge of the terminal stream increased markedly just after these events. This suggests that the events were caused by the break-out of a water reservoir up-stream of the study area. Before the main outbreak, some leakage may have occurred, causing a gradual increase in discharge in the days preceding these events.
The event of 1980 was related to a period of strong melt. It is conceivable that the first peak of water pressure corresponded to the maximum melt-water volume flux from the thick snow cover, while the second peak was caused by the break-out of a reservoir.
Similar waves observed by other investigators
Waves of high water pressure have been frequently and more comprehensively observed at Variegated Glacier during melt seasons before a surge. These waves, termed “mini-surges”, will be described in a paper being prepared by Kamb and Engelhardt. Specific aspects of these mini-surges have been studied by Reference Humphrey, Humphrey, Raymond and HarrisonHumphrey and others (in press), Reference Raymond and MaloneRaymond and Malone (in press), and Reference Balise and RaymondBalise and Raymond (1985). In these mini-surges the water pressure exceeded the ice-overburden pressure. The waves travelled down-glacier with velocities in the range of 300–450 m/h and were observed over distances of several kilometres. Typically, the water pressure in a bore hole rose rapidly and dropped gradually. The water-pressure waves were accompanied by corresponding waves of dramatically accelerated glacier motion, in which the flow velocity increased several times, by an uplift of the glacier surface and by a strain wave. In general, the strain wave could not account for the uplift of the glacier surface. The latter was therefore interpreted as partly due to basal water storage. As the waves propagated down-glacier, they eventually attenuated; initial growth of a wave has also been observed.
On the whole, the waves of high water pressure in Findelengletscher resembled these mini-surges, although they were less conspicuous (the water pressure reached the ice-overburden pressure only locally or not at all) and propagated at slower velocities.
Interpretation
The waves will be discussed in detail in a separate paper being prepared by Kamb and others. Here we outline briefly the conditions relevant to the occurrence of the waves described above. In the three observed events the water pressure was unusually high. Apparently, the existing subglacial drainage system was insufficient to accommodate a sudden water input. At a high water pressure the sheet-like cavity conduits could enlarge much faster than the cylindrical channels. Moreover, in the zones where the water pressure was at or above the ice-overburden pressure, bed separation could occur very rapidly. A substantial part of the accumulated water was therefore routed through developing or expanding sheet-like spaces below the glacier sole. This mode of flow determined the features of the waves of high water pressure.
The velocity of propagation of these waves follows from a balance of discharge and thickness changes (storage) in the water layer at the wave front. The velocity of the wave is therefore in general different from the mean velocity of flow in the conduit up-stream of the wave front. A detailed analysis shows that storage, additional to that in the sheet-like conduits themselves, has to be assumed in order to account for the low propagation velocities observed. The velocity of the wave decreases with increasing water storage outside of the conduit. (The seemingly lower wave velocity on 12 June compared to that on 30 May seems to conflict with this prediction, because water storage was larger on 30 May. On 12 June, however, the peak of water pressure was well below the ice-overburden pressure. Therefore, no complete, continuous separation of the glacier sole could occur but presumably there was an enlargement of existing sheet-like conduits along strings of cavities. This implies a zig-zag path of water flow along which the wave propagation would have been faster than the velocity given in Table I. That velocity refers to a propagation along a straight line. The assumption of water flow along various zig-zag paths would also provide an explanation for the large scatter of wave velocities found between different points in this case.)
In the regular diurnal variations in water levels no systematic phase shifts between the records in different bore holes are evident. A possible explanation is that the maximum water pressure was then not very high and therefore storage outside of the conduits was small. Consequently, the wave velocity may have been too large to be detectable.
2.5. Experiments carried out by other investigators
2.5.1. Dye tests
Uranin, rhodamin B extra, and tinopal ABP solutions were injected into bore holes and later in the summer into moulins, approximately at the time of daily maximum discharge (Reference MoeriMoeri, unpublished). Usually the maximum dye concentration was detected at the terminus 1–4 h after injection, corresponding to mean velocities in the range 0.12–0.48 m/s if the streams were flowing along straight lines. These velocities are within the range usually found in such experiments but on its lower side (Reference StenborgStenborg, 1969; Reference Ambach, Ambach, Behrens, Bergmann and MoserAmbach and others, 1972; Reference Behrens, Behrens, Bergmann, Moser, Ambach and JochumBehrens and others, 1975; Reference Lang, Lang, Leibundgut and FestelLang and others, 1981; Reference BoultonBurkimsher, 1983). In June, when the experiments commenced, and in the autumn the velocities were smaller than in summer. For comparison, the mean velocity in straight cylindrical channels is given in Table II using various assumptions. (β = 8°corresponds to a straight channel under Findelengletscher; β = 3° corresponds to a meandering channel.)

A characteristic result was the presence of multiple peaks of dye concentration in samples taken at the snout. Large secondary maxima tended to occur in the afternoons of the following days, during times of rising or high discharge and subglacial water pressure. Such secondary peaks were not significantly broader than the maximum peak. As an example, the result of a test in bore hole 1 is shown in Figure 11. Besides these large secondary maxima, several irregular pulses of increased concentration were detected; they became more frequent and sharper in the autumn.
Tracer experiment in bore hole I, 14 June 1982. Input of dye at 17.10 h (from Moeri, unpublished).

The multiple peaks indicate a complex subglacial drainage system, with various branches and/or storage spaces. The particular finding that secondary peaks were often sharp and tended to occur in the afternoons of the following days cannot be understood by simply assuming flow through various channnels of different length, but an additional assumption is needed:
-
(a) One possibility is to assume that some of the subglacial conduits had pressure-controlled valves, so that water could flow through them at times of high water pressure but was trapped during times of low water pressure.
-
(b) Another possibility is to assume intermittent rinsing of storage spaces by the transfer of local surface melt water at times of high melt rate. (The simpler concept of storage spaces without flow through them would result in a different timing of the concentration peaks, which should then occur at times of low water pressure, when subglacial cavities are shrinking and releasing stored water.)
2.5.2. Conductivity measurements
Reference CollinsCollins (1979) recorded the electrical conductivity of the terminal stream of Findelengletscher as well as of the neighbouring Gornergletscher. On the assumption that the two components of a terminal stream, “subglacial flow” and “englacial flow”, had a certain constant solute concentration, he derived the proportion of subglacial flow in relation to the total discharge. (Collins defined “subglacial flow” as flow in intense contact with the glacier bed, and “englacial flow” as flow with insignificant contact with the bed. The latter definition includes large streams at the glacier bed.) His analysis revealed three principal differences in the subglacial drainage systems of Findelengletscher and Gornergletscher:
-
(a) Diurnal variations of subglacial flow were approximately in phase with those of the total discharge at Findelengletscher; they were out of phase by nearly 12 h at Gornergletscher.
-
(b) The mean solute concentration was four times larger in the terminal stream of Findelengletscher than in that of Gornergletscher.
-
(c) In the event of an unusually large run-off, the subglacial flow of Findelengletscher increased quite suddenly and took over the greater part of the total discharge (this refers to Collins’ (1979) figure 4; 11 August 1977). Nothing similar has been observed at Gornergletscher.
These differences can be explained if one assumes numerous small conduits under Findelengletscher and fewer but larger conduits under Gornergletscher. In particular, if the conduits under Findelengletscher consist in part of subglacial cavities, they can adjust quickly to a sudden increase in run-off and water pressure by expansion of bed separation.
In the case of Gornergletscher, Collins assumed that the subglacial flow was retained in times when discharge and pressure in the major drainage channels were large. At low water pressure, however, water from subglacial storage was released into these channels.
In summary, Collins’ results on the drainage of Findelengletscher agree well with the results of the present study. The different type of drainage system of Gornergletscher, namely the smaller frequency of subglacial conduits, may be responsible for the absence of diurnal velocity variations in that glacier (Reference IkenIken, 1978).
3. Comparison with Theoretical Predictions
3.1. The relation between subglacial water pressure and sliding velocity
3.1.1. The relation in a simple model
We consider a perfectly lubricated bed (no tangential stress) undulating sinusoidally in the flow direction. The pressure which the sliding ice mass exerts on the bed is not distributed evenly but is larger than the ice-overburden pressure on the up-stream faces of undulations and smaller on the down-stream faces. The pressure at the glacier bed can in general be expressed as

where σ 0 is the ice-overburden pressure and P 0(x,y) is a fluctuating contribution which is related to the basal shear stress, τb, by

Here A r is an area large enough to be statistically representative of the glacier bed; the x-axis points downstream in the direction of the mean bed slope, and the z-axis points upward, in the case of the simple sinusoidal bed, considered now, P 0(x) fluctuates sinusoidally with the amplitude

where <P0 2>1/2 is the root-mean-square value of P 0, λ is the wavelength, and a is the amplitude of the bed undulations.
The minimum pressure occurs at the inflection points of the down-stream faces of the bed undulations and is termed the separation pressure, p s.

The separation pressure has been introduced and given in quantitative terras by Reference LliboutryLliboutry (1968), Reference NyeNye (1969), Reference KambKamb (1970), Reference MorlandMorland (1976), and others. If the subglacial water pressure exceeds the value p s, the ice starts to separate from the bed, water-filled cavities form, and the sliding velocity increases. If the subglacial water pressure exceeds a critical value, namely

the glacier is pushed upward along the steepest tangent of up-stream faces of bed undulations with accelerating velocity. βm is the angle between the steepest tangent of the up-stream faces and the direction of the mean bed slope (Reference IkenIken, 1981).
Sketch of the functional relationship between the subglacial water pressure and the sliding velocity on a sinusoidal bed supporting no tangential stress.
ps separation pressure.
pc critical pressure.
σ0 ice-overburden pressure.
vs sliding velocity at the separation pressure.
— perfect connections between cavities (low-pressure zones) and subglacial drainage system.
--- degree of interconnection of cavity network decreases as the pressure in the subglacial drainage system decreases. The water pressure in the disconnected cavities remains above the pressure in the subglacial drainage system.
.... pressure in disconnected cavities has adjusted to the minimum pressure in the drainage system by seepage. During the subsequent increase in water pressure in the drainage system, the pressure in the disconnected cavities remains too low. At high water pressure, connections are re-established.

In the case of a sinusoidal bed,

and

In Figure 12 the functional relationship between subglacial water pressure and sliding velocity is sketched for the case of steady cavities and a constant basal shear stress. The sketch illustrates the two characteristic features:
-
(a) The sliding velocity is constant at water pressures below the separation pressure.
-
(b) The sliding velocity becomes infinite when the subglacial water pressure attains the critical value pc.
3.1.2. Comparison with the empirical relation
Comparing the above sketch with Figure 6 suggests that the range of measured water pressures was considerably above the presumed “separation pressure” of Findelengletscher. One may speculatively infer a value for the separation pressure at the bed of Findelengletscher by extrapolation of the curve in Figure 6 until it has a horizontal tangent. The corresponding depth of the water level is in the range 140–240(m below the surface. As an illustration, we will consider two cases in detail:
-
(a) The separation pressure corresponded to the depth of the water level of 180 m below the surface, which is equivalent to a water pressure of zero bar (the glacier is 180 m thick).
-
(b) The separation pressure corresponded to the depth of the water level of 140 m below the surface. This represents an upper limit to the possible separation pressures obtained by extrapolation of the curve in Figure 6.
-
Case. (a). Inserting a water pressure of zero bar for p s in Equation (3) and σ0 = 15.9 bar, and τb ≈ 1 bar, yields a bed roughness a/λ ≈ 0.02. This is a relatively low value and compares well with the appearance of the now exposed bed of Findelengletscher 2 km down-glacier from the study area (Fig 13). On the other hand, if we insert a/λ = 0.02, σ0 = 15.9 bar, and τb ≈ 1 bar into Equation (5), we obtain a critical pressure p c = 7.9 bar, corresponding to a depth of the water level of 99 m below surface. Obviously, no sliding instability was observed anywhere near this value at Findelengletscher (Fig 6). The result therefore indicates that the idealized model is not adequate for an interpretation of the data. Possible reasons for the discrepancy will be discussed later.
-
Case (b). An analogous analysis leads to a/λ = 0.027 and p c = 9.9 bar (which is also far too low). In this context, it is also interesting to compare the sliding velocity predicted by the model with the measured velocities.
The former glacier bed 2 km down-stream of the study area. Bedrock undulations with wavelengths of several metres or less have small amplitudes.

The sliding velocity at the separation pressure can be calculated from Reference KambKamb’s (1970) equations (92) and (96). Numerical values have to be specified for the following parameters:
-
N and n, parameters of the flow law of ice
 ;
-
Г, a constant in Kamb’s theory expressing thermal properties of ice and rock (Г is only influential if regelation is significant);
-
λ = 2π/h, the wave length; and
-
ζ = a/λ the roughness of the bed.
 ;
The roughness has been inferred above: ζ = 0.02 (case (a)). Other numerical values adopted are:
-
n = 3.
-
N = 1.32 bar a1/3 (a value inferred from bore-hole deformation at Athabaska Glacier (Reference RaymondRaymond, 1973)).
-
Г = 120 bar a m−2 (a value from the range suggested by Kamb).
For two choices of λ, 3 m and 2.05 m, the sliding velocity has been calculated; the results are 13.4 mm/h and 9.2 mm/h, respectively.
With λ = 2.05 m, a sliding velocity compatible with the measured surface velocity is found, while for λ = 3 m the calculated sliding velocity is certainly too large. On the other hand, the visual appearance of the bed undulations (Fig 13) would suggest an even greater wavelength.
The value chosen for N is a relatively large one; in fact, Reference Raymond and ColbeckRaymond (1980) suggested a smaller value in a reinterpretation of the Athabaska Glacier data. A smaller value of N would result in even higher values of calculated sliding velocities. On the whole, the idealized model tends to predict too large a sliding velocity.
3.1.3. Possible actual conditions preventing instability of the glacier
Based on the low values of separation pressure and bed roughness inferred from the measurements, the idealized models predict instability at a far too low water pressure and too high sliding velocities in general. Possible reasons for this discrepancy are discussed below.
(1) Different bed topography
If we assume asymmetrical undulations rather than sinusoidal ones, in particular roches moutonnées, a low separation pressure is compatible with a substantial bed roughness and steep up-stream faces, and hence a higher value for the critical pressure than that derived above. Or, if we simply assume a sufficient frequency of vertical upstream faces of bedrock protuberances, the critical pressure even coincides with the ice-overburden pressure.
(2) Limited water supply
In the derivation of the critical pressure, it has been assumed that water has access to all low-pressure zones at the bed (cavities). At low water pressure this is hardly the case. Near the critical pressure, however, when the ice sole touches bedrock in small areas only, one would expect good connections between all cavities. However, in the initial phase of unstable sliding, it is also necessary that water is supplied to the bed at a high rate, equivalent to the accelerating growth rate of subglacial cavities. Under natural conditions of water supply, the velocity at the critical pressure is therefore controlled by the finite actual rate of (net) water input into the glacier. As a result, the subglacial water pressure should not rise above the critical value for an extended time span, namely the time of upward sliding along the larger obstacles. The observations do not demonstrate this feature. This therefore suggests that factors other than limited water input into the glacier prevent instability.
(3) Local occurrence of sediment layers between glacier sole and bedrock
While the observed relation between subglacial water pressure and velocity suggests the existence of an undeformable, undulating (rock) bed in the study area, other parts of the glacier may rest on substantial sediment layers, for instance the north side of the glacier. Also within the study area there may be interspersed sediment patches, Since the permeability of the sediment layers is small, the rate of water supply to the interior of these patches is limited. Therefore, at increasing sliding velocity suction may develop in the sediment patches and prevent unstable sliding if the water pressure outside these patches rises to the critical value.
(4) Friction between glacier sole and bed
“Perfect lubrication”, i.e. no tangential stress at the ice/rock interface, has been assumed in the idealized model. In reality, rock particles, partly embedded in the basal ice or jammed at the bedrock, cause friction. The friction effectively reduces the basal shear stress available for sliding over the large-scale undulations, and determining sliding velocity, separation pressure, and critical pressure. If the reduction of the basal shear stress by friction were the same at the separation pressure and at the critical pressure, then the relation

which is valid for a perfectly lubricated sinusoidal bed, would still hold in the case of friction. This implies that the method of estimating the separation pressure from Figure 6 and then deducing the critical pressure would still give the same unrealistically low critical pressure as derived above. However, an analysis based on Reference HalletHallet’s (1981) theory shows that the reduction of basal shear stress by friction is larger in the case of extensive bed separation than without separation, for a given debris content in the basal ice. This will be described in a separate paper. The consequence for the present discussion is that the critical pressure is no longer given by Equation (6) but it is larger. Although this is the desired effect, it is noteworthy that the observations do not only indicate a higher critical pressure than predicted by the idealized model but a coincidence of critical pressure and ice-overburden pressure.
In summary, a variety of natural conditions may be responsible for the absence of instability and for the reduction of sliding velocity. We presume that debris in the basal ice, and locally below it, are the main factors.
3.2. The water pressure in subglacial conduits
3.2.1. Calculation of steady-state water pressure in straight cylindrical channels in the ice near the glacier bed
Assumptions and results of calculation: these calculations are based on a theory by Rothlisberger (1972). At a given discharge, channel closure due to ice pressure and channel expansion due to the melting of ice at the channel wall balance for a certain water pressure. This water pressure is calculated. Important simplifying assumptions are:
-
(a) No heat is transported by the water.
-
(b) The stress in the ice is isotropic and homogeneous.
The governing equation is

σ0 is the ice-overburden pressure, p w the water pressure, ρw the density of water, β the bed slope, D (= 3.63 × 10¹⁰ (N m−2)11/8 m−3/8) a constant related to material properties of water and ice, K (= 10 m1/3 s−1), the roughness coefficient of the conduit wall, Q the discharge, and n and A the flow-law parameters if the flow law is written

The x-axis is horizontal and curvilinear following the longitudinal centre line. β(x) and σ0(x) are calculated from the glacier geometry. Near the terminus the discharge was taken to be 1 m3 s−1 as is suggested by the discharge record (Fig 2b). At × = 0 (3 km up-stream of the terminus) a discharge of 0.7 m3 s−1, increasing linearly towards the terminus, has been assumed. The calculations have been carried out for four different sets of flow-law parameters.
In Figure 14 the results are depicted as hydraulic grade lines which represent the heights of water levels in piezo-metric pipes connected with the drainage channel. Case 1 refers to the flow-law parameters derived by Reference NyeNye (1953) from measurements of ice-tunnel closure. In this case, the hydraulic grade line is below the bed. In case 2, the height of the hydraulic grade line is comparable to that of the recorded water levels. The flow-law parameter A is, however, much smaller than any value given in the literature (e.g. Reference PatersonPaterson, 1981, p. 38; Reference LliboutryLliboutry, 1983, p. 220). Case 3 refers to the flow-law parameters derived by Reference GlenGlen (1955) with n = 4.2. The hydraulic grade line is only slightly higher than in case 1. In case 4, the parameter n also equals 4.2, while the parameter A is smaller by a factor of 10 (which corresponds to an even greater reduction in viscosity than was assumed in case 2 relative to case 1). The water-equivalent line is also shown in Figure 14. (The water-equivalent surface is obtained if the ice is replaced, column by column, by an equivalent mass of water.)
Fig. 14. Longitudinal section through Findelengletscher and hydraulic grade lines of the main stream calculated with different flow-law parameters.
1: A = 5.8 × 10⁷ N m−2 s1/n, n = 3.
2: A = 1 × 10⁷ N m−2 s1/n, n = 3.
3: A = 0.96 × 10⁷ N m−2 s1/n, n = 4.2.
4: A = 1 × 10⁶ N m−2 s1/n, n = 4.2.
WE: water-equivalent line.

3.2.2. Comparison of calculated and measured water pressure
The calculated examples suggest that the hydraulic grade line of a large cylindrical channel is much lower than the recorded water levels. Can such a channel exist in connection with the cavity network to which the recorded water levels refer? Given this case, two observed features cannot be understood:
-
(1) In general, the water level was at approximately the same shallow depth in all bore holes. (An interesting exception is the water level in hole 4, which at the end of June was about 20 m deeper than elsewhere with a trend towards a progressively greater depth.)
-
(2) The time of daily maximum water pressure recorded in the bore holes did not coincide with the time of maximum local melt-water input into the cavity network. The time lag was 6 or 8 h in early June, at least twice the unsystematic scatter of peak times of individual bore-hole levels (Figs 5 and 2b).
The first condition excludes the existence of tributaries which transferred substantial quantities of local surface melt water from the cavity network to the considered large drainage channel with a low grade line. Because these tributaries would also have relatively low grade lines (Fig 15), they would therefore cause a considerable drop in the water level in the adjacent parts of the cavity network, in contrast to the observed uniform, shallow depth of the water levels.
Transverse section of the glacier at profile C with grade lines of tributaries flowing towards a major drainage channel near the valley axis. The discharge of the tributaries increases from 1 l/s at the margin to 49 l/s at the confluence. Two hypothetical conditions of the main stream are considered:
A: the grade line of the main stream is at the glacier bed.
B: the grade line of the main stream is 70 m below the surface.
The label 1 refers to flow-law parameters A = 5.8 × 10⁷ N m−2 s1/3 and n = 3.
The label 2 refers to A = 107 N m−2 s1/3, n = 3.
WE is the water-equivalent line which has here a shallow local depression at a distance of 200 m from the margin.

The second observed fact has a similar implication; the gradient of the hydraulic head along the outlet(s) from the cavity network (i.e. the connection(s) between the cavity network and the main channel) cannot have been large, otherwise the considerable daily variations in discharge of local surface melt water would have been accompanied by considerable variations in water pressure at the head of the connection(s). The storage capacity of the cavity network can, to some extent, dampen and delay water pressure variations. This delay is likely to be different at different bore holes. The relative synchroneity of the recorded water-level variations therefore suggests that the storage capacity was not responsible for the absence of a water-pressure peak at the time of maximum local melt-water input.
It is concluded that the height of the grade line of a major channel connected with the cavity network was not very different from the recorded water levels, in contrast to the result of the calculations. Which of the assumptions made in the calculation were not adequate?
In the snow-melt season, the discharge generally increases and is not steady as assumed. Calculations by Reference SpringSpring (unpublished, fig 3.28), based on a theory of conduit flow of a fluid through its solid phase (Reference Spring and HutterSpring and Hutter, 1981), show, however, that the new steady state is almost reached within a few days after a change in discharge. Periods of this length with a constant daily mean discharge did occur; in such cases calculations based on Equation (7) should give adequate results.
In order to obtain agreement between the calculated grade line and the water levels measured at Gornergletscher, Rethlisberger (1972) assumed flow-law parameters corresponding to a relatively small viscosity for the basal ice:

The high content of impurities and unfrozen water in the basal ice, as well as its structure, may reduce its viscosity significantly, though probably less than required here (Reference DuvalDuval, 1977). A further reduction in the apparent viscosity may be attributed to the non-isotropic stress state (Reference GlenGlen, 1958) and to the occurrence of transient rather than secondary creep. (A very small apparent viscosity has been inferred from strain-rate measurements in ice tunnels at the foot of ice falls (Reference HaefeliHaefeli, 1951; Reference GlenGlen, 1956).) Reference LliboutryLliboutry (1983) has discussed several of these aspects including the effect of a non-homogeneous stress distribution along a channel at the glacier bed. The latter situation may also give rise to a higher energy dissipation which is required to prevent channel closure.
Altogether, it seems justified to assume a flow-law parameter A smaller than 5.8 × 10⁷ Nm−2 s1/n (with n = 3).
In the case of Findelengletscher, many streams originate at various crevasses through which surface melt water reaches the bed. Initially, these streams largely follow the existing cavity network and take a meandering path. We believe that this type of conduit was, to a large extent, preserved during the observation period. We will return to this point in section 4 and consider here only the consequences for the present discussion; the mere assumption of a multitude of conduits with a smaller discharge does not introduce a significant change in the calculated steady-state water pressure. This follows from the small exponent of Q in Equation (7); (σ0 − p w) is proportional to Q 1/4n. However, the conduits considered here meander which implies a smaller conduit slope, 6, as well as a greater conduit roughness (a smaller value of K) than originally assumed. Furthermore, these conduits do not generally have circular cross-sections, which may be expressed as a further reduction of A.
In summary, a combination of changes of the numerical values in Equation (7) seems to be appropriate. It is doubtful, however, whether these changes are sufficient to produce the required result. Since Equation (7) really applies to englacial channels, one should expect more substantial modifications if the channels are subglacial and if basal sliding is substantial. This aspect will be considered in more detail in section 4.
4. The Subglacial Drainage System of Findelengletscher at the Beginning of the Melt Season
Before the start of the melt season, the glacial run-off is small and the (steady-state) water pressure in the subglacial drainage system is high (Reference RöthlisbergerRöthlisberger, 1972). Records of water pressure in two bore holes near hole 11 agreed with this prediction; the water level was only at 60 m depth in early March, well before the start of the snow melt. The discharge of the terminal stream then amounted to 80 1/s (Reference LliboutryMoeri, in press). (We estimate that at most one-tenth of the discharge originated from basal melt due to the sliding motion and due to geothermal heat flow; the largest part was presumably ground water.)
As a consequence of the high subglacial water pressure, the interconnected subglacial cavities are large. Non-interconnected cavities (Reference SüsstrunkWeertman, 1964), which may have drained during the previous melt season, would also have grown during winter, as pointed out by Reference LliboutryLliboutry (1978). The small discharge serves to interconnect several of the cavities, at least intermittently.
When the snow melt starts, many small streams flow into the numerous crevasses of Findelengletscher and presumably reach the bed at many different places. As the water accumulates there and the pressure builds up, the cavities within reach grow. New cavities form where the contact pressure between the ice and the bed is gradually overcome by the water pressure so that connections to more distant strings of cavities may develop. In this way, the water advances along the bed on a zig-zag path. The direction of flow along the bed depends, at a scale of tens of metres, on the local bed topography which determines the location of subglacial cavities. On a scale of hundreds of metres, these streams tend to follow the steepest slope of the water-equivalent surface; this has been explained by Reference WächterWeertman (1966) and by Reference ShreveShreve (1972), and applies in the first place to water flow in a sheet between the ice and the bed. If one assumes an even distribution of ground-water springs and of drainage conditions, it also applies to the cavity network. In this case, the “hydraulic grade surface” (the surface through water levels in bore holes or piezo-metric pipes) of the cavity network is parallel to the water-equivalent surface. If, however, a large stream with a low grade line forms, it disturbs the original hydraulic grade surface in its vicinity and in the vicinity of its larger tributaries. This disturbance is illustrated in Figure 15 which shows grade lines of a large and a small tributary to a large stream, cases 1A and 2A, respectively. (As an alternative to the condition given in the figure caption, case 2A may be interpreted as the grade line of a much smaller stream in ice of higher viscosity than stated.)
Such a large stream apparently did not develop under the study area during the observation period. What may have prevented its formation? Up-stream of the study area, the width of the glacier increases markedly and the surface is irregular with several depressions. In the study area, the transverse slope of the water-equivalent surface is very small relative to the longitudinal slope. At profile c, between the margin and C2, for instance, the transverse slope is 1.3° (Fig 15). It is therefore possible that several individual streams flow more or less parallel to the valley axis for a considerable distance before they join to form a (or a few) single stream(s),Footnote * in spite of interconnecting cavities. During the recent advance, the surface of the lower part of the glacier has become more convex; this is obvious at profile D and below. The transverse slope of the water-equivalent surface may therefore have become even smaller than indicated in Figure 15, which was drawn from an old map. A paper in preparation by Röthlisberger has suggested that the flattening of the transverse slope of the water-equivalent surface of an advancing glacier may play an important role in the mechanism of advance through its effect on the subglacial water pressure.
Another question concerns the relatively high grade line of the smaller streams. As anticipated in the previous section, the high grade line is not so much a consequence of a small discharge but of a meandering path along cavities. This point is considered now in more detail. As long as the discharge is small, the zig-zag path along cavities is most appropriate because not much energy dissipation is required to keep this type of conduit open. When the discharge increases, channels are melted into the cavity roofs and these channels move along with the ice. Since cavities and strings of cavities tend to be oriented transverse to the sliding direction, the new channels are carried away from the original position of the stream and into a zone of higher contact pressure and closure rate. Here the channel cross-section is reduced and this causes the pressure to rise. At the higher pressure, however, the original conduit along the cavities expands much faster than the cylindrical channel. Therefore, an increasing proportion of the stream follows the old path while the developing cylindrical channel may be closed off. The condition that the discharge varies diurnally may add to the difficulty of channel formation; when the melt-water flow into the glacier increases at a fast rate, the presence of the cavity network prevents a corresponding build-up of the water pressure. The surplus of flow is not routed through the cylindrical channel but through the cavity network which quickly adjusts its size to a slight pressure increase. Whether or not a cylindrical channel detached from the original cavity path can develop depends on the magnitude of discharge and sliding motion which have opposite effects. We do not follow this question further here; it is part of a theory (paper in preparation by Kamb) on subglacial water flow. For the present purpose, we conclude that the interference caused by the sliding motion, together with the loss of discharge into the cavity network, may provide an explanation for the apparent stability of inefficient meandering conduits along strings of cavities. In the calculation based on Equation (7), we could have accounted roughly for the situation described here by multiplying the terms on the left side of the equation by a correction factor smaller than 1. (The expression on the left side of Equation (7) is proportional to the energy available for channel enlargement. Here it is assumed that a part of this energy is wasted by enlargements which are continuously removed by the sliding motion.)
5. Summary of Results
The observations have given an indirect insight into conditions at the glacier bed. Some of the conclusions drawn appear quite positive, whereas others remain controversial. The results and implications are reviewed below.
In the study area, the subglacial drainage system consisted of a cavity network and presumably of a substantial number of medium-sized meandering conduits.
The existence of an extensive cavity network is evident, in particular from the sensitive reaction of the velocity of the glacier to the variations in subglacial water pressure. The prominent variations in water pressure in this network were, in general, similar at different locations and correlated with the velocity variations. In June, they corresponded to daily variations in the flow from the thicker snow cover on the upper part of the glacier. Smaller fluctuations were different at different sites, which indicates that water flowed through the cavity network and that the interconnections between individual cavity conduits were not perfect. Flow through the cavity network is also evident from the daily variations in solute concentration; an analysis of these data showed that the variations in “subglacial flow” were in phase with those of the total discharge at this glacier (Reference Colbeck and DavidsonCollins, 1979). Dye tests (Reference LliboutryMoeri, unpublished) showed concentration maxima (not only maxima of the quantity of detected dye) at the terminus typically at the time of peak discharge, which implies that the relative amplitude of daily discharge variations was larger in the cavity network than in the terminal stream. In fact, branches of the cavity network seem to have been blocked off temporarily, so that the captured dye was released with the next peak of discharge (and of water pressure). The strong diurnal variations in the flow from the thin snow cover in the study area were not detectable in the pressure records, nor did the local streams cause significant differences in the spatial distribution of water pressure. These features demonstrate a characteristic of the cavity network; it offers only a small hydraulic resistance to small streams and adjusts quickly to a sudden increase in discharge by enhancing bed separation. We believe that the recorded pressure variations reflected mainly those which occurred in the larger streams carrying water from the upper part of the glacier. These variations were transferred by the cavity network to the bore holes.
The degree of interconnection within the cavity network is a function of water pressure. This function did not change noticeably in late May and June. In the study area, the drainage system at the southern margin was not interconnected with the main cavity network.
The larger subglacial streams cannot have had a much lower water pressure than the cavity network. According to the calculations, however, the water pressure in straight cylindrical channels with a constant discharge in the order of 0.1 m3/s is approximately atmospheric in the study area. No certain explanation for this discrepancy can be given. A possible solution to the problem is the assumption of a sufficient number of moderately sized meandering conduits partly attached to subglacial cavities. The streams in question would be large enough to melt fragmentary channels into the cavity roofs but too small to become detached from the cavities themselves. The actual properties and conditions of the basal ice may also be different from those assumed.
In the event of a sudden large water input into the glacier, presumably from a hidden reservoir, the subglacial drainage system could not adjust quickly enough to accommodate this flow. At the resulting high pressure, water was routed through the cavity network which included newly opened sheet-like spaces. Substantial storage slowed down the propagation of the wave of high water pressure; it passed through the study area with a velocity of approximately 100 m/h.
There was a functional relationship between water pressure and velocity of the glacier over a large pressure range. This is a consequence of the dominant role of the cavity mechanism. The functional relationship has been compared to that in a simple model: sliding over a perfectly lubricated sinusoidal bed under the action of water pressure at the ice sole. Assuming this model, an extrapolation of the plot of measured pressure against velocity yields a “separation pressure” of approximately 0 bar and a bed roughness of 0.02. This small value for the bed roughness agrees well with the visual appearance of the polished rock in front of the glacier, which was formerly covered by the glacier. Based on this value, however, the model predicts too high a value for the sliding velocity at the separation pressure and unstable sliding at quite a low subglacial water pressure. These unrealistic predictions are probably for the most part a consequence of the assumption of perfect lubrication. Actually, the friction at the glacier sole due to debris particles is substantial.
A remark is appropriate here on the validity of the picture of subglacial conditions outlined above. In order to reach conclusions, it was often necessary to generalize the results of measurements made at a very limited number of points and, furthermore, to decide sometimes what was typical or irregular. Thus, a certain amount of subjective judgement is included in the interpretations.
Acknowledgements
The investigations were made possible by a special grant (Reg. Nr. 12752/41-02 30.5) from the ETH research commission.
We wish to thank all who contributed to the field work: M. Aellen, A. Cornaz, C. Fierz, W. Haeberli, A. McNaught, E. Meier, P. Muller, H. Nauer, B. Nedela, B. Ott, F. Perraudin, W. Schmid, K. Steger, B. Vuaridel, P. Wehrli, and M. Wuilloud. Particular thanks are due to P. Gnos and H. Jenny, who participated for extended periods and operated the hot-water drill. P. Gnos also constructed special instrumentation and was responsible for a large part of the organization and for maintenance of the equipment.
W. Schmid established the complete survey network of fixed points and instrument stations. B. Ott made valuable contributions to the methods of field measurement of strain-rates. H.-P. Reference StenborgWächter determined the ice depth by radio–echo sounding.
The following institutes gave support with instrumentation: Institut für Geophysik ETH (micro-earthquake recorders). Geodätisches Institut ETH (Kern-DKM2A theodolite), Institut für Strassen-, Eisenbahn- und Felsbau ETH (wire strain-meter), N. Deichmann arranged for the evaluation of the seismic data. The power company Grande Dixence S.A. made available the records of discharge and air temperature, and also gave valuable logistic support on many occasions.
We are grateful to B. Kamb, H. Röthlisberger, W. Harrison, and C. Raymond for their interest in this study, and for several helpful discussions.
N. Deichmann, W. Haeberli, B. Kamb, and C. Raymond read parts of a preliminary draft of the manuscript and suggested important improvements. We are grateful to C. Raymond and H, Röthlisberger for their careful reviews of the final draft.
P. Alean revised the English of part of the manuscript. G. Zwosta typed the manuscript and B. Nedela prepared the illustrations.
MS. received 15 May 1985 and in revised form 21 October 1985
Appendix I
1. Determination of ike horizontal component of velocity of poles
Coordinates of poles were determined twice with an electronic distance meter. Short-term displacements of poles were calculated from angular displacements by multiplication by a constant factor. The latter was calculated from the displacement between the two points with known coordinates and the angle between these two positions. Accuracies of horizontal angles were estimated as one-half of the difference of an angle measured in the direct and in the reversed theodolite positions, or were estimated from repeated sets of measurements. The corresponding tolerances of velocities are shown in Figure 2a for the most distant pole, B4, where tolerances are largest.
2. Determination of the vertical component of velocity of poles
Vertical displacements were calculated from successive vertical angles and the distance between pole and theodolite (the lines of sight only differed slightly from the horizontal). Repeatedly measured vertical angles differed usually by less than 6 cc, which would correspond to differences in height of 2.3 mm, for a pole (e.g. pole C2) at a distance of 250 m. One would expect additional errors due to temperature-dependent variable refraction. However, the plots of vertical displacement versus time usually show almost straight lines (e.g. Fig 9, 25–28 May) in spite of marked diurnal variations of radiation and temperature (clear weather). This suggests that errors due to refraction did not vary significantly.
Appendix II
1. Selection of data concerning the relation of subglacial water pressure and sliding velocity
Points of the plot of velocity against depth of water level (Fig 6) have been selected according to the following conditions:
-
(a) The scatter of the depths of water levels in the different bore holes was not very large (less than 15 m).
-
(b) Water levels did not change quickly.
-
(c) Velocity variations were similar at profiles B, C, and D. This condition includes the fact that the second derivative of the velocity with respect to distance down-glacier did not vary significantly.
The two latter conditions require some explanation: ideally, the plot (Fig 6) should show the relation between the subglacial water pressure and velocity for steady-state subglacial cavities and for a fixed value of basal shear stress. This requirement is not fulfilled if, for instance, the water level rises quickly. In this case, subglacial cavities grow and the sliding velocity is greater than in the steady state (Reference IkenIken, 1981). Or, if ∂2 u/∂x 2 changes, the longitudinal gradient of the stress deviator also changes and hence the actual basal shear stress. (The latter is approximately given by

where h is the glacier thickness (assumed to vary only slightly with x, distance down-glacier), and  is the mean value of the x-component of the stress deviator averaged over the ice thickness.)
The dates and coordinates of the points in Figure 6 are given in Table III.

2. Examination of data with unsteady water levels
In Figure 6 those points which refer to situations where the water level was slightly unsteady, are marked with arrows. The arrows point towards locations in the diagram which the points should have, if the water levels, and the subglacial cavities, had been steady. Indeed, shifting the points in the direction of the arrows would somewhat reduce the scatter in Figure 6.
A more complete survey of the data with unsteady water levels does, however, reveal the following trends:
-
(a) If the water level drops, data points tend to be below the curve of Figure 6, as they should according to theory.
-
(b) If the water level rises, data points are, for the most part, also below the curve, in contrast to the theoretical prediction.
We interpret this result as a consequence of imperfect connections between cavities and the subglacial drainage system (not envisaged in the theory). The data suggest that the opening or obstruction of the connections as a function of water pressure occurred with a time lag.
Appendix III
Variations of Vertical Velocity as a Consequence of Water Storage and Vertical Straining of the Ice
The events of high subglacial water pressure were accompanied by an upward movement and subsequent downward movement of the ice. This uplift was largest on 29/30 May (Fig 9) when a wave of high water pressure travelled down-glacier concurrently with a wave of large horizontal velocity. One would have expected marked longitudinal compression in front of a wave of large velocity, and extension in its rear. In the following we attempt to analyse the movement of one pole, C2, during this event.
At the glacier surface the vertical velocity of the ice, dz/dt, is composed of three terms: sliding and flow over an inclined bed, vertical straining of the ice, and subglacial (or englacial) water storage.

or, equivalently

where
-
x = horizontal component of ice movement,
-
z = vertical component of ice movement,
-
u = horizontal component of the surface velocity (which is essentially due to sliding),
-
γ = bed slope,
-
= vertical strain-rate,
-
H = ice thickness, measured in the z-direction,
-
ds/dt = rate of water storage.
 = vertical strain-rate,
Among these variables ds/dt (or ds/dx) are not known and γ and  can only be estimated if certain assumptions are made. From the plot of z(x), the movement of pole C2 in a vertical plane (see Fig. 16), it is seen that the slope dz/dx is fairly uniform. A good estimate for the average value of dz/dx occurred during the period 3–6 June when daily velocities were close to the mean value for the season at C2 as well as at the neighbouring stake profiles. If it is further assumed that the change in stored water was negligible over this interval as well as over the entire period (15 May–16 June), then Equation (A-2) can be integrated:

Movement of pole C2 in a vertical plane through a flow line.
Heavy line: measured movement.
Thin lines: calculated from straining of the ice and flow over an inclined bed without water storage for various assumptions explained in the text.
— • — case 1.
— x — case 4.
o (a few unconnected points) cases 2 and 3.

Here u = 15.7 mm h−1 is the horizontal velocity component of pole C2 over the period 3–6 June, and H = 151m is the ice thickness at pole C2. The overbars indicate average values from 3 to 6 June. Two unknowns remain in Equation (A-3): γ and  . An approximate value of the bed slope Γ can be taken from the radio echo-sounding results, but a second approach is to calculate
 from the incompressibility relation:

A value for  can be obtained from the velocity measurements of poles B3 and D2 which were separated by 616 m roughly following a flow line. While the value does not necessarily equal the local value at C2, it is probably close and it does show similar variations over time:
 = − 2.83 × 10⁻⁶ h−1 (compressive).
By making an additional assumption about the character of the transverse flow,  Equation (A-4) can be expressed as a certain fraction, K, of
 and
 = R
 = −(1 + k)
 .
Some of the possible assumptions are listed below:
Assumption 1. Unrestricted lateral expansion of the ice, that is, no effect from valley walls and a perfectly lubricated bed; 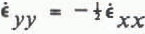 . Then R = −0.5 and γ −4.8°.
Assumption 2. Vertical and parallel valley walls;  . Then R = −1 and γ = −5.5°.
Assumption 3. Vertical but converging valley walls;

Here W is the width of the valley and u
w the mean velocity in the considered cross-section. Numerical values are W = 645 m, ΔW/Δx = 0.22 (mean value Over 365 m) and u
w ≈ u(C2) = 15.7 mm h−1. This gives  = −5.35 × 10⁻⁶ h−1, R = −2.9, and γ = −8.4°.
Assumption 4. γ = −11 ° (from radio echo-sounding). Then R = −4.8; this is a rather unlikely condition because it means that the lateral compression of the ice is considerably larger than the longitudinal compression.
Accepting one of these assumptions, the vertical movement of pole C2 can be calculated by integrating Equation (A-2). This gives:

The integration begins on 25 May when x = x = x 0 s(x 0) is assumed to be negligible; z(x 0) is equal to the elevation of pole C2 at this time. The plot of z(x) − s(x) for each case detailed above, when compared with the measured z(x) gives a measure of s(x), the amount of stored water (see Fig 16). In all cases the calculations suggest that at least 0.1 m of water was stored on 30 May. In cases 1 through 3, water was stored at a large rate between 19.00 h on 29 May and 07.40 h on 30 May. Water was released from storage after 07.40 h. On the other hand, if case 4 is valid, water storage increased until 12.00 h on 30 May. This is an unlikely occurrence since the largest amount of water was observed to have already exited from the glacier at the southern margin before 08.00 h.



