


1. Introduction
Fluidization has been widely found in many industrial processes such as water and wastewater treatment and chemical synthesis. In these processes, one of the key operating parameters is the flow rate, which in turn controls the porosity to achieve efficient mixing and mass transfer. Depending on the processes, the optimal operating parameter can vary significantly. By gaining a detailed understanding of the particle dynamics in the fluidized bed, system optimization would be possible. Using wastewater treatment as an illustrative example, the staged anaerobic fluidized-bed membrane bioreactor (known as SAF-MBR) was recently proposed to reduce energy demand (Shin et al. Reference Shin, Lee, McCarty and Bae2011; Shin, Bae & McCarty Reference Shin, Bae and McCarty2012; Shin et al. Reference Shin, McCarty, Kim and Bae2014) in which granular activated carbon (known as GAC) particles are fluidized to both maximize biological degradation rate through maximizing the growth of biofilm and minimize membrane fouling through particle collisions. Both objectives can be optimized by choosing the optimal flow rate which in turn controls the porosity. In addition to operation, elucidating the particle dynamics in a fluidized bed can provide information to model biofilm detachment rates. Important biofilm detachment mechanisms include shear stress from fluid–particle interactions and abrasion from particle–particle interactions (Nicolella, Di Felice & Rovatti Reference Nicolella, Di Felice and Rovatti1996; Nicolella et al. Reference Nicolella, Chiarle, Di Felice and Rovatti1997; Rittmann & McCarty Reference Rittmann and McCarty2018). However, the proposed models either fail to decouple the effect of shear stress from abrasion or only consider abrasion effects (Chang et al. Reference Chang, Rittmann, Amar, Heim, Ehlinger and Lesty1991; Gjaltema et al. Reference Gjaltema, Vinke, van Loosdrecht and Heijnen1997; Nicolella et al. Reference Nicolella, Chiarle, Di Felice and Rovatti1997). Without a thorough understanding of the particle dynamics, especially the competition between abrasion and hydrodynamic effects in the fluidized bed, optimizing operating parameters for efficient mixing and modelling biofilm detachment remains an elusive problem.
In the past few decades, many researchers have studied the hydrodynamics of fluidized-bed reactors (Zenit, Hunt & Brennen Reference Zenit, Hunt and Brennen1997; Di Felice Reference Di Felice1999; Duru et al. Reference Duru, Nicolas, Hinch and Guazzelli2002; Derksen & Sundaresan Reference Derksen and Sundaresan2007; Verma et al. Reference Verma, Padding, Deen and Kuipers2014, Reference Verma, Padding, Deen and Hans Kuipers2015; Yang et al. Reference Yang, Yu, Liu, Zheng, Zheng, Wei, Wang and Fan2017; Lu, Peters & Kuipers Reference Lu, Peters and Kuipers2020; Shajahan & Breugem Reference Shajahan and Breugem2020). In general, fluidized beds are classified into two different categories as either aggregative or particulate (Geldart Reference Geldart1973). The behaviour of fluidized beds can be further classified based on the Froude number  $Fr_m = u_{mf}^2/(g d_p)$, where
 $u_{mf}$ is the minimum fluidization velocity,
 $g$ is the gravitational acceleration and
 $d_p$ is the particle diameter (Sundaresan Reference Sundaresan2003). For
 $Fr_m \sim O(10^{-3})$, no bubbles are observed. For
 $Fr_{m} \sim O(10^{-2})$, bubbles appear intermittently. For
 $Fr_{m} \sim O(10^{-1})$, bubble-like voids persist. In wastewater treatment,
 $Fr_{m} \sim O(10^{-3})$ is generally assumed based on the particles used (Shin et al. Reference Shin, McCarty, Kim and Bae2014). Zenit et al. (Reference Zenit, Hunt and Brennen1997) measured the particle pressure (collision stress) for particles with different properties over a range of volume fractions and showed that the particle pressure initially increases with decreasing volume fraction when the volume fraction is large and then decreases with further decreasing volume fraction, an effect that was also demonstrated by Derksen & Sundaresan (Reference Derksen and Sundaresan2007). Since particle pressure measures the effect of collisions, it can be used to quantify abrasion that leads to biofilm detachment. Although they did not directly quantify hydrodynamic stresses, Derksen & Sundaresan (Reference Derksen and Sundaresan2007) attempted to evaluate the importance of particle streaming stress which is a measure of the hydrodynamic pressure induced by particle velocity fluctuations. Yao, Criddle & Fringer (Reference Yao, Criddle and Fringer2021b) studied the effect of Archimedes number in concentrated suspensions and discovered that low Archimedes number suspensions result in long-lived particle clusters while high Archimedes number suspensions mainly consist of short-lived particle clusters.
To elucidate the effect of porosity on particle dynamics in the anaerobic fluidized bed reactor (known as AFBR), we study the fluid–particle and particle–particle interactions in a fluidized bed with the Eulerian–Lagrangian (EL) method. The EL methods solve for the dynamics of individual particles and compute the Eulerian flow–discrete particle and particle–particle interactions with different collision models (Yu & Xu Reference Yu and Xu2003; Akiki, Jackson & Balachandar Reference Akiki, Jackson and Balachandar2016; Costa et al. Reference Costa, Boersma, Westerweel and Breugem2015; Biegert, Vowinckel & Meiburg Reference Biegert, Vowinckel and Meiburg2017). The EL methods can be further classified into two subcategories: (i) volume-averaged computational fluid dynamics–discrete element methods (CFD-DEM) and (ii) particle-resolved simulations (PRS). The CFD-DEM method employs various closure laws to model the momentum transfer between the discrete particles and the fluid (Yu & Xu Reference Yu and Xu2003; Pan et al. Reference Pan, Chen, Liang, Zhu and Luo2016). One advantage of CFD-DEM is its ability to simulate millions of particles, as in the study of the macroscopic behaviour of particle-laden flows leading to clustering (Akiki, Jackson & Balachandar Reference Akiki, Jackson and Balachandar2017a; Akiki, Moore & Balachandar Reference Akiki, Moore and Balachandar2017b). However, there is no consensus on the most appropriate closure laws to parameterize the fluid–particle interactions (Yin & Koch Reference Yin and Koch2007; Tenneti, Garg & Subramaniam Reference Tenneti, Garg and Subramaniam2011). Another disadvantage is that the Eulerian fields are volume averaged which precludes statistical analysis of motions related to detailed fluid–particle interactions.
Because of the need for closure laws in CFD-DEM, it cannot be used to study the detailed physics of fluid–particle and particle–particle interactions in an anaerobic fluidized bed reactor. Therefore, we employ the PRS approach which can be thought of as the limiting case of the CFD-DEM method in which the Eulerian flow is computed on a grid in which many (15–30) grid cells resolve the smallest particle diameter to simulate all of the spatiotemporal scales related to the flow–particle interactions (Lee & Balachandar Reference Lee and Balachandar2010; Lee, Ha & Balachandar Reference Lee, Ha and Balachandar2011; Esteghamatian et al. Reference Esteghamatian, Hammouti, Lance and Wachs2017). As a result, the Eulerian quantities are no longer volume-averaged over many particles, which allows for a direct quantification of particle dynamics in systems like fluidized-bed reactors. Three popular approaches used to study particle-laden flows are the PHYSALIS method (Zhang & Prosperetti Reference Zhang and Prosperetti2005), the immersed boundary method (IBM) and the lattice Boltzmann (known as LB) technique with comparable accuracy (Finn & Apte Reference Finn and Apte2013). Recently, the PRS approach with IBM has been widely applied to a number of different problems, including extracting drag laws from arrays of particles (Tenneti et al. Reference Tenneti, Garg and Subramaniam2011; Tang et al. Reference Tang, Peters, Kuipers, Kriebitzsch and van der Hoef2015; Akiki et al. Reference Akiki, Moore and Balachandar2017b) and understanding the detailed physics of flow–particle interactions in fluidized beds and particle suspensions (Yin & Koch Reference Yin and Koch2007; Kriebitzsch, van der Hoef & Kuipers Reference Kriebitzsch, van der Hoef and Kuipers2013; Uhlmann & Doychev Reference Uhlmann and Doychev2014; Zaidi, Tsuji & Tanaka Reference Zaidi, Tsuji and Tanaka2015; Esteghamatian et al. Reference Esteghamatian, Hammouti, Lance and Wachs2017; Ozel et al. Reference Ozel, Brändle de Motta, Abbas, Fede, Masbernat, Vincent, Estivalezes and Simonin2017; Willen & Prosperetti Reference Willen and Prosperetti2019).
In this paper, we present PRS results of a fluidized bed reactor to gain a detailed understanding of the effects of varying upflow velocity on the particle dynamics. A series of cases with different particle Reynolds numbers is studied and the simulation results are used to (1) understand the equilibrium behaviour of particle fluctuations, (2) establish links between particle velocity fluctuations, forces on particles and flow–particle microstructure and (3) identify various flow regimes and momentum transfer mechanisms as a function of the particle Reynolds number.
2. Numerical methodology
2.1. Equations and discretizations
The governing Navier–Stokes equations are solved in a three-dimensional flow reactor with a square cross-section and with an array of uniform spherical particles. Direct forcing by the IBM method is accounted for with a source term,  $\boldsymbol {f}_{IBM}$, which is added to the Navier–Stokes equation and enforces no-slip boundary conditions on the particle surfaces. With this forcing, the incompressible Navier–Stokes equation we solve is given by
 \begin{equation} \frac{\partial \boldsymbol{u}}{\partial t} + \boldsymbol{u} \boldsymbol{\cdot} \boldsymbol{\nabla}{\boldsymbol{u}} ={-}\boldsymbol{\nabla}{p} + \nu \nabla^2{\boldsymbol{u}} + \boldsymbol{f}_{IBM}, \end{equation}
subject to continuity,  $\boldsymbol {\nabla }\boldsymbol {\cdot }{\boldsymbol {u}} = 0$, where
 $\boldsymbol {u}$ is the velocity vector and
 $p$ is the pressure normalized by the fluid density,
 $\rho _f$. These equations are discretized on a uniform collocated Cartesian grid and momentum and pressure are coupled with the fractional step method (Zang, Street & Koseff Reference Zang, Street and Koseff1994). The advection term is discretized with the explicit, three-step Runge–Kutta schemes described in Rai & Moin (Reference Rai and Moin1991). The viscous term is discretized with the implicit Crank–Nicolson scheme to eliminate the associated stability constraints.
The IBM formulation employs the direct forcing approach first proposed by Uhlmann (Reference Uhlmann2005) and improved by Kempe & Fröhlich (Reference Kempe and Fröhlich2012a). This approach represents the particle using  $N_L$ Lagrangian markers with volume
 $\Delta {V}_L\approx \Delta {V}_E$, where
 $\Delta {V}_L$ is the Lagrangian marker volume and
 $\Delta {V}_E$ is the volume of each Eulerian grid cell. At each time step, the IBM force,
 $\boldsymbol {f}_{IBM}$, is calculated as the force required to enforce the difference between the desired velocity
 ${\boldsymbol u}_d$ at the particle surface and the interpolated velocity from the Eulerian grid. The desired velocity at the particle surface is calculated as the sum of a translational (
 ${\boldsymbol u}_p$) and a rotational components based on the particle angular velocity vector
 ${\boldsymbol \omega }_p$ with
 ${\boldsymbol u}_d = {\boldsymbol u}_p + {\boldsymbol \omega }_p\times {\boldsymbol r}$, where
 ${\boldsymbol r}$ is the vector pointing from the particle centre of mass to the Lagrangian point. The translational and angular velocities of the particle are then governed by
 $$\begin{gather} m_p \frac{\mathrm{d} \boldsymbol{u}_p}{\mathrm{d} t} = \rho_f\left[\frac{\mathrm{d} }{\mathrm{d} t}\int_{\varOmega_p} \boldsymbol{u} \, {\rm d} \varOmega_p - \int_{S} \boldsymbol{f}_{IBM} \, {\rm d} S \right] + V_p(\rho_p - \rho_f)\boldsymbol{g} + \boldsymbol{F}_{c,p}, \end{gather}$$
 $$\begin{gather}I_p \frac{\mathrm{d} \boldsymbol{\boldsymbol{\omega}}_p}{\mathrm{d} t} = \rho_f\left[\frac{\mathrm{d} }{\mathrm{d} t}\int_{\varOmega_p} \boldsymbol{r} \times \boldsymbol{u} \, {\rm d} \varOmega_p - \int_{S} \boldsymbol{r} \times \boldsymbol{f}_{IBM} \, {\rm d} S \right] + \boldsymbol{T}_{c,p}, \end{gather}$$
where the integrals are calculated over the discrete volumes associated with the Lagrangian points given by the surface  $S$ and region
 $\varOmega _p$, where
 $m_p$ is the mass of the particle,
 $\boldsymbol {g}$ is the gravitational acceleration vector which points in the negative
 $z$-direction,
 $V_p$ is the volume of the particle,
 $\rho _p$ is the particle density,
 $\boldsymbol {F}_{c,p}$ and
 $\boldsymbol {T}_{c,p}$ are the force and torque due to particle–particle and particle–wall interactions and
 $I_p$ is the moment of inertia of the particle. For a description of each term in (2.2), please refer to the papers by Uhlmann (Reference Uhlmann2005) and Kempe & Fröhlich (Reference Kempe and Fröhlich2012a). Interpolation of variables between the Lagrangian and Eulerian grid employs the discrete delta function kernel proposed by Peskin (Reference Peskin1977) and Roma, Peskin & Berger (Reference Roma, Peskin and Berger1999).
The original direct forcing approach proposed by Uhlmann (Reference Uhlmann2005) has two disadvantages: (1) the rigid-body approximation used to approximate the volume integral,  $(\textrm {d}/\textrm {d}t)\int _{\varOmega _p} \rho _f \boldsymbol {u} \, {\rm d} \varOmega _p$ in (2.2) introduces a singularity at density ratio of
 $\rho _p/\rho _f=1$ and stability limit of
 $\rho _p/\rho _f \approx 1.2$ (Uhlmann Reference Uhlmann2005; Kempe & Fröhlich Reference Kempe and Fröhlich2012a); and (2) the explicit calculation of
 $\boldsymbol {f}_{IBM}$ leads to error that is inversely proportional to
 $Re_p$ and cannot be eliminated by refining the time step (Kempe & Fröhlich Reference Kempe and Fröhlich2012a). The restriction associated with the rigid-body approximation is eliminated by introducing the numerical level-set approximation of the volume integral in (2.2) instead of applying the rigid-body approximation. The error associated with
 $\boldsymbol {f}_{IBM}$ is reduced by applying a heuristic number of outer forcing loops (Wang, Fan & Luo Reference Wang, Fan and Luo2008; Kempe & Fröhlich Reference Kempe and Fröhlich2012a). In each outer forcing loop, the Eulerian velocity field is interpolated between the Eulerian and Lagrangian grid and updated with the newly calculated
 $\boldsymbol {f}_{IBM}$ to satisfy the no-slip boundary condition at the particle surface. Details can be found in the paper by Kempe & Fröhlich (Reference Kempe and Fröhlich2012a), who recommended three outer forcing loops while Biegert et al. (Reference Biegert, Vowinckel and Meiburg2017) recommended one loop based on various validation cases. After validating with different cases, two outer forcing loops were used for the simulations in this study.
To model the forces associated with particle–particle and particle–wall interactions, the total force and torque on particle  $p$ due to interaction with
 $q=1,2,\ldots ,N_p$ particles and a wall
 $w$ are computed with
 $$\begin{gather} \boldsymbol{F}_{c,p} = \sum_{p, q \ne p}^{N_p} (\boldsymbol{F}_{n,q} + \boldsymbol{F}_{t,q}) + \boldsymbol{F}_{n,w} + \boldsymbol{F}_{t,w}, \end{gather}$$
 $$\begin{gather}\boldsymbol{T}_{c,p} = \sum_{p, q \ne p}^{N_p} R_{p,cp} \boldsymbol{n}_{p,q} \times \boldsymbol{F}_{t,q} + R_{p,cp} \boldsymbol{n}_{p,w} \times \boldsymbol{F}_{t,w}, \end{gather}$$
where  $\boldsymbol {F}_{n,q}$ and
 $\boldsymbol {F}_{t,q}$ are the normal and tangential collision forces between particle
 $p$ and
 $q$;
 $\boldsymbol {F}_{n,w}$ and
 $\boldsymbol {F}_{t,w}$ are the normal and tangential collision forces between particle
 $p$ and a wall;
 $R_{p,cp}$ is the effective radius between particle
 $p$ and
 $q$;
 $\boldsymbol {n}_{p,q}$ is the vector normal to the plane of contact between particles
 $p$ and
 $q$;
 $\boldsymbol {n}_{p,w}$ is the vector normal to the wall at the point of contact with particle
 $q$. Normal collision forces
 $\boldsymbol {F}_{n,q}$ consist of contributions from both lubrication and contact based on the separation distance between the particles (Biegert et al. Reference Biegert, Vowinckel and Meiburg2017). Collision models usually have high stiffness in which the collision time step size is much smaller than the fluid time step size. To avoid this, we follow the approach by Biegert et al. (Reference Biegert, Vowinckel and Meiburg2017) who employ the collision model proposed by Kempe & Fröhlich (Reference Kempe and Fröhlich2012b).
The code we employ for the simulations in this paper is based on the code developed by Dr Hyungoo Lee and Dr Sivaramakrishnan Balachandar, who employed IBM with the direct forcing approach by Uhlmann (Reference Uhlmann2005) to simulate the near-wall motion of an isolated particle (Lee & Balachandar Reference Lee and Balachandar2010; Lee et al. Reference Lee, Ha and Balachandar2011). We modified their code following improvements to the IBM method suggested by Kempe & Fröhlich (Reference Kempe and Fröhlich2012a) and Biegert et al. (Reference Biegert, Vowinckel and Meiburg2017) as follows. To improve the accuracy of computing fluid–solid interactions, the following modifications were made: (1) a three-step Runge–Kutta time-stepping scheme instead of third-order Adams–Bashforth for the advection terms in (2.1); (2) outer forcing loops to reduce the error associated with explicit calculation of the forcing in the IBM method (Kempe & Fröhlich Reference Kempe and Fröhlich2012a); (3) higher-order schemes with predictor and corrector steps to discretize the particle motion equations (2.2) (Biegert et al. Reference Biegert, Vowinckel and Meiburg2017). Because the original code was not designed to simulate particle–particle interactions, collision models based on Kempe & Fröhlich (Reference Kempe and Fröhlich2012b) and Biegert et al. (Reference Biegert, Vowinckel and Meiburg2017) were implemented. Finally, computational performance was made efficient by (1) using appropriate MPI (Open MPI-3.0) structures to transfer Lagrangian and Eulerian information related to particle–particle collisions at interprocessor boundaries and (2) employing HYPRE libraries developed at the Lawrence Livermore National Laboratory (Chow, Cleary & Falgout Reference Chow, Cleary and Falgout1998; Falgout Reference Falgout2006) to solve the linear systems associated with implicit discretization of the viscous terms and the pressure-Poisson equation.
3. Fluidized bed simulation set-up
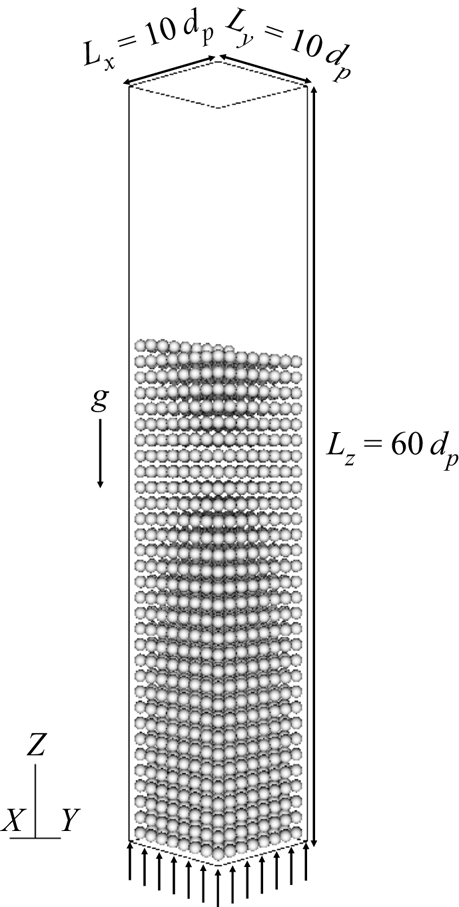
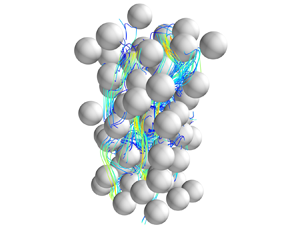
To simulate the fluidized bed, three-dimensional simulations are conducted with  $N_p=2000$ particles in the reactor channel shown in figure 1. The particles have a uniform diameter
 $d_p=2$ mm and density
 $\rho _p=1300$ kg m
 $^{-3}$, and the fluid has a kinematic viscosity
 $\nu =10^{-6}$ m
 $^2$ s
 $^{-1}$ and density
 $\rho _f=998.21$ kg m
 $^{-3}$, resulting in Archimedes number
 $Ar=23\,600$ (Galileo number
 $Ga = 154$) that is defined as
 \begin{equation} Ar = Ga^2 = \dfrac{g(s-1)d_p^3}{\nu^2}, \end{equation}
where  $s = \rho _p/\rho _f$ is the ratio of particle to fluid density. The particle collisions have a dry restitution coefficient
 $e_{dry}=0.97$ (Foerster et al. Reference Foerster, Louge, Chang and Allia1994; Joseph et al. Reference Joseph, Zenit, Hunt and Rosenwinkel2001), coefficient of kinetic friction
 $\mu _k=0.15$ (Joseph & Hunt Reference Joseph and Hunt2004) and coefficient of static friction
 $\mu _s=0.8$ (Dieterich Reference Dieterich1972). The grid spacing is uniform in the
 $x$,
 $y$ and
 $z$ directions and given by
 $\Delta x= \Delta y = \Delta z=h=d_p/25.6$, which is sufficient to resolve the flow–particle interactions (Biegert Reference Biegert2018; Kempe & Fröhlich Reference Kempe and Fröhlich2012a). The channel width is given by
 $L_x = L_y = 10 d_p$ and its length is
 $L_z = 60 d_p$, giving a three-dimensional grid with
 $256\times 256\times 1536$ grid points. The time step size is
 $\Delta {t}=1.5\times 10^{-4}$ s, resulting in a maximum Courant number of
 $0.5$ for the cases with the highest upflow velocities.
The three-dimensional computational domain, showing the fluidized bed, the uniform inflow velocity profile and the initial particle positions.

The primary parameter of interest is the particle Reynolds number  $Re_p = u_0 d_p/\nu$, where the average upflow velocity at the inlet,
 $u_0$, is varied to investigate Reynolds number effects. Cases are run with periodicity in the
 $x$ and
 $y$ directions. A total of six simulations were conducted with
 $0.010\le u_0\le 0.035$ m s
 $^{-1}$, giving
 $20 \le Re_p \le 70$. For all cases, the pressure is specified at the top boundary as
 $p=0$, while at the bottom boundary the inflow velocity is specified as uniform and given by
 $w(x,y)=u_0$.
Simulations are initialized with a uniform distribution of particles with a spacing of  $1 d_p$ and the flow is impulsively started from rest. The upflow velocity leads to expansion of the bed and random motion of the particles until statistical equilibrium is reached, at which time the dynamics are independent of the initial particle distribution.
4. Results and discussion
4.1. Instantaneous and time-average porosity
To understand the time evolution of the particles, we define the ensemble-average instantaneous vertical velocity of particles using the ensemble-average
 \begin{equation} \langle \langle \{{\cdot}\} \rangle \rangle = \dfrac{1}{N_p} \sum_{i=1}^{N_p} \{{\cdot}\}_i, \end{equation}
where  $\{\cdot \}_i$ corresponds to the variable of particle
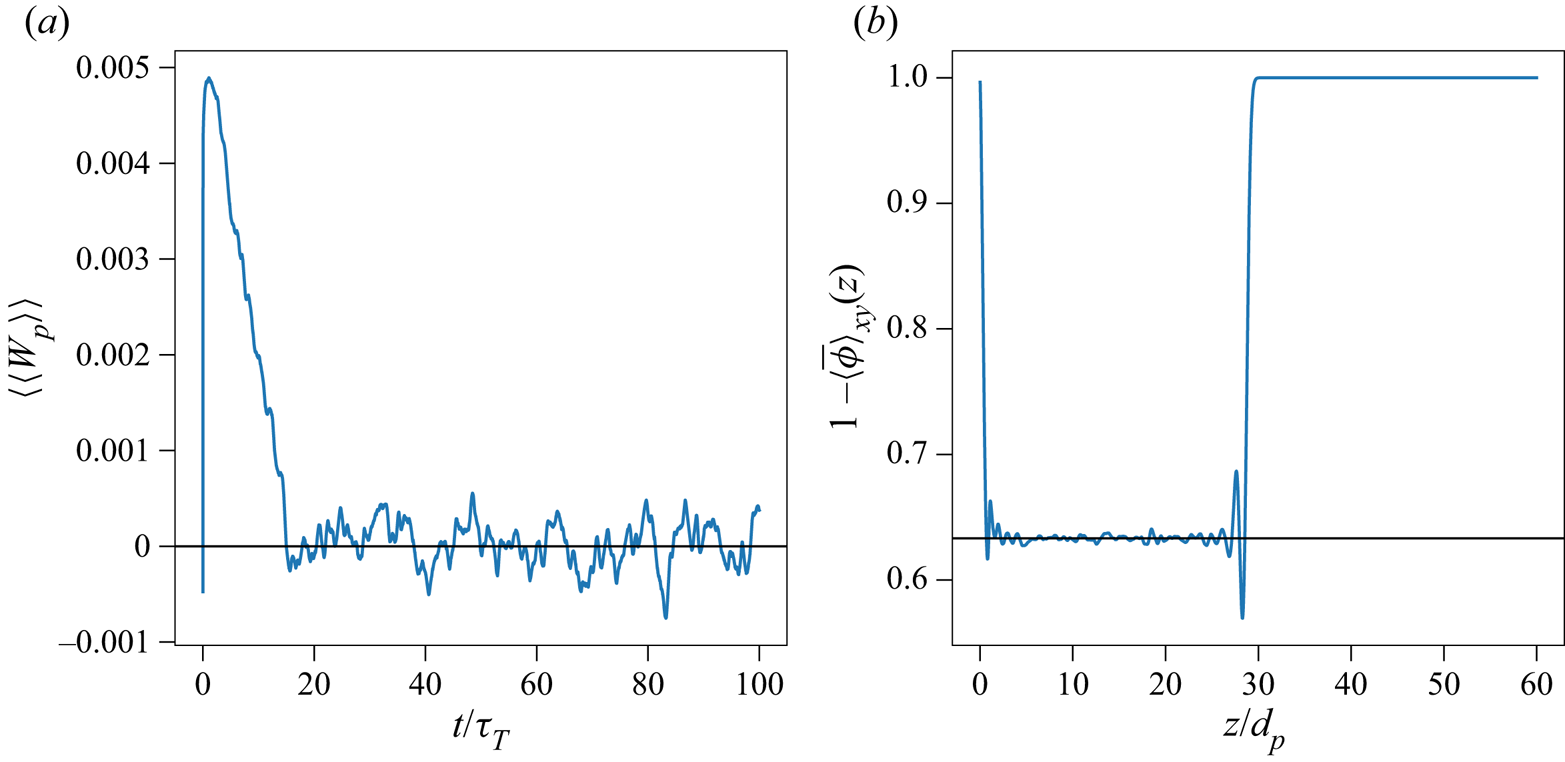
 $i$. As shown in figure 2(a), the ensemble-averaged instantaneous vertical velocity of particles
 $\langle \langle w_{p} \rangle \rangle$ initially increases with time as the bed expands because the average drag force on the particles exceeds their submerged weight. Eventually, the average drag is in balance with the submerged weight, leading to statistical equilibrium. Defining the particle turnover time as
 $\tau _T=d_p/u_0$, simulations are run for
 $t_{max}=100 - 300\tau _T$, depending on
 $Re_p$, to ensure statistically stationary results. Time-averaged statistics are denoted by the overbar and computed over the last 80 turnover times, such that
 \begin{equation} \overline{\{{\cdot} \}}=\frac{1}{80\tau_T}\int_{t_0}^{t_{max}}\{{\cdot} \}\,{\rm d} t, \end{equation}
where  $t_0=t_{max}-80\tau _T$. Unless otherwise stated, the time-averaging operator has been applied to compute statistically stationary quantities.
(a) Time series of the ensemble-average instantaneous vertical particle velocity  $\langle \langle w_p \rangle \rangle$ showing how statistical equilibrium is reached at roughly
 $t=20\tau _T$, where
 $\tau _T=d_p/u_0$ is the particle turnover time and (b) vertical variation of time-average porosity
 $1 - \langle \overline {\phi } \rangle _{xy}$ showing the effects of boundary conditions on the bottom and top of the fluidized bed for the case with
 $Re_p = 40$.

In the simulations, the porosity decreases from unity at the inlet, remains relatively constant and then increases to unity at the top of the fluidized bed. Therefore, a spatially variable porosity is expected as compared to the homogeneous porosity in a fluidized bed away from boundaries. Including results from these two regions (top and bottom) would affect the accuracy and convergence of statistical quantities. To determine the region of homogeneous porosity, we define the instantaneous Eulerian volume fraction of the bed,  $\phi (\boldsymbol {x},t)$ and compute the horizontally averaged (
 $x$- and
 $y$-directions) Eulerian volume fraction of the bed,
 $\langle \overline {\phi } \rangle _{xy}(z,t)$ as described in Appendix A. Figure 2(b) shows the time-averaged porosity
 $1-\langle \overline {\phi } \rangle _{xy}$ as a function of the vertical position
 $z/d_p$ for
 $Re_p=40$. The time-averaged porosity decreases to
 $0.63$ away from the inlet and then increases to
 $1$ at the top of the fluidized bed. To eliminate boundary effects, we define the modified spatial average for fluid variables as
 $$\begin{gather} \langle\{{\cdot} \} \rangle_\beta = \frac{1}{N_\beta} \sum_{i=1}^{N_\beta} \{{\cdot} \}_{ijk}, \end{gather}$$
 $$\begin{gather}\langle\{{\cdot} \} \rangle_z = \frac{1}{N_z^*} \sum_{k=k_s}^{k_e} \{{\cdot} \}_{ijk}, \end{gather}$$
 $$\begin{gather}\langle\{{\cdot} \} \rangle = \frac{1}{N_xN_yN_z^*} \sum_{i,j=1}^{N_x,N_y} \sum_{k=k_s}^{k_e} \{{\cdot} \}_{ijk}, \end{gather}$$
where  $\beta = x$ or
 $y$ represents the horizontal directions,
 $k_s = z_{b}/h$ and
 $k_e = z_{t}/h$ are the nearest integer of the bottom and top of the fluidized-bed and
 $z_b$ and
 $z_t$ are the vertical position of the bottom and top of the homogeneous fluidized bed, respectively. The modified ensemble-average operator for particle variables is then defined as
 \begin{equation} \langle\{{\cdot} \} \rangle = \frac{1}{N_p^*} \sum_{i=1}^{N_p} \{{\cdot} \}_i\boldsymbol{1}_{z_{b} < z_p < z_{t}}(z_p), \end{equation}
where  $N_p^* = \sum _{n=1}^{N_p} \boldsymbol {1}_{z_{b} < z_p < z_{t}}(z_p)$ is the number of particles that are located within the homogeneous fluidized bed, and
 \begin{equation} \boldsymbol{1}_{z_{b} < z_p < z_{t}}(z_p) = \begin{cases} 1, & z_b < z_p < z_t, \\ 0, & \text{otherwise}, \end{cases} \end{equation}
is the indicator function that describes whether particles are located in the spatially homogeneous region of the fluidized bed.
The relationship between the upflow velocity and volume fraction of particles has been studied extensively (Richardson & Zaki Reference Richardson and Zaki1954; Garside & Al-Dibouni Reference Garside and Al-Dibouni1977; Di Felice Reference Di Felice1995; Nicolai et al. Reference Nicolai, Herzhaft, Hinch, Oger and Guazzelli1995; Di Felice & Parodi Reference Di Felice and Parodi1996; Di Felice Reference Di Felice1999; Yin & Koch Reference Yin and Koch2007; Hamid, Molina & Yamamoto Reference Hamid, Molina and Yamamoto2014; Zaidi et al. Reference Zaidi, Tsuji and Tanaka2015; Willen & Prosperetti Reference Willen and Prosperetti2019) and is typically described by the power law relationship
 \begin{equation} u^* = \frac{u_0}{w_{ref}} = k(1-\langle \overline{\phi} \rangle)^n, \end{equation}
where  $w_{ref}$ is the settling velocity of a single particle in the domain of interest,
 $k$ is a low volume fraction correction (Di Felice Reference Di Felice1995, Reference Di Felice1999; Di Felice & Parodi Reference Di Felice and Parodi1996; Yin & Koch Reference Yin and Koch2007) and
 $n$ is the expansion or power law exponent. The settling velocity of a single particle in an infinitely large domain,
 $w_{ref}$, is computed with (Yin & Koch Reference Yin and Koch2007)
 \begin{equation} Ar = \begin{cases} 18 Re_t \left[ 1 + 0.1315 Re_t^{(0.82-0.05\log_{10}Re_t)}\right], & 0.01 < Re_t < 20 ,\\ 18 Re_t \left[ 1 + 0.1935 Re_t^{0.6305}\right], & 20 < Re_t < 260 , \end{cases} \end{equation}
where  $Re_t = w_{ref} d_p/ \nu$ and
 $Ar=(\rho _p/\rho _f -1)gd_p^3/\nu ^2$ is the Archimedes number. In this work,
 $Ar = 2.36\times 10^{4}$ giving
 $Re_t \approx 200$ which is within the range of (4.9). The error of (4.9) has been shown to range from 2 % to 4 % (Yin & Koch Reference Yin and Koch2007; Willen & Prosperetti Reference Willen and Prosperetti2019). Fitting our results to (4.8) yields values of
 $k=0.72$ and
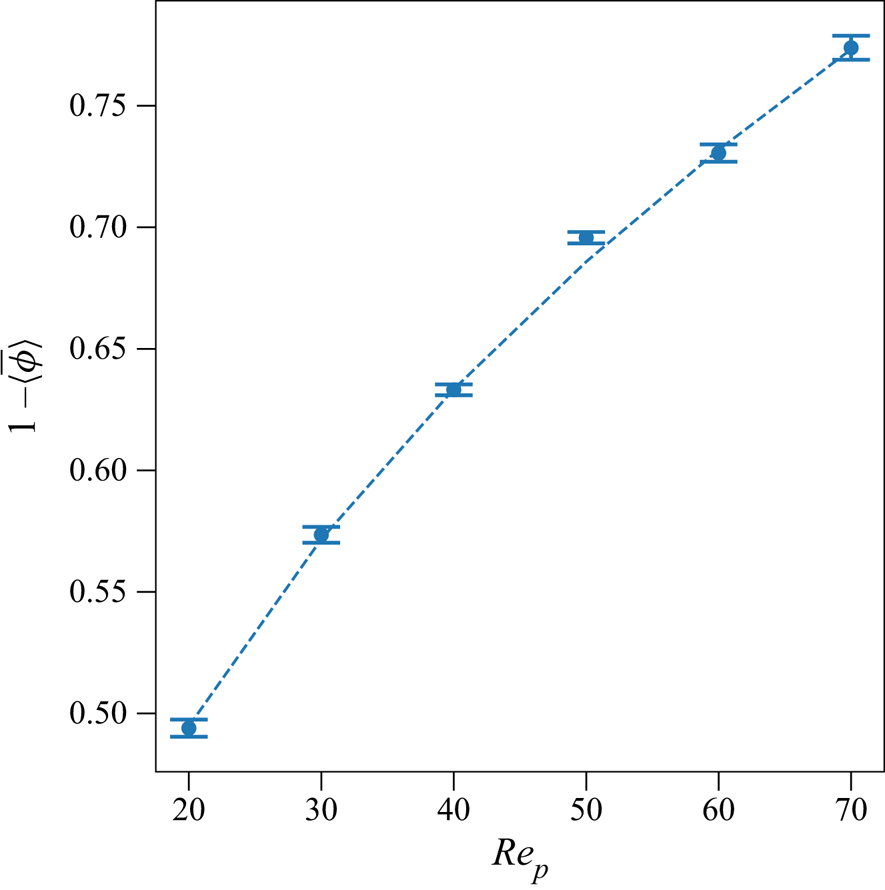
 $n=2.82$ that are consistent with published values (Yin & Koch Reference Yin and Koch2007; Willen & Prosperetti Reference Willen and Prosperetti2019). In this paper we focus on the relationship between the porosity
 $1-\langle \overline {\phi } \rangle$ and
 $Re_p$ shown in figure 3, which also includes the power-law fits and shows that the porosity increases with increasing
 $Re_p$.
Porosity  $1-\langle \overline {\phi } \rangle$ as a function of
 $Re_p$ for the simulated cases. The dashed lines were constructed based on fitting to the power law equation (4.8).

4.2. Kinematic wave speed
As discussed by many researchers (Ham & Homsy Reference Ham and Homsy1988; Duru et al. Reference Duru, Nicolas, Hinch and Guazzelli2002; Sundaresan Reference Sundaresan2003; Derksen & Sundaresan Reference Derksen and Sundaresan2007), as  $Re_p$ increases above
 $Re_{mf} = u_{mf}d_p/\nu$ where
 $Re_{mf}$ is the minimum fluidization Reynolds number, particles start to expand and upward-propagating waves can be observed. Below an intermediate
 $Re_p$, stable and neutral wave modes exist in which the amplitude of the waves decreases and remains approximately constant. For larger
 $Re_p$, unstable wave modes develop in which the wave amplitude grows with height, leading to large fluctuations in porosity. Zenit & Hunt (Reference Zenit and Hunt2000) investigated the time evolution of the ensemble- and time-averaged porosity
 $1-\langle \overline {\phi } \rangle$ and concluded that large-amplitude, low-frequency fluctuations dominated at low porosity (high volume fraction
 $\phi > 0.3$) and small-amplitude, high-frequency fluctuations dominated at high porosity (low volume fraction
 $\phi < 0.3$).
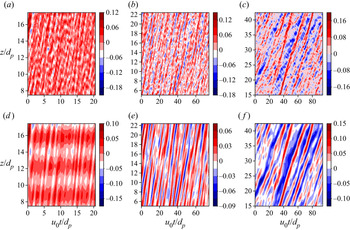
Figure 4(a–c) show two-dimensional  $z$–
 $t$ plots of the volume fraction fluctuation
 $\langle \phi \rangle _{xy}^\prime = \langle \phi \rangle _{xy} - \langle \overline {\phi } \rangle _{xy}$. Waves can be identified visually but are difficult to quantify due to the presence of noise and superposition of waves with different modes. Researchers have reported that
 $\langle \phi \rangle _{xy}^\prime$ can be classified based on frequencies (Zenit & Hunt Reference Zenit and Hunt2000) or wavenumber (Willen et al. Reference Willen, Sierakowski, Zhou and Prosperetti2017). To separate low-wavenumber waves from the raw data, we modified the Fourier reconstruction method proposed by Willen et al. (Reference Willen, Sierakowski, Zhou and Prosperetti2017) by defining low-wavenumber fluctuations for
 $k_z < k_{z,thresh}$, where
 $k_{z,thresh}= (z_t - z_b)/2d_p$ is the threshold wavenumber. Since the behaviour of small spatial-scale fluctuations (
 $k_z \ge k_{z,thresh}$) is an artefact of the spatial averaging, therefore, this study only focuses on the large-scale fluctuations (
 $k_z < k_{z,thresh}$) which allow interpretation of kinematic wave behaviour. Figure 4(d–f) show the low-wavenumber
 $\phi ^\prime _{k_z < k_{z,thresh}}$. In general, upward-propagating waves are clearly observed with alternating regions of high and low porosity for
 $k_z < k_{z,thresh}$. For
 $Re_p =20$ (figure 4d),
 $\phi ^\prime _{k_z < k_{z,thresh}}$ is a strong function of vertical position
 $z$ in which
 $\phi ^\prime _{k_z < k_{z,thresh}}$ varies over a distance of
 $\sim 2d_p$ and depends weakly on time. For
 $Re_p > 20$, wave motion is dependent both on time and vertical position.
Volume fraction fluctuation  $\langle \phi \rangle _{xy}^\prime$ as a function of time
 $u_0t/d_p$ and vertical position
 $z/d_p$ for the cases with
 $Re_p = 20$,
 $40$ and
 $70$ in panels (a,d), (b,e) and (c,f), respectively. Panels (d–f) represent the low wavenumber motions with wavenumber
 $k_z < k_{z,thresh}$.

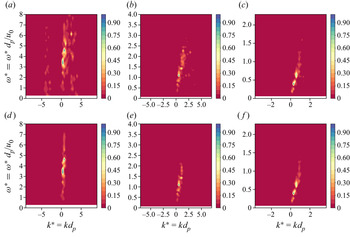
The wave-like motions can be represented by a superposition of different waves with normalized wavenumber  $k^*=kd_p$ and normalized frequency
 $\omega ^*=\omega d_p/u_0$. Figure 5(a–c) show the
 $\langle \phi \rangle _{xy}^\prime$ in spectral space as a function of
 $k^*$ and
 $\omega ^*$. Overall,
 $\langle \phi \rangle _{xy}^\prime$ is dominated by low wavenumber waves with
 $k^* \approx 1$ and the dominant frequency
 $\omega ^*$ decreases as
 $Re_p$ increases. At
 $Re_p = 20$, regions of high
 $k^*-\omega ^*$ can be observed even though the spectral density is relatively small. This illustrates that high-frequency wave modes are more significant at low
 $Re_p$ than high
 $Re_p$. As
 $Re_p$ increases, different modes collapse into a linear relationship. Figure 5(d–f) show the
 $k^*-\omega ^*$ spectra of
 $\phi ^\prime _{k_z < k_{z,thresh}}$. For
 $\phi ^\prime _{k_z < k_{z,thresh}}$, by eliminating high wavenumber modes, different modes of waves collapse into a line and a wave speed can be estimated from the kinematic relationship
 $\omega = ck$ using linear regression.
Energy spectra of volume fraction fluctuation  $\langle \phi \rangle _{xy}^\prime$ as a function of normalized wavenumber
 $k^*$ and normalized frequency
 $\omega ^*$ for the cases with
 $Re_p = 20$,
 $40$ and
 $70$ in panels (a,d), (b,e) and (c,f), respectively, and with
 $\phi ^\prime$ and
 $\phi ^\prime _{k_z < k_{z,thresh}}$ in panels (a–c) and (d–f), respectively.

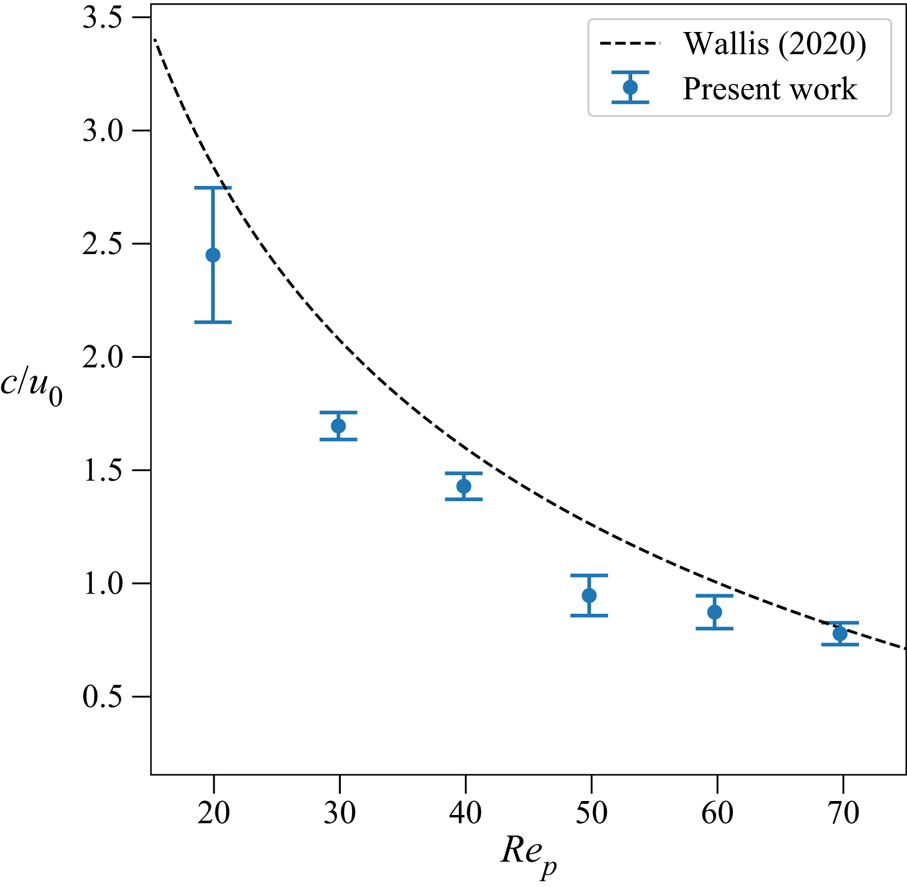
To demonstrate the existence of kinematic waves in the fluidized bed, we employ the model proposed by Wallis (Reference Wallis2020) which relates volume fraction to wave speed with
 \begin{equation} c = k n \langle \overline{\phi} \rangle (1-\langle \overline{\phi} \rangle)^{n-1} w_{ref}, \end{equation}
where  $c$ is wave speed and other variables are defined in (4.8). To calculate the wave speed, we employ the two-dimensional autocorrelation approach as demonstrated by Yao, Criddle & Fringer (Reference Yao, Criddle and Fringer2021a) and Yao et al. (Reference Yao, Criddle and Fringer2021b). The autocorrelation of reconstructed volume fraction fluctuation
 $\phi ^\prime _{k_z < k_{z,thresh}}$ is computed and wave speeds are calculated as the slope. As shown in figure 6, the calculated wave speeds are in agreement with the modelled values. The difference between the calculated wave speeds and modelled values are likely due to the dispersive effects, which are not considered in (4.10) (Shajahan & Breugem Reference Shajahan and Breugem2020; Wallis Reference Wallis2020).
Wave speed based on the autocorrelation as a function of the particle Reynolds number  $Re_p$.

4.3. Velocity fluctuations
In a fluidized bed, the ensemble-averaged vertical velocity  $\langle \langle w \rangle \rangle = 0$, indicating a balance between the submerged weight of the particles and the drag force. However, many researchers have reported that the velocity fluctuations can be as high as 10 %–170 % of the superficial velocity
 $u_0$ depending on the volume fractions (Nicolai et al. Reference Nicolai, Herzhaft, Hinch, Oger and Guazzelli1995; Hamid et al. Reference Hamid, Molina and Yamamoto2014; Zaidi et al. Reference Zaidi, Tsuji and Tanaka2015; Willen & Prosperetti Reference Willen and Prosperetti2019). To understand the effect of
 $Re_p$ on the velocity fluctuations, we computed the root mean square velocity fluctuation
 \begin{equation} u_{rms,\alpha} = \overline{\sqrt{\langle u^\prime_\alpha u^\prime_\alpha \rangle}}, \end{equation}
where  $u^\prime _\alpha = u_\alpha - \langle \overline {u} \rangle _\alpha$ is the particle velocity fluctuation and
 $\alpha = x$,
 $y$ or
 $z$. Here, the overbar is the time average defined in (4.2) and the angle brackets
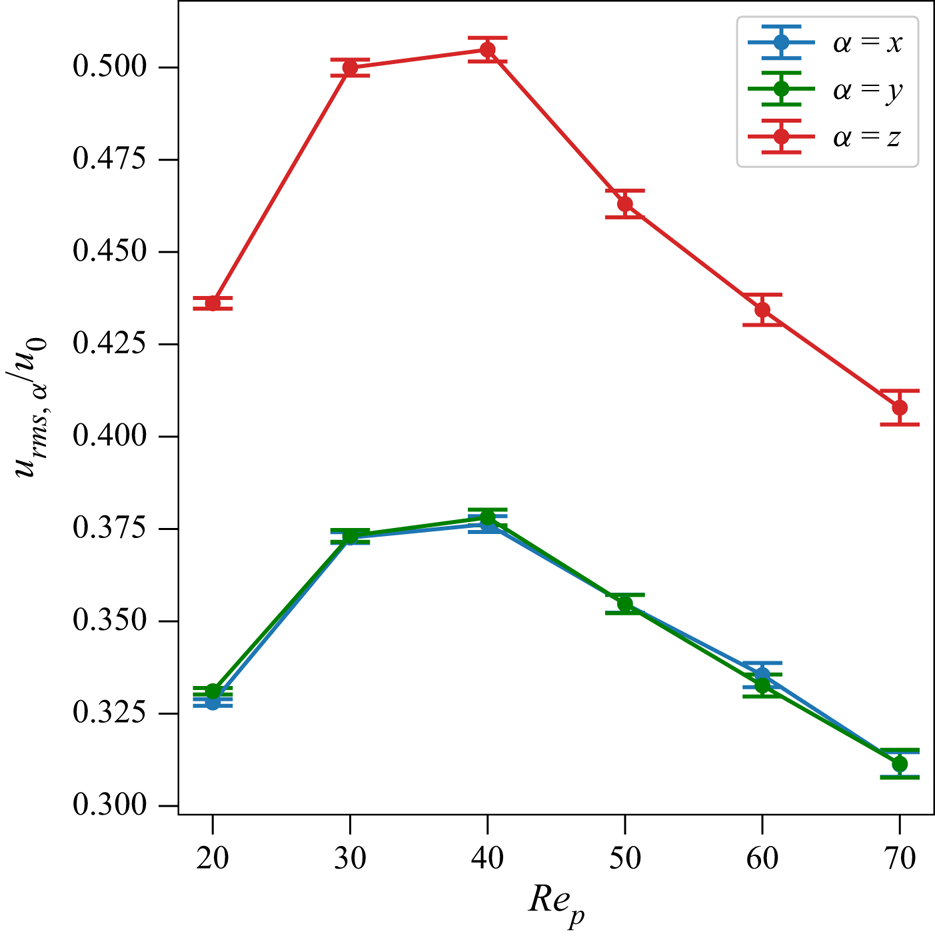
 $\langle \cdot \rangle$ imply an ensemble average over particles in the homogeneous region of the fluidized bed as defined in (4.6). Figure 7 shows
 $u_{rms,\alpha }$ normalized by
 $u_0$ as a function of
 $Re_p$. Both
 $u_{rms,x}$ and
 $u_{rms,z}$ increase initially and reach a maximum at
 $Re_p \approx 40$ and then decrease with increasing
 $Re_p$. Defining the anisotropy as
 $u_{rms,z}/u_{rms,x}$, for the range of
 $Re_p$ simulated, the anisotropy ranges between 1.7 and 1.8. Similar trends were observed by Willen & Prosperetti (Reference Willen and Prosperetti2019). While a maximum in velocity fluctuations is expected because they should be zero for both a single particle (
 $\phi \approx 0$) and a packed bed (
 $\phi \approx 0.6$), the physical mechanisms leading to a maximum at
 $Re_p \approx 40$ have not been reported in the literature.
The root mean square velocity fluctuation normalized by the superficial velocity  $u_0$ as a function of the particle Reynolds number
 $Re_p$.

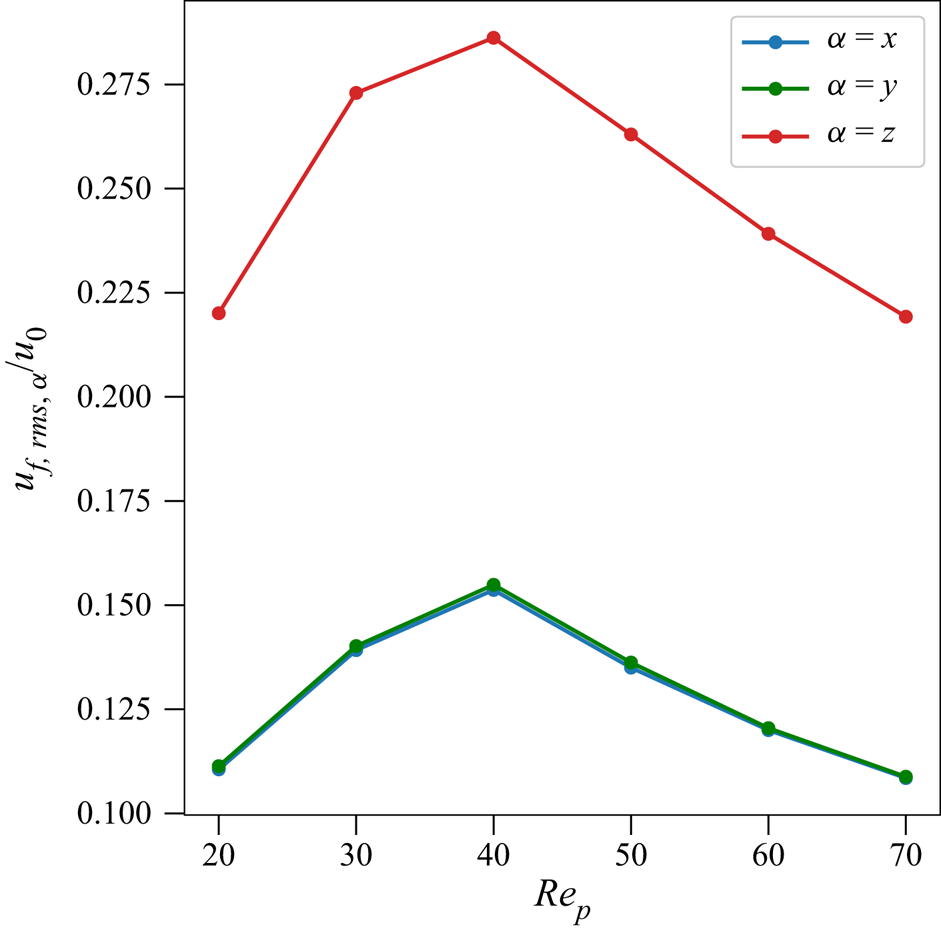
In addition to particle velocity fluctuations, the fluid velocity fluctuations in the vicinity of the particles are also quantified. Many methods have been proposed to quantify the fluid velocity in the vicinity of the particles (Bagchi & Balachandar Reference Bagchi and Balachandar2003; Kidanemariam et al. Reference Kidanemariam, Chan-Braun, Doychev and Uhlmann2013; Uhlmann & Doychev Reference Uhlmann and Doychev2014). In this study, we adopted the approach by Kidanemariam et al. (Reference Kidanemariam, Chan-Braun, Doychev and Uhlmann2013) where the fluid velocity in the vicinity of the particles is defined as the fluid in a spherical volume of diameter  $2 d_p$ where the centre of the spherical volume coincides with the particle centre. Figure 8 shows the fluid velocity fluctuations as a function of
 $Re_p$. Overall, the trends are very similar to the particle velocity fluctuations in figure 7. However, the magnitudes are smaller, indicating weaker fluid velocity fluctuations compared with the particles. It is likely that the interparticle collisions leading to the particle velocity fluctuations occur over time scales that are too short for the fluid to respond, resulting in lower fluid velocity fluctuations.
The root mean square fluid velocity fluctuation in vicinity to particles normalized by the superficial velocity  $u_0$ as a function of the particle Reynolds number
 $Re_p$.

4.4. Autocorrelation and pairwise distributions
To understand the processes governing the fluctuating particle motions, we compute the instantaneous velocity fluctuation autocorrelation for a given time lag  $\tau$:
 \begin{equation} R_{\alpha\alpha}(\tau) = \dfrac{\langle u^\prime_\alpha(t_0)u^\prime_\alpha(t_0 + \tau) \rangle}{\langle u^\prime_\alpha(t_0)u^\prime_\alpha(t_0) \rangle}; \end{equation}
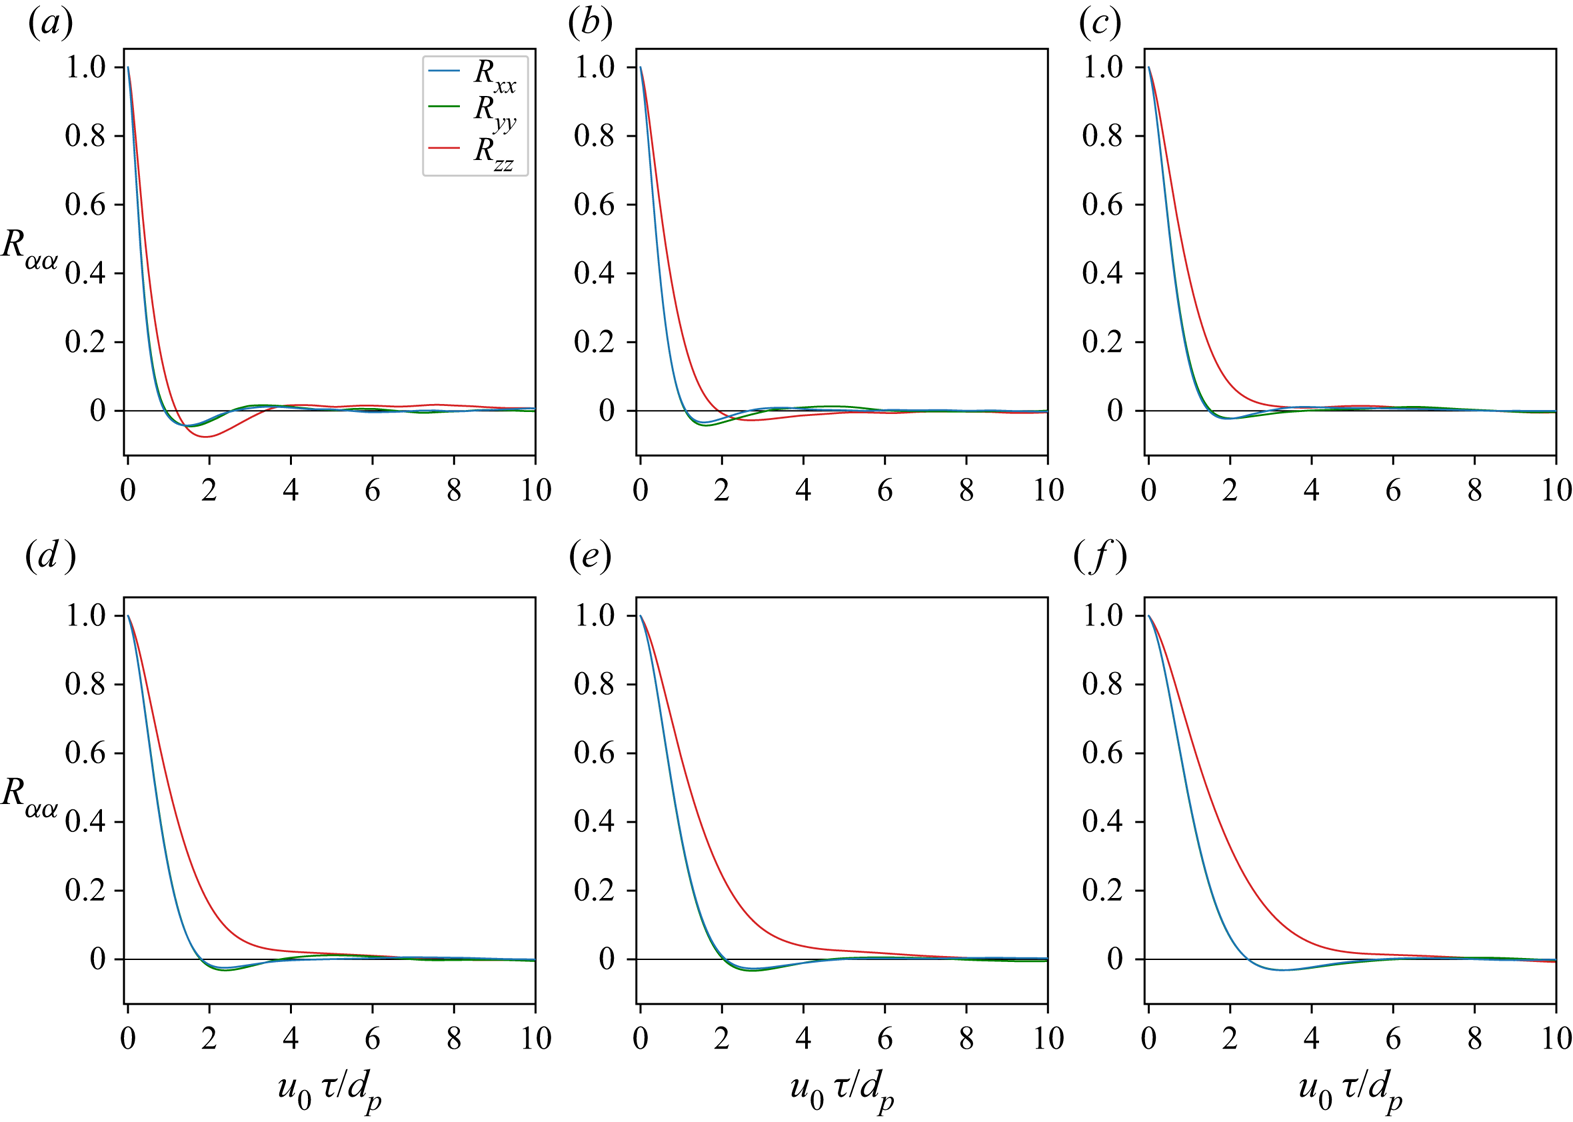
the results are shown in figure 9. For all  $Re_p$, the transverse velocity fluctuations (
 $R_{xx},R_{yy}$) for
 $1 < u_0\tau /d_p < 6$ indicate regimes of anticorrelation, the extent of which decreases with increasing Reynolds number. The axial velocity fluctuations
 $R_{zz}$ decorrelate monotonically to zero except for
 $Re_p = 20$ and
 $30$ where a region of anticorrelation exists. In addition, the transverse velocity fluctuations decorrelate faster than the axial velocity fluctuations because of preferential excitation of random particle motions in the axial direction by the axial flow. Similar results have been reported by previous three-dimensional simulations and experimental results with different particle properties (Nicolai et al. Reference Nicolai, Herzhaft, Hinch, Oger and Guazzelli1995; Esteghamatian et al. Reference Esteghamatian, Hammouti, Lance and Wachs2017; Willen & Prosperetti Reference Willen and Prosperetti2019).
Transverse ( $R_{xx},R_{yy}$) and axial (
 $R_{zz}$) velocity fluctuation autocorrelation as a function of the lag time
 $\tau$ (equation (4.12)) with different particle Reynolds numbers
 $Re_p$. (a)
 $Re_p=20$, (b)
 $30$, (c)
 $40$, (d)
 $50$, (e)
 $60$, (f)
 $70$.

The decorrelation time for the  $\alpha$ component of the velocity fluctuations can be quantified by the true integral time scale
 \begin{equation} \mathcal{T}_{\alpha,\infty} = \int_0^\infty R_{\alpha\alpha}(\tau) \, {\rm d} \tau\,. \end{equation}
However, in simulations where data is limited, the computed integral time scale is instead approximated with
 \begin{equation} \mathcal{T}_{\alpha,cal} = \int_0^{t_f} R_{\alpha\alpha}(\tau) \, {\rm d} \tau, \end{equation}
where  $t_f$ is the simulation time and
 $N_\tau = u_0 t_f/d_p$ is the non-dimensional time to calculate the computed integral time scale.
Figure 10 shows that the magnitude of  $\mathcal {T}_{\alpha ,cal}$ increases initially as a function of
 $N_\tau$ and fluctuates about a mean value due to the presence of wave-like autocorrelations. Similar wave-like autocorrelations were observed by Esteghamatian et al. (Reference Esteghamatian, Hammouti, Lance and Wachs2017) and Nicolai et al. (Reference Nicolai, Herzhaft, Hinch, Oger and Guazzelli1995). To quantify the error associated with the computed integral time scale, we computed the mean and standard deviation of
 $\mathcal {T}_{\alpha ,cal}$ as
 $$\begin{gather} \mathbb{E}(\mathcal{T}_{\alpha,cal}) = \dfrac{1}{N_\tau-N_{\tau,{thresh}}} \sum_{i=N_{\tau,{thresh}}}^{N_\tau} \mathcal{T}_{\alpha,cal}^i, \end{gather}$$
 $$\begin{gather}\sigma(\mathcal{T}_{\alpha,cal}) = \sqrt{ \mathbb{E}(\mathcal{T}^2_{\alpha,cal}) - \mathbb{E}(\mathcal{T}_{\alpha,cal})^2}, \end{gather}$$
where  $N_{\tau ,{thresh}}$ is the minimum
 $N_{\tau }$ for
 $\mathcal {T}_{\alpha ,cal}$ to reach equilibrium, and
 $\mathbb {E}(\mathcal {T}_{\alpha ,cal})$ and
 $\sigma {(\mathcal {T}_{\alpha ,cal})}$ are the mean and standard deviation of the calculated integral time scale, respectively.
Computed integral time scale  $\mathcal {T}_{\alpha ,cal}$ as a function of
 $N_\tau$.

Figure 11 shows the effect of  $Re_p$ on
 $\mathbb {E}(\mathcal {T}_{\alpha ,cal})$ and the ratio
 $\mathbb {E}(\mathcal {T}_{x,cal})/\mathbb {E}(\mathcal {T}_{z,cal})$, which is a measure of system anisotropy. Overall,
 $\mathbb {E}(\mathcal {T}_{z,cal}) > \mathbb {E}(\mathcal {T}_{x,cal})$ for the range of
 $Re_p$ simulated, implying
 $\mathbb {E}(\mathcal {T}_{x,cal})/\mathbb {E}(\mathcal {T}_{z,cal}) < 1$. This is consistent with the fact that the axial velocity fluctuations take longer to decorrelate owing to the presence of the mean flow (Nicolai et al. Reference Nicolai, Herzhaft, Hinch, Oger and Guazzelli1995; Willen & Prosperetti Reference Willen and Prosperetti2019; Esteghamatian et al. Reference Esteghamatian, Hammouti, Lance and Wachs2017). Interestingly, a minimum anisotropy (maximum of
 $\mathbb {E}(\mathcal {T}_{x,cal})/\mathbb {E}(\mathcal {T}_{z,cal})$) and maximum anisotropy (minimum of
 $\mathbb {E}(\mathcal {T}_{x,cal})/\mathbb {E}(\mathcal {T}_{z,cal})$) are observed at
 $Re_p = 40$ and
 $50$, indicating the most and least efficient momentum transfer, respectively. In addition, a sharp decrease in
 $\mathbb {E}(\mathcal {T}_{x,cal})/\mathbb {E}(\mathcal {T}_{z,cal})$ is observed as
 $Re_p$ increases from
 $40$ to
 $50$. This is due to the presence of competing mechanisms related to flow and particle physics, as discussed below.
We computed the normalized autocorrelation length scale,  $\ell _\alpha ^* = \ell _\alpha /d_p= u_{rms,\alpha }\mathbb {E}(\mathcal {T}_{\alpha ,cal})/d_p$ which is a measure of the distance over which particle velocity fluctuations are still correlated, as shown in figure 12(a). When the particle velocity fluctuations are dominated by collisions when the porosity is low, the effects of velocity fluctuations do not propagate by more than the particle diameter, and thus
 $\ell _\alpha ^* < 1$. However, when
 $\ell _\alpha ^* > 1$ the particle velocity fluctuations are dominated by the effects of the mean flow on each particle since the effects of velocity fluctuations propagate farther than a particle diameter. For all cases, both
 $\ell _x^*$ and
 $\ell _z^*$ are less than 1 indicating the particle velocity fluctuations are restricted by the relatively low porosity. Nicolai et al. (Reference Nicolai, Herzhaft, Hinch, Oger and Guazzelli1995) reported
 $\ell _z^* > 1$ for particle suspension in the Stokes regime, while Esteghamatian et al. (Reference Esteghamatian, Hammouti, Lance and Wachs2017) reported
 $\ell _z^* < 1$. We also computed
 $\ell _x/\ell _z$ which indicates anisotropy. As shown in figure 12(b), the anisotropy is maximized at
 $Re_p=40$ and decreases sharply between
 $Re_p=40$ and
 $Re_p=50$, indicating an increase in the anisotropy. This agrees with figure 11(b) where a sharp decrease is also observed from
 $Re_p=40$ to
 $Re_p=50$.
(a) The average integral time scales and (b) ratio of transverse integral time scale  $\mathbb {E}(\mathcal {T}_{x,cal})$ to axial integral time scale
 $\mathbb {E}(\mathcal {T}_{z,cal})$ as a function of Reynolds number
 $Re_p$.

Effect of particle Reynolds number on (a) the autocorrelation distance  $\ell _\alpha ^*=\ell _\alpha /d_p$ and (b) ratio of transverse to axial autocorrelation distance
 $\ell _x/\ell _z$.

To highlight the different particle Reynolds number regimes leading to the anisotropy, we adapt the pairwise-probability density function from Yin & Koch (Reference Yin and Koch2008), which is given by
 \begin{equation} g(r,\theta) = g(\boldsymbol{r}) = \frac{L_xL_y L_b}{d_p^3 N_p^2}\left\langle \sum_{i=1}^{N_p}\sum_{j=1,j\ne i}^{N_p} \delta(\boldsymbol{r} - \boldsymbol{r}_{ij})\right\rangle, \end{equation}
where  $L_b=z_t-z_b$ is the height of the bed where the porosity is homogeneous,
 $\delta$ is defined as
 \begin{equation} \delta(\boldsymbol{r} - \boldsymbol{r}_{ij}) = \begin{cases} 1, & \boldsymbol{r} = \boldsymbol{r}_{ij}, \\ 0, & \text{otherwise} \end{cases} \end{equation}
and  $\boldsymbol {r}_{ij} = [r_{ij}, \theta _{ij}]$ is the position vector between the centre of particle
 $i$,
 $\boldsymbol {x}_i$, and particle
 $j$,
 $\boldsymbol {x}_j$. In cylindrical polar coordinates,
 $r_{ij} = \Vert \boldsymbol {x}_i - \boldsymbol {x}_j \Vert$ is the magnitude of
 $\boldsymbol {r}_{ij}$ and
 \begin{equation} \theta_{ij} = \begin{cases} \cos^{{-}1}[(\vert z_i - z_j\vert)/r_{ij}] & \text{if } z_i - z_j < 0,\\ \sin^{{-}1}[(\vert z_i - z_j\vert)/r_{ij}] & \text{if } z_i - z_j \ge 0. \end{cases} \end{equation}
We also compute the pairwise-probability distribution function or radial distribution function as the angular average of  $g(r,\theta )$ over three ranges: the entire range (
 $0 \le \theta \le {\rm \pi}/2$); an effective axial range (
 $0 \le \theta \le {\rm \pi}/12$); and an effective transverse range (
 $5{\rm \pi} /12 \le \theta \le {\rm \pi}/2$). As shown in figure 13, the difference between the transverse and axial radial distribution functions is a measure of the particle arrangement preferences. The results indicate that particles do not have a preferred arrangement over the
 $Re_p$ simulated, which is likely because the volume fractions we simulate are too large (Yin & Koch Reference Yin and Koch2007; Willen & Prosperetti Reference Willen and Prosperetti2019). At
 $r/d=1$ and
 $r/d=2$, there is an obvious increase in the magnitude of the radial distribution function indicated by peaks in
 $g(r)$, an effect that decreases with increasing particle Reynolds number (see figure 14). This indicates that particles are more likely to appear at these two locations. Comparing with the three-dimensional simulations by Willen & Prosperetti (Reference Willen and Prosperetti2019), in which the peak in the transverse
 $g(r)$ is slightly higher than the peak in the axial
 $g(r)$ (implying that a transverse arrangement of particle pairs is slightly favoured over an axial arrangement), we found no difference between the transverse and axial arrangements. A possible explanation of this observation is due the higher
 $Re_t$ simulated in which the effect of collisions is more prominent. As a result, momentum is transferred more efficiently from the axial to transverse directions, inducing higher transverse velocity fluctuations and disrupting the arrangement of transverse particle pairs observed by Willen & Prosperetti (Reference Willen and Prosperetti2019).
The pairwise distribution function,  $g(r,\theta )$ ((4.17)) averaged over three ranges for the simulated cases with different
 $Re_p$: (a)
 $Re_p = 20$; (b)
 $Re_p = 30$; (c)
 $Re_p = 40$; (d)
 $Re_p = 50$; (e)
 $Re_p = 60$; (f)
 $Re_p = 70$.

The radial distribution function at  $r=2$,
 $g(r=2,\theta )$, averaged over
 $0\le \theta \le {\rm \pi}/2$, for ranges of
 $Re_p$ simulated, with different regimes indicated by the lines obtained through linear regression.

To further understand the effect of the particle Reynolds number, figure 14 shows the effect of  $Re_p$ on
 $g(r/d_p = 2)$. For the cases simulated, two regimes can be identified with regressions having correlation coefficients
 $R^2 > 0.99$. In general, the peak decreases with increasing Reynolds number, although the slope depends on two distinct flow regimes, which are referred to as regime 1 (
 $Re_p < 50$) and regime 2 (
 $Re_p \ge 50$) in what follows.
4.5. Particle–particle and fluid–particle interactions
The mechanisms dictating the particle velocity fluctuations described in § 4.4 can be explained through analysis of the magnitude of stresses related to the particle–particle and particle–fluid interactions. The role of particle–particle collisions is to transfer momentum from the axial direction to the transverse direction, resulting in a more isotropic system (Esteghamatian et al. Reference Esteghamatian, Hammouti, Lance and Wachs2017). To quantify the magnitude of the stress induced by collisions and flow, we computed the normal contact stress,  $\sigma _{col,\alpha }$, normal lubrication stress,
 $\sigma _{lub,\alpha }$, and hydrodynamic stress due to the fluid,
 $\sigma _{hydro,\alpha }$, as a function of the vertical position in the fluidized bed. The lubrication stress is considered separately from collision and hydrodynamic stresses since both fluid–particle and particle–particle interaction are involved. A detailed derivation of these stresses can be found in Appendix B. All stresses are normalized by
 $d_p^2/\rho _f\nu ^2$ and denoted as
 $\hat {\sigma }$.
Overall, all the stresses fluctuate about a mean value away from the top and bottom boundaries of the fluidized bed. To quantify the effect of  $Re_p$ on each component of the stress, we computed the vertical average of each stress first using the averaging operator defined in (4.3) and then computing the
 $\ell ^2$ norm of the stress vector
 $\boldsymbol {\sigma }$ as
 ${\left \|\boldsymbol {\sigma }\right \|}_2$. Figure 15 shows the magnitude of the normalized mean stresses as a function of
 $Re_p$. As
 $Re_p$ increases, the effect of
 ${\left \|\boldsymbol {\sigma }_{col}\right \|}_2$ decreases while the effect of
 ${\left \|\boldsymbol {\sigma }_{hydro}\right \|}_2$ increases. Both Zenit et al. (Reference Zenit, Hunt and Brennen1997) and Derksen & Sundaresan (Reference Derksen and Sundaresan2007) have found
 ${\left \|\boldsymbol {\sigma }_{col}\right \|}_2$ decreases with decreasing
 $\phi$ beyond a critical volume fraction. The effect of
 ${\left \|\boldsymbol {\sigma }_{lub}\right \|}_2$ is negligible, which also agrees with Derksen & Sundaresan (Reference Derksen and Sundaresan2007) who showed that the lubrication stress is negligible even though the simulated porosity and particle properties are different.
Comparing the magnitude of each stress (figure 15), at  $Re_p = 20$ where
 ${\left \|\boldsymbol {\sigma }_{col}\right \|}_2 \gg {\left \|\boldsymbol {\sigma }_{hydro}\right \|}_2$, collisions dominate over hydrodynamic effects and hydrodynamic effects are negligible. For
 $20 < Re_p < 40$, as
 $Re_p$ increases, hydrodynamic effects increase,
 ${\left \|\boldsymbol {\sigma }_{col}\right \|}_2 > {\left \|\boldsymbol {\sigma }_{hydro}\right \|}_2$ still persists but the difference is decreasing. In this regime, collisions still dominate over hydrodynamic effects but the relative importance of hydrodynamic effects increases. This corresponds to regime 1 in figure 14 where both collisions and hydrodynamics are important in inducing velocity fluctuations. For
 $Re_p > 40$,
 ${\left \|\boldsymbol {\sigma }_{hydro}\right \|}_2 > {\left \|\boldsymbol {\sigma }_{col}\right \|}_2$ indicates hydrodynamic effects dominating over collisions, corresponding to regime 2 identified in figure 14. By comparing with results from Yao et al. (Reference Yao, Criddle and Fringer2021a) for simulations of fluidized beds with Archimedes number of 8600 and 13 660 (figure 16), we observe that the critical volume fraction (inversely proportional to particle Reynolds number) decreases as the Archimedes number increases. However, future work is required to establish a relationship between the optimum particle Reynolds number and a wider range of Archimedes numbers.
The decreasing importance of the collisional stress with increasing  $Re_p$ occurs because of a reduction in the collision frequency with increasing
 $Re_p$. We define a collision between two particles as occurring when the separation distance between the particle centres is less than the particle diameter
 $d_p$. If the number of times particle
 $i$ collides with another particle during a simulation time step
 $n$ is given by
 $N_{c,i}^n$, then the time- and ensemble-average collision frequency is given by
 \begin{equation} \langle \overline{f_c} \rangle = \frac{1}{N_p(t_{max}-t_0)}\sum_{n=n_0}^{n_{max}}\sum_{i = 1}^{N_p} N_{c,i}^n, \end{equation}
where  $n_0=t_0/\Delta t$ and
 $n_{max}=t_{max}/\Delta t$. Since the porosity and in turn the spacing between particles increases with increasing
 $Re_p$ (figure 3), the likelihood of collisions should decrease with increasing
 $Re_p$, leading to the monotonically decreasing dependence of
 $\langle \overline {f_c} \rangle$ on
 $Re_p$ as shown in figure 17(a). When the porosity is smaller, the likelihood of collision between particles is higher.
The computed normal contact stress, normal lubrication stress and hydrodynamic stress as a function of particle Reynolds number  $Re_p$.

The computed normal contact stress (circle) and hydrodynamic stress (square) as a function of volume fraction  $\phi$ for Archimedes numbers of 8600, 13 660 and 23 600.

For the simulated cases, the collision frequency as defined in (4.20) is overestimated for small  $Re_p$ because particles may interact without colliding and producing a measurable collisional stress. To restrict collisions to those with appreciable normal contact velocities, we define the collision Stokes number with impact velocity
 $u_{imp}$ as
 \begin{equation} St_{imp} = \dfrac{u_{imp}\rho_p d_p}{9\rho_f \nu}, \end{equation}
where  $u_{imp}$ is the normal component of the relative particle velocities contacting one another. The effective collision frequency,
 $\langle \overline {f_c} \rangle _{{eff}}$, is then computed by including collisions for which
 $St_{imp}>St_{thresh}$, where
 $St_{thresh}$ is a threshold Stokes number. The threshold Stokes number is determined by setting a minimum rebound velocity with an empirical function relating the restitution coefficient to the Stokes number. Defining the velocity of a particle before it is subjected to lubrication and contact forces as
 $w_{t,\infty }$, the restitution coefficient is given by
 \begin{equation} \varepsilon = \dfrac{u_{rebound}}{u_{t,\infty}} = \varepsilon_{max} \exp\left(-\dfrac{30}{St_{\infty}}\right). \end{equation}
Here,  $\varepsilon _{max} \approx 0.91$ is the maximum restitution coefficient when
 $St_{\infty } \rightarrow \infty$ (Legendre et al. Reference Legendre, Zenit, Daniel and Guiraud2006), where
 \begin{equation} St_{\infty} = \dfrac{u_{t,\infty}d_p \rho_p}{9\rho_f \nu_f}. \end{equation}
In this work, since  $u_{t,\infty }$ is difficult to quantify due to simultaneous collisions with the soft-sphere modelling approach, we rearrange (4.22) to relate
 $St_{imp}$ to
 $\varepsilon$ by using the dry restitution coefficient
 $e_{dry} = u_{rebound}/u_{imp}$ such that
 \begin{equation} St_{imp} = \dfrac{30\varepsilon}{e_{dry} (\log \varepsilon - \log \varepsilon_{max})} = \dfrac{u_{imp}d_p \rho_p}{9\rho_f \nu_f}. \end{equation}
To understand the effect of different  $\varepsilon$ on
 $St_{thresh}$, figure 17(b) shows the normalized effective collision frequency as a function of
 $Re_p$ for different
 $\varepsilon$. In general, as
 $\varepsilon$ increases, the effective collision frequency decreases and the maximum effective collision frequency shifts to higher
 $Re_p$. However, for the range of
 $\varepsilon$ tested, the maximum effective collision frequency occurs when
 $Re_p = 40$, indicating that the maximum effective collision frequency is not very sensitive to
 $\varepsilon$. Furthermore, the maximum effective collision frequency coincides with the minimum anisotropy observed in figures 11 and 12, indicating a point in which momentum transfer from the axial to transverse directions is optimal.
5. Summary and conclusions
We studied the effects of the particle Reynolds number on the behaviour of monodispersed spherical particles in PRS simulations of a three-dimensional, liquid–solid fluidized bed. The particle Reynolds number was varied by varying the flow rate suspending particles in the axial ( $z$) direction. Analysis of various statistics provided insights into the observed particle motions. Boundary effects associated with the fluidized bed are identified and excluded in statistical calculations to improve accuracy. The wave modes are studied in both physical and spectral spaces to shed light on the source of the particle velocity fluctuations. By separating volume fraction fluctuations into low and high wavenumber components, wave-like behaviour is clearly observed. For low particle Reynolds number (
 $Re_p = 20$), waves with both low and high wavenumbers are strongly dependent on vertical position and weakly dependent on time. As particle Reynolds number increases, waves with low wavenumber depend strongly both on vertical positions and time while wave motions with high wavenumber are less apparent. Volume fraction fluctuations in spectral space further reveal that high-frequency wave modes are more significant at low particle Reynolds number. Low wavenumber modes can be estimated well with the kinematic wave relationship using linear regression while no discernible kinematic relationship can be observed for high wavenumber modes, indicating that the high wavenumber fluctuations are probably random. Analysis of the root mean square particle velocity fluctuations indicates a maximum at an intermediate particle Reynolds number (
 $Re_p = 40$) in both the transverse and axial directions.
The decorrelation time scales in the axial and transverse directions reveal that momentum transfer from the axial to the transverse directions is most efficient at  $Re_p=40$ and least efficient at
 $Re_p=50$. A sharp decrease in the efficiency of the momentum transfer is observed as
 $Re_p$ increases from 40 to 50, revealing a transition in the flow regime. Because the length scale over which particle motions decorrelate was less than
 $1 d_p$ for all particle Reynolds numbers simulated, the transition is dominated by porosity effects. By analysing the pairwise distribution function, we found that the probability that particle pairs are aligned at a distance of
 $2d_p$ decreases with increasing particle Reynolds number. The rate of this decrease revealed two distinct regimes that are consistent with the momentum transfer regimes discussed above.
To understand the mechanisms controlling the flow regimes and the sharp decrease in momentum transfer from the axial to transverse directions, we computed average collision and hydrodynamic stresses as a function of  $Re_p$. The results indicate that the relative magnitude of collision to hydrodynamic effects controls the efficiency of inducing particle velocity fluctuations, momentum transfer and particle alignment. For
 $20 < Re_p \le 40$, collisions dominate over hydrodynamic effects but the relative importance of hydrodynamic effects increases, indicating a coexistence of mechanisms related to flow and collisions (regime 1) that leads to the peak in particle velocity fluctuations and momentum transfer. As the particle Reynolds number increases (
 $Re_p > 40$), hydrodynamic effects dominate over collision effects (regime 2). Due to a lack of effective collisions, particle velocity fluctuations decrease and a sharp decrease in momentum transfer efficiency is observed. The lack of collisions arises from a decrease in the collision frequency with increasing
 $Re_p$. We found that it was important to quantify the collision frequency by an effective collision frequency based on collisions satisfying a threshold Stokes number. Defined this way, the effective collision frequency peaks at an
 $Re_p$ that coincides with that of the highest particle fluctuations and a sharp decrease in momentum transfer.
Our results imply biofilm detachment models in fluidized-bed reactors should focus on collision effects for  $Re_p \le Re_{p,\alpha }$, collision and hydrodynamic effects for
 $Re_{p,\alpha } < Re_p < Re_{p,\beta }$ and hydrodynamic effects for
 $Re_p \ge Re_{p,\beta }$, where
 $Re_{p,\alpha } \approx 40$ and
 $Re_{p,\beta } \approx 50$ for an Archimedes number of 23 600. This study excludes the effect of adhesive force on biofilm and Archimedes number. Further work is required to quantify the effect of adhesive force on particle dynamics and establish a relationship between the optimum particle Reynolds number and Archimedes number. Furthermore, our results imply that mixing within liquid–solid fluidized bed reactors is likely to be optimized at an intermediate
 $Re_p$ at which particle velocity fluctuations are expected to be the strongest. Indeed, previous fluidized bed reactor studies with a large Archimedes number show that treatment performance is optimized at a similar intermediate
 $Re_p\approx 30 - 40$ (Jaafari et al. Reference Jaafari, Mesdaghinia, Nabizadeh, Hoseini, Kamani and Mahvi2014). We anticipate that the results of this study will inform fluidized-bed reactor design and modelling for domestic and industrial wastewater treatment, enabling more reliable and energy-efficient operation.
Time- and ensemble-averaged (a) collision frequency  $\langle \overline {f_c} \rangle$ and (b) effective collision frequency
 $\langle \overline {f_c} \rangle _{{eff}}$ as a function of particle Reynolds number with different
 $\varepsilon$.

Acknowledgements
This work used the Extreme Science and Engineering Discovery Environment (XSEDE), which is supported by National Science Foundation grant number ACI-1548562. Simulations were conducted with supercomputer resources under XSEDE Project CTS190063. The authors acknowledge the Texas Advanced Computing Center (TACC) at The University of Texas at Austin for providing HPC resources that have contributed to the research results reported within this paper. We thank H. Lee and S. Balachandar from the University of Florida for providing us with their IBM code. We also thank E. Biegert, B. Vowinckel, T. Köllner and E. Meiburg from the University of California, Santa Babara, for assistance with implementation of the collision models.
Funding
This work was funded by the California Energy Commission (CEC) under CEC project number EPC-16-017, the US NSF Engineering Center for Reinventing of the Nation's Urban Water Infrastructure (ReNUWIt) under award no. 1028968 and Office of Naval Research grant N00014-16-1-2256. This document was prepared as a result of work sponsored in part by the California Energy Commission. It does not necessarily represent the views of the Energy Commission, its employees, or the State of California. Neither the Commission, the State of California, nor the Commission's employees, contractors or subcontractors makes any warranty, express or implied, or assumes any legal liability for the information in this document; nor does any party represent that the use of this information will not infringe upon privately owned rights. This document has not been approved or disapproved by the Commission, nor has the Commission passed upon the accuracy of the information in this document.
Declaration of interests
The authors report no conflict of interest.
Appendix A. Instantaneous Eulerian volume fraction
In our simulations, the instantaneous Eulerian volume fraction  $\phi (\boldsymbol {x},t)$ can be estimated using a second-order level-set approximation (Kempe & Fröhlich Reference Kempe and Fröhlich2012a). Defining the particle centre as
 $\boldsymbol {x}_p$ and Eulerian grid as
 $\boldsymbol {x}_{ijk}$ where
 $i$,
 $j$ and
 $k$ represent each direction. The volume fraction of each grid cell is defined as
 \begin{equation} \phi(x_i, y_j, z_k) = \dfrac{\sum_{l=1}^{8} -\psi_m \mathcal{H}(-\psi_m)}{\sum_{l=1}^{8} {\left|\psi_m\right|}}, \end{equation}
where  $l$ is an integer representing the corner of an Eulerian grid,
 $\psi$ is the level-set function for spheres that is defined as
 \begin{equation} \psi(\boldsymbol{x}, \boldsymbol{x}_p, r_p) = \dfrac{\Vert \boldsymbol{x} - \boldsymbol{x}_p \Vert_2}{r_p} - 1 \end{equation}
and  $\mathcal {H}(-\psi _m)$ is the Heaviside function
 \begin{equation} \mathcal{H}(\alpha) = \begin{cases} 0, & \alpha \le 0, \\ 1, & \alpha > 0. \end{cases} \end{equation}
To ensure the accuracy of level-approximation for  $\phi (\boldsymbol {x},t)$, we use a grid spacing equivalent to the simulations where
 $h = d_p/25.6$.
Appendix B. Determination of particle-related stresses
The governing equation of particle motion can be described as
 \begin{equation} m_p \frac{\mathrm{d} \boldsymbol{u}_p}{\mathrm{d} t} = \boldsymbol{F}_{h,p} + \boldsymbol{F}_{col,p} + \boldsymbol{F}_{lub,p} - V_p(\rho_p - \rho_f)\boldsymbol{g} , \end{equation}
where  $\boldsymbol {u}_p$ is the translational velocity of a particle,
 $\boldsymbol {F}_{h,p}$ is the drag force on the particle,
 $\boldsymbol {F}_{col,p}$ and
 $\boldsymbol {F}_{lub,p}$ are, respectively, the collision and normal lubrication force on particle
 $p$. Fluidization occurs when the weight of particle is balanced by the average drag force. Therefore, the drag force
 $F_{h,p}$ can be decomposed into two components such that
 \begin{equation} \boldsymbol{F}_{h,p} = \overline{\boldsymbol{F}_{h,p}} + \boldsymbol{F}_{h,p}^\prime = V_p(\rho_p - \rho_f)\boldsymbol{g} + \boldsymbol{F}_{h,p}^\prime, \end{equation}
where  $\overline {\boldsymbol {F}_{h,p}}$ is the drag force that balances the weight of particle and
 $\boldsymbol {F}_{h,p}^\prime$ is the fluctuation force that results in acceleration. By substituting (B2) into (B1), the governing equation can be simplified as
 \begin{equation} m_p \frac{\mathrm{d} \boldsymbol{u}_p}{\mathrm{d} t} = \boldsymbol{F}_{h,p}^\prime + \boldsymbol{F}_{col,p} + \boldsymbol{F}_{lub,p}. \end{equation}
In this study, the stresses due to  $\boldsymbol {F}_{h,p}^\prime$,
 $\boldsymbol {F}_{lub,p}$ and
 $\boldsymbol {F}_{col,p}$ are defined as hydrodynamic, lubrication and collision stresses, respectively. Since lubrication stress arises when two or more particles move closer to one another due to particle–particle interaction, therefore, lubrication stress is considered separately from the hydrodynamic stress in which the particle motion is only affected by the interaction between fluid and the particle.
The normal lubrication force and collision forces are only non-zero when the separation distance  $\zeta _n$ between particle centres is less than
 $d_p+2h$ and
 $d_p$, respectively. As such, the governing equation of particle motion can be rewritten as
 \begin{equation} m_p \frac{\mathrm{d} \boldsymbol{u}_p}{\mathrm{d} t} = \begin{cases} \boldsymbol{F}_{h,p}^\prime, & \text{ for } \Vert \boldsymbol{x}_p - \boldsymbol{x}_q \Vert_2 > d_p + 2h,\\ \boldsymbol{F}_{h,p}^\prime + \boldsymbol{F}_{lub,p}, & \text{ for } d_p < \Vert \boldsymbol{x}_p - \boldsymbol{x}_q \Vert_2 \le d_p + 2h,\\ \boldsymbol{F}_{col,p}, & \text{ for } \Vert \boldsymbol{x}_p - \boldsymbol{x}_q \Vert_2 \le d_p, \end{cases} \end{equation}
where  $x_p$ and
 $x_q$ are the particle centre positions.
To determine the stresses as a function of vertical position in the domain, we first discretize the domain into slices with a vertical spacing of  $d_p/2$. If we assume the acceleration of a particle at time step
 $n+1/2$ is given by
 \begin{equation} \boldsymbol{a}_p^{n+1/2} = \dfrac{\boldsymbol{u}_p^{n+1} - \boldsymbol{u}_p^{n}}{\Delta{t}}, \end{equation}
then the total force  $\boldsymbol {F}_{t,p}$ at time step
 $n+1/2$ is
 $m_p\boldsymbol {a}_p^{n+1/2}$. To demonstrate the validity of (B4), we define an average error metric
 \begin{equation} \langle \boldsymbol{\varepsilon}_{f} \rangle = \dfrac{1}{N_p }\sum_{i=1}^{N_p} \dfrac{m_p\boldsymbol{a}_i^{n+1/2}}{\boldsymbol{F}^n_{i,rhs}} - 1, \end{equation}
where  $\boldsymbol {F}^n_{i,rhs}$ is the summation of all forces experienced by the particle
 $i$ at time
 $n$. As shown in table 1, the mean error associated with the approximation is less than 1 % for all cases, demonstrating the validity of (B4).
Error  $\boldsymbol {\varepsilon _{f}}$ associated with force balance in (B4).

The hydrodynamic force at time step  $n+1/2$ can be determined as
 \begin{equation} \boldsymbol{F}_{h,p}^\prime = \begin{cases} \boldsymbol{F}_{t,p}, & \text{ for } \Vert \boldsymbol{x}_p - \boldsymbol{x}_q \Vert_2 > d_p + 2h,\\ \boldsymbol{F}_{t,p}- \boldsymbol{F}_{lub,p} , & \text{ for } d_p < \Vert \boldsymbol{x}_p - \boldsymbol{x}_q \Vert_2 \le d_p + 2h, \end{cases} \end{equation}
and the hydrodynamic stress over particle surface area  $(\sigma _{hydro,p})^{n+1/2} = \boldsymbol {F}_{h,p}^\prime /({\rm \pi} d_p^2)$ can be calculated. The hydrodynamic stress for a particle bin
 $k$ can be calculated as
 \begin{equation} (\boldsymbol{\sigma}_{hydro})_k =\dfrac{1}{N} \sum_{n=1}^{N_p} \sum_{t=1}^{N_t} \dfrac{(\vert \boldsymbol{F}_{h}^\prime\vert)^{t}_i}{{\rm \pi} d_p^2}\boldsymbol{1}_{z_{l} < z_i < z_{u}}(z_i) , \end{equation}
where  $N = \sum ^{N_t N_p}\boldsymbol {1}_{z_{l} < z_i < z_{u}}(z_i)$ is the number of samples in each bin,
 $z_i$ is the vertical position of particle
 $i$,
 $\boldsymbol {e}$ is vector of ones and
 $\boldsymbol {1}_{z_{l} < z_i < z_{u}}(z_i)$ is the indicator function that is defined as
 \begin{equation} \boldsymbol{1}_{z_{l} < z_p < z_{u}}(z_i) = \begin{cases} 1, & z_l < z_p < z_u, \\ 0, & \text{otherwise.} \end{cases} \end{equation}
In the simulations, the collision model is based on the adaptive collision time model (known as ACTM) proposed by Kempe & Fröhlich (Reference Kempe and Fröhlich2012a) and tangential collision models by Biegert et al. (Reference Biegert, Vowinckel and Meiburg2017). In the adaptive collision time model, each collision is assumed to occur over  $10\Delta {t}$ instead of
 $\Delta {t}$ in the soft-sphere collision model. At each time step, the normal contact force
 $\boldsymbol {F}_{col}$ is determined and the contributions of all collisions at a bin
 $k$ is determined with
 \begin{equation} (\boldsymbol{\sigma}_{col})_k = \dfrac{1}{N} \sum_{n=1}^{N_p} \sum_{t=1}^{N_t} \dfrac{(\vert \boldsymbol{F}_{con} \vert)^{t}_i}{{\rm \pi} d_p^2}\boldsymbol{1}_{z_{l} < z_i < z_{u}}(z_i). \end{equation}
A similar procedure can be applied to the lubrication stress after assuming the lubrication forces are also stretched over several time steps. The contributions of all lubrication forces in a bin  $k$ is determined with
 \begin{equation} (\boldsymbol{\sigma}_{lub})_k = \dfrac{1}{N} \sum_{n=1}^{N_p} \sum_{t=1}^{N_t} \dfrac{(\vert \boldsymbol{F}_{lub}\vert)^{t}_i}{{\rm \pi} d_p^2}\boldsymbol{1}_{z_{l} < z_i < z_{u}}(z_i). \end{equation}