


Introduction
That developmental rates of poikilothermic organisms are temperature-dependent has been known for more than a century (e.g. the day-degree summation model of Candolle (1855) cited in Curry & Feldman (Reference Curry and Feldman1978) ). More recent is the appreciation of variability in developmental times among individuals or, in statistical terms, that insect development is stochastic rather than deterministic (Stinner et al., Reference Stinner, Butler, Bachelor and Tuttle1975; Curry & Feldman, Reference Curry and Feldman1978; Curry et al., Reference Curry, Feldman and Smith1978; Sharpe et al., Reference Sharpe, Curry, DeMichele and Cole1977). Recognition of these two essential characteristics, non-linear temperature dependence and variability among individuals, has lead to new approaches to modelling insect phenology (Stinner et al., Reference Stinner, Butler, Bachelor and Tuttle1975; Regniere, Reference Regniere1984; Wagner et al., Reference Wagner, Wu, Sharpe and Coulson1984, Reference Wagner, Wu, Feldman, Sharpe and Coulson1985; Logan, Reference Logan1988; Logan & Weber, Reference Logan and Weber1989). One is the ‘same-shape’ distribution approach pioneered by Sharpe et al. (Reference Sharpe, Curry, DeMichele and Cole1977), Curry & Feldman (Reference Curry and Feldman1978) and further described by Wagner et al. (Reference Wagner, Wu, Sharpe and Coulson1984). This same-shape distribution method uses a probability distribution function to predict the proportion of individuals in a population that finish development under variable temperatures or, in the terms of an individual, the probability an individual will emerge from a particular stage.
Like rates of development, rates of reproduction among insects typically vary with both temperature and age (Curry et al., Reference Curry, Feldman and Smith1978). The physiological age of poikilotherm largely depends on temperature; variability in reproduction among individuals is generally the rule rather than the exception. It is these similarities between development and reproduction that suggest the ‘same-shape’ approach may also be applicable to modelling insect reproductive rates and distribution. Of course, the conjecture based on the similarities needs to be tested with experimental data. We also further discuss the testing standard and the strategy to deal with the exceptional cases when testing fails, in the final section, ‘Conclusions and perspective’.
Describing reproductive processes by using probability distributions is not new. However, published models that can describe reproduction distribution under variable temperatures are rare with few exceptions (notably Regniere, Reference Regniere1983). Indeed, in the very same paper that discussed the same-shape distribution of insect development, Curry et al. (Reference Curry, Feldman and Smith1978) also proposed a similar framework for modelling reproduction. In that paper, Curry et al. (Reference Curry, Feldman and Smith1978) assumed that the expected rate of reproduction (R) at fractional development x and temperature k takes the form

where h(k) is the total expected lifetime reproduction under constant temperature regime k and g(x)dx is the proportion of reproduction per female during the fractional developmental interval (x, x+dx). However, Curry et al. (Reference Curry, Feldman and Smith1978) failed to elaborate the relationship between equation 1 and same-shape distribution approach. Although Wagner et al. (Reference Wagner, Wu, Sharpe and Coulson1984, Reference Wagner, Wu, Feldman, Sharpe and Coulson1985) subsequently refined and applied same-shape methods of modelling insect development, application to insect reproduction never was revisited in literature.
The underlying idea of the same-shape approach is that cumulative distributions of normalised developmental time (or rates) under different temperatures have an identical shape and so can be fitted with a single temperature-independent distribution function, e.g. the Weibull distribution. Normalization is simply a transformation of developmental time (or rate), performed by multiplying (or dividing) the developmental time (or rate) measures under a constant temperature by the expected median developmental rate under that same temperature regime. The temperature-invariant distribution then can be used to predict developmental times of individuals under variable temperatures by using a rate-summation approach (Wagner et al., Reference Wagner, Wu, Sharpe and Coulson1984). The process is as follows. First, the relationship between mean (or median) developmental rate under constant temperatures is fitted with a nonlinear model. Many nonlinear models have been proposed (see, for example, Taylor (Reference Taylor1981) and Logan (Reference Logan1988) ). This temperature-dependent mean (median) developmental rate model predicts the average rate of development at a certain temperature, or the fraction of development completed per unit time. These fractions are then accumulated under field variable temperatures and are treated as independent variables in the normalised same-shape distribution model. Thus, the fraction of the cohort that completes development at each accumulated rate is given by the dependent variable of the same-shape distribution function. This rate model determines the speed of cohort development as a function of temperature, while the same-shape distribution function gives the proportion of the cohort completing development as a function of accumulating rates. Integrating the two models is the essence of the rate-summation approach for predicting insect phenology. We believe that same-shape and rate-summation approaches can be extended to modelling insect reproduction process under variable temperatures. This paper explores same-shape and rate-summation approaches to modelling RWA nymphal production.
Materials and methods
We extended Taylor's (Reference Taylor1981) model for insect development to describe RWA mean (median) nymphal production under different temperature and barley plant growth stages. The original Taylor's model only considers the effects of temperature. Our extended version of Taylor's model also incorporated the effects of barley plant growth stages on RWA reproduction. Three same-shape distribution models, Weibull distribution, Stinner's model and logistic model, are used to construct RWA same-shape reproduction distribution models. The results show that Stinner's model successfully describes both reproduction rates and times (defined later in the paper) and Weibull distribution succeeds in reproduction times, while the Logistic model fails in both reproduction rates and times modelling. The statistical parameters and visual inspections for these model fittings provide further evidence that the same-shape distribution approach is feasible for describing RWA reproduction under various environmental regimes, such as temperature and plant growth stages. Unlike the insect development and phenology modelling, few unified insect reproduction models could be generally applied to insect reproduction modelling. The same-shape reproduction distribution approach we demonstrated with RWA may well be applied to other insect species.
Laboratory experiments
We conducted laboratory experiments from 1994 to 1995 to collect required data to develop RWA population development, reproduction and survival models. The experiment investigated the influence of 25 different temperature and barley plant growth stage regimes on RWA development, survival and reproduction. For each of the 25 temperatures, plant-stage combinational treatment, we recorded the developmental timing and nymphal production of 72 RWA individuals through their entire lifetime (1800 total RWA, 25×72). The experiment was conducted in two growth chambers. Treatments were factorial combinations of five temperatures and five barley plant growth stages. Temperature regimes were 8–1°C, 17–10°C, 23–16°C, 28–21°C, 33–26°C, fluctuating on a 14:10 h (light:dark) rectangular-wave cycle (where the higher constant temperature coincided with the light phase and the lower temperature coincided with the dark phase). Hence, mean temperatures weighted by photoperiod were 5.1, 14.1, 20.1, 25.1 and 30.1°C, respectively. Barley plant growth stages were two-leaf, tillering, flag leaf, inflorescence and soft dough; the corresponding Zadoks scale (Zadoks et al., Reference Zadoks, Chang and Konzak1974) was 12, 23, 39, 59 and 85. Spring barley of the variety ‘Excel’ was sown in 6-cm diameter pots in the greenhouse. Every two days, new barley plants were sown to continue the supply of barley plant leaves of different growth stages.
Russian wheat aphids used in the experiment were from a laboratory colony maintained in a growth chamber from field collections near Moscow, Idaho. Each aphid was reared in a Petri dish containing a clipped spring barley leaf placed on a wetted filter paper secured at the leaf ends with small pieces of filter paper. In a preparatory experiment, we found that maintaining appropriate humidity inside the Petri dish was critical, especially at high temperatures; hence, a 12×12cm2 piece of parafilm® paper was inserted between the dish and cover to prevent evaporation.
Experiments began with the preparation of newly-born first-instar nymphs. At about 6 pm, approximately 200 female adults from the colony were transferred to 72 Petri dishes prepared as previously described. These females were left to reproduce under room temperature until approximately 11 pm. Then, dishes were examined and RWA nymphs transferred gently with a fine brush to establish one nymph per dish. This procedure was finished at midnight and day one of the experiment began with the 72 Petri dishes moved into the growth chamber. These procedures controlled age differences among individuals within a cohort (treatment) to six hours. Survival, molting and nymphal production of each aphid were recorded daily until death. New progeny were removed daily; every other day, leaves were replaced from plants which had just reached the required growth stage.
Same-shape reproduction distribution and rate-summation approaches
Here, we now compare and contrast the key concepts of the same-shape method with respect to development and reproduction of insects, using the Russian wheat aphid as an example.
Developmental rate vs. reproduction rate
Whereas the inverse of RWA development time is developmental rate, we define RWA reproduction rate as daily nymphal production per female divided by her lifetime expectancy of nymphal production. We expect that the same nonlinear models used to describe developmental rate also can be used to describe reproduction rate.
Developmental time vs. reproduction time (period)
The reproduction period (time), the counterpart of developmental time (period), can be defined as the inverse of reproduction rate, the lifetime expectancy of nymphal production per female divided by daily nymphal production. The same nonlinear models used to describe developmental time also can be used to describe reproduction time.
Normalised developmental rates (or times) vs. normalised reproduction rates (times)
Normalised reproduction rate (or time) is computed by dividing (or multiplying) the reproduction rate (or time) by the expected median reproduction rate under the same temperature.
Same-shape developmental distribution vs. same-shape reproduction distribution
As in the case of development, we expect that the cumulative frequency distributions of reproduction rates (or times) under different temperatures show same-shape and could be described with a single temperature-invariant distribution model, such as the Weibull distribution.
The underlying biological mechanism of the same-shape developmental distribution is enzymatic control of insect development (Sharpe et al., Reference Sharpe, Curry, DeMichele and Cole1977; Curry & Feldman, Reference Curry and Feldman1978; Curry et al., Reference Curry, Feldman and Smith1978). These authors hypothesised a single enzyme that controls development is symmetrically distributed around a genetically determined mean concentration. Hence, the observed distribution of developmental rates too should be symmetrical. Furthermore, if coefficients of variation from these distributions are relatively temperature independent, one can fit normalized developmental rates (times) with a single temperature-invariant distribution function, the same-shape distribution.
There is evidence that temperature influences insect reproductive rates in a similar way to insect development. Ratte (Reference Ratte and Hoffman1984) found that gonadal growth curves and differentiation of eggs in some insect species show close similarity to larval growth and differentiation. Further, the same hormones are involved in controlling ovarian growth and maturation. It is remarkable that environmental factors such as temperature, photoperiod and thermoperiod cause analogous changes in adult size and egg size. This strongly indicates that temperature effects are mediated by the neuro-endocrine system (i.e. the endocrine system may be temperature sensitive) and that the mechanisms of temperature effects on insect development and reproduction may be very similar. The same-shape approach should also be applicable for describing insect reproduction.
The same-shape distribution concept, as it applies to reproduction, is explained in figs 1 and 2. Figure 1 is an assumed example of insect reproduction times under different temperatures. The four curves in fig. 1 are cumulative probability (frequency) distributions, under four different temperature regimes, where temperature decreases from left to right. Here, it is assumed that adults live a long time under low temperatures. Although the reproduction times vary with temperature, the shapes of the cumulative probability distributions of reproduction times are the same for all temperature regimes. Normalization of reproduction times (fig. 2) is graphically equivalent to shift the curves in fig. 1 along the coordinate axis so that a single unified curve (the same-shape curve) can be used to describe reproduction times under any temperature regime. Figure 2 is the assumed same-shape curve from shifting of the curves in fig. 1.
Cumulative probability distribution of insect reproduction times under different temperature regimes (temperature decreases from left to right).

The same-shape reproduction distribution, a temperature-invariant distribution curve of normalized reproduction times, which was obtained from normalizations of curves in fig. 1.

A probability distribution (the same-shape reproduction distribution) then is chosen to describe the same-shape curve illustrated in fig. 2. The same-shape distribution is temperature-invariant, meaning that its form is not affected by temperature theoretically. However, information about temperature effects on reproduction is never lost in the same-shape approach; it is captured in the normalized reproduction times (rates). The normalised times (rates) at time t are computed by summing mean reproduction rates (times) since initiation of the reproduction through some time t. Because mean reproduction rates (times) are temperature dependent (possibly also depend on other factors such as plant growth stage), the effects of temperature on reproduction are considered neatly. This integrated process is called rate-summation. Immediate benefits of indirectly incorporating temperature influences on reproduction are two-fold: (i) individual variation in reproduction capability is captured because a probability distribution is used to describe the distribution of normalized reproduction times (rates); and (ii) the same-shape distribution can predict reproduction under field variable temperatures because the same-shape distribution itself is temperature-invariant. Without establishing a same-shape distribution curve as illustrated in fig. 2, we would need a distribution curve for every possible temperature regime as illustrated in fig. 1 to simultaneously consider individual reproduction variation and temperature effects.
We believe that the success of the same-shape developmental distribution approach is acknowledged in the literature largely by its good fits to experimental data. Therefore, we will similarly test the applicability of same-shape to insect reproduction by observing the results of fitting the same-shape distributions to practical RWA nymphal production data.
Nymphal production vs. temperature and plant growth stage
We adopted Taylor's (Reference Taylor1981) insect developmental model to describe the relationship between daily mean, median or lifetime nymphal production per female and temperature as follows:

To also consider the influence of barley plant growth stage, the following slightly modified version of Taylor's model was fitted:

In both equations, T and S are temperature and plant stage, respectively, R(T, S) is either daily mean, daily median or lifetime total production of nymphs per female. Rm, T m, T σ, and α are model parameters with similar biological meanings to the original Taylor (Reference Taylor1981) model. Thus, Rm is the maximum achievable reproduction value (expressed as daily mean, daily median or lifetime total production of nymphs) under the optimum temperature T m. The parameter T σ describes the rate at which reproduction falls away from T m. Effects of the plant growth stage on RWA reproduction are given by the parameter α.
Equation 2 is a normal distribution truncated to the right of the mean. Similar to Taylor's (Reference Taylor1981) interpretation within the context of insect development, the equation assumes that reproductive rate increases with temperature and reaches a maximum rate, Rm, at the optimum temperature, T m. Above this optimum temperature, reproduction declines. The curve must be truncated to the right of T m due to the lethal effects of exposure to high temperatures. Equation 3 adds the item αS to account for effects of plant stage on reproduction. More complex expressions related to S, such as S 2, ST and exp(S), also were considered in model fitting, but very little improvement was achieved in model accountability. In many situations, introducing more complex items lowers the tolerance levels of parameter estimates very low such that the model is not reliable. Equations 2 and 3 were fitted to my experimental data by using the BMDP 3R procedure (using modified Gauss-Newton algorithm) (BMDP, 1993).
Equations 2 and 3 describe daily or lifetime nymphal production. As defined previously, the mean and median reproduction rates (times) can be computed from the models of daily and lifetime nymphal production. The computation is straightforward and the formulae will be given directly in the ‘Results and discussion’ section.
Same-shape distribution model of RWA reproduction
The algorithm for conducting same-shape analyses was discussed in detail by Wagner et al. (Reference Wagner, Wu, Sharpe and Coulson1984, Reference Wagner, Wu, Feldman, Sharpe and Coulson1985) and Logan (Reference Logan1988) and Logan & Weber (Reference Logan and Weber1989). We used the same-shape distribution-model fitting components of the PMDS (Population Model Design System) software (Logan, Reference Logan1988), which was originally designed to model insect development and phenology. A same-shape model can be based either on the cumulative distribution of reproduction rates, R(r), or on the cumulative distribution of reproduction times, R(t). Normalization transforms either to their corresponding same-shape distribution. Three distribution models can be fit to the normalized cumulative distributions by using Logan's (Reference Logan1988) PMDS program: the Weibull distribution (Wagner et al., Reference Wagner, Wu, Sharpe and Coulson1984), the Stinner et al. (Reference Stinner, Butler, Bachelor and Tuttle1975) hyper-power function and the Regniere (Reference Regniere1984) two-parameter logistic model. Let R(x) be the probability an individual completes nymphal production at normalized time (or rate), x, or, alternatively, the percentage of the population that has finished producing nymphs and contributes no more progeny to the population. Note that R(x) can be explained in terms of individual and population, respectively. The formulas for these distribution models are as follows:
Weibull distribution

where β, γ and η are parameters of the Weibull distribution and correspond to p2, p1 and p3 from PMDS, respectively.
Hyper-power function

where z=(B−x)/(B−A) for A (the estimated minimum) and B (the estimated maximum) for either the normalized developmental time or the normalized developmental rates. The parameters A, B, θ and k correspond to p1, p2, p3 and p4 in PMDS, respectively.
Regniere's two-parameter version of the logistic model

where k and Q are two parameters of the logistic model, corresponding to p1 and p2 in PMDS, respectively.
Results and discussion
Mean and median reproduction rates (times)
Three variables were evaluated as dependent variables in equations 2 and 3: mean daily nymphs produced per female, median daily nymphs per female and total lifetime nymphs per female. Tables 1 and 2 show the results of fitting Taylor's basic and modified models. Several criteria, including RMS (Residual Mean Square), asymptotic standard deviation, tolerance and correlation coefficients of estimated parameters (see footnotes for tables 1 and 2), show that the constructed models are reliable. Figures 3–5 illustrate the three-dimensional graphs of modified Taylor's models for fitting daily median, daily mean and lifetime nymphal productions, respectively. The values of T m indicate that the optimum temperature for the mean (or median) number of nymphs produced by one female per day is about 20°C, but the optimum temperature for RWA reproduction expressed as the total number of nymphs produced by a female in her life time is about 16°C. The differences in optimum temperatures for daily vs. lifetime reproduction occur because the Russian wheat aphid survives significantly longer at lower temperatures. For example, average adult life span under 14.08°C ranges from 25–30 days and from 18 to 23 days under 20.08°C (Ma, Reference Ma1997). Under low temperatures, RWA has more time to reproduce; the result is a greater lifetime production of nymphs per female, even though daily nymphal production is less than under higher temperatures. The Rm values in table 2 state the maximum RWA reproductive rates under optimum temperature conditions; mean nymphs per day, median nymphs per day and total lifetime nymphs per female can reach 3.00, 2.96 and 53.15, respectively, under optimum conditions. When plant growth stage factor is not considered (table 1), the mean and median values for Rm are only slightly smaller, while lifetime nymphal production showed a bigger decline (18%). In addition, after the crop growth stage was introduced in the modified Taylor's model (table 2), the residual mean square (RMS) of model fitting decreased about 15%. This modest reduction indicates that addition of a plant growth stage variable does somewhat contribute to improving the model.
Daily median nymphal production per RWA female vs. temperature and barley plant growth stage, based on the model in table 2.

Daily mean nymphal production per RWA female vs. temperature and barley plant growth stage, based on the model in table 2.

Lifetime nymphal production per RWA female vs. temperature and barley plant growth stage, based on the model in table 2.

Results of fitting models (equation 2) for daily mean, daily median and total lifetime nymphs per RWA female.
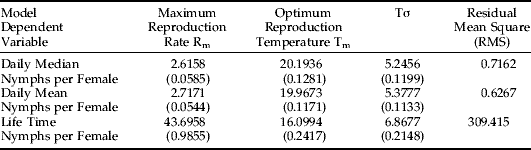
Only temperature effects are included (n=1075).
Numbers inside parentheses are asymptotic standard deviations for model parameters.
The correlation coefficients (absolute values) among estimated parameters range from 0.08 to 0.58. The tolerances of the estimated parameters range from 0.64 to 0.99.
Results of fitting models for daily mean, daily median and total lifetime nymphs per RWA female.
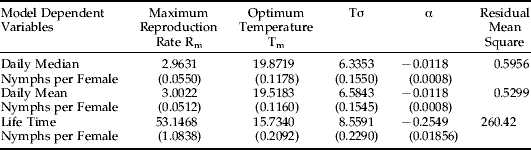
Both temperature and barley plant growth stage are included (n=1075).
Numbers inside parentheses are asymptotic standard deviations for model parameters.
The correlation coefficients (absolute values) among estimated parameters range from 0.004 to 0.62.
The tolerances of the estimated parameters range from 0.30 to 0.91.
Figures 3, 4 and 5 show that the influences of temperature and plant growth stage on daily median, daily mean and lifetime nymphal productions per female are consistent among the three models. Both low and high temperatures negatively affect RWA reproduction. Younger plant growth stages (small numeric values on the Zadoks scale) are always favorable for RWA reproduction. The models predicted that under conditions of extreme temperatures and very old plant stages, RWA do not produce any nymphs. Unfortunately, the graphs only visually can show the combination of extremely low temperature and old plant stage. At extreme conditions, these models can mathematically generate negative values for nymphal production, which is biologically impossible. Therefore, a restriction of nymphal production=0 was imposed on the models in tables 1 and 2.
As defined previously, the reproduction rate formally is computed as the daily mean (or median) nymphal production per female divided by total lifetime nymphal production per female. When the barley plant stage is not included, rates are as follows:

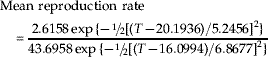
When the plant stage is included, rates are as follows:


Reproduction times (duration of reproduction) are given by the inverses of equations 7–10.
As to whether rate vs. time or mean vs. median should be used, Wagner et al. (Reference Wagner, Wu, Sharpe and Coulson1984) and Kramer et al. (Reference Kramer, Stinner and Hain1991) discussed these questions with respect to insect development. Kramer et al. (Reference Kramer, Stinner and Hain1991) indicated that when fitting developmental models with least-square methods, minimizing the squared error in the rate is not equivalent to minimizing the squared errors in time. Wagner et al. (Reference Wagner, Wu, Sharpe and Coulson1984) argued for the use of medians as the norming constant to obtain normalised developmental times or rates. Wagner et al. (Reference Wagner, Wu, Sharpe and Coulson1984) and Logan & Weber (Reference Logan and Weber1989) seemed to support the use of median time for describing insect development. There might be a practical reason to use mean instead of median when the developmental times are very short. For example, RWA nymphs generally molt every 1–3 days under optimum temperatures. If we calculate the median instar period instead of the mean period, there might be little or no difference among treatments because it is likely two will be median across all treatments. The median only can be an integer, so the precision of parameter estimation by using the median might be poor. A similar situation may exist in insect reproduction. For nymph-producing insect species (where the number of daily nymphs produced usually is smaller than the daily number of eggs laid by egg-laying insects) or for insect species whose developmental duration are short, the mean might be more useful than the median.
Same-shape distribution model of RWA reproduction
Regniere's (Reference Regniere1984) model failed to fit my RWA reproduction rate and time data; the parameter estimation process diverged. The results from fitting the Weibull and Stinner functions are listed in tables 3 and 4, respectively. The Weibull distribution failed to describe the rate distribution, but successfully described reproduction time, whereas the Stinner's hyper-power function fit both reproduction rate and time distributions. The residual mean square in table 3 and 5.4 are quite small. These results support my conjecture that the same-shape distribution approach can be applied to modelling RWA reproduction. Based on RMS (residual mean square), the Weibull reproduction-time model fits my data best and is used to describe RWA reproduction in the simulation model described in Ma (Reference Ma1997).
Parameters of the Weibull Function as RWA same-shape reproduction distribution.

Parameters of Stinner's hyper-power function as RWA same-shape reproduction distribution.

Figure 6 is the graph of the fitted Weibull distribution function to normalized reproduction time; it depicts the same-shape reproduction time distribution as described with Weibull function. Figure 6 illustrates that the same-shape distribution fitted the experimental data very well during the intermediate period of normalized reproduction times. However, at both ends, especially at the ending period, the same-shape distribution did not fit as well, and the residuals were greater. The greater residuals occur at both ends because reproductive heterogeneity at the time extremes was higher than at the intermediate times so that the cumulative probability distributions did not overlap each other perfectly. The same-shape distribution takes the average values at both ends when the same-shape is not perfect. Reproductive heterogeneity among individuals is a biological reality, and it is not surprising that cumulative distributions for different temperatures do not overlap one another exactly. Currently, we do not have other methods that capture individual heterogeneity and temperature effects simultaneously. The same-shape distribution approach is probably the best description now possible.
Same-shape reproduction time model fitted with the Weibull distribution function in table 3.

Rate-summation simulation of RWA reproduction under variable temperatures
The integration of the temperature-dependent mean (or median) reproduction rate model with the temperature-invariant same-shape reproduction distribution model constitutes the rate-summation system for predicting RWA reproduction of under variable temperatures, such as exist in field. If one uses the reproduction rate (time) model that incorporates barley plant stage, then both temperature and crop stage are predictors of the reproduction process. We emphasize that output from the temperature and plant-stage dependent reproductive rate (time) model becomes the input (independent variable) of the same-shape distribution model. Perhaps more accurately stated, it is the accumulated output from the rate (time) model over time-variable temperatures that is the input for the same-shape distribution model. In biological terms for an individual RWA, the same-shape reproduction distribution model gives the probability an aphid has reached her expected lifetime nymphal production, given accumulated time (x). Alternatively, the model expresses the percentage of nymphs produced up to time x over the expected lifetime number of nymphs the aphid can produce. For a population of RWA, model output is the proportion of individuals in the population that already has produced their lifetime nymphal output; it is the proportion of RWA that will contribute no further progeny to the population. The usefulness of the same-shape reproduction model and the rate-summation approach will be clear from the perspective of a simulation model of the RWA population dynamics as is described in our separate paper.
Conclusions and perspective
This study proposes and demonstrates a new modelling approach to predict insect reproduction under variable temperatures and plant growth stage by extending the same-shape distribution model and rate-summation approach, which have been used for modelling insect development since the late 1980s. Besides the extension of the application domain from insect development to reproduction, the paper also extends the original same-shape and rate-summation approach by allowing simultaneously consideration of both temperature and plant growth stage. We argue that the advantages of the original same-shape distribution model and rate-summation approach are preserved when they are extended to the modelling and prediction of insect reproduction. The verification and testing results with the data from 1800 RWA under 25 combinatorial treatments of temperature and barley plant growth stages show that the extensions are very successful and well justified. In the following, we present some additional discussion to argue that the approach should also be applicable to the reproduction modelling of other insects in general.
The extension of Taylor's (Reference Taylor1981) model was straightforward, and we note the following two additional considerations for why we chose this specific model. However, we also think that other widely used non-linear models may be equally or more appropriate, especially when temperature is the only factor to be considered. The two considerations we had are as follows. (i) From our experience with modelling of the RWA development (Ma & Bechinski, Reference Ma and Bechinski2008a), all the major nonlinear models are sufficient in fitting data, but the more complex ones (with more parameters) could be less stable in parameter estimation. On the other hand, all the nonlinear models for development are univariate functions. We need to introduce the second variable, plant growth stage. This is a significant complication, even if we introduce the plant stage as a simple linear function α×S, S is plant stage, and α is the parameter (equation 3) because the change transforms the model from two-dimensional to three-dimensional. Compared with other models, Taylor's model is essentially a modified Gaussian curve and is structurally very robust, which allows us to introduce a second variable, plant stage, without ‘breaking’ the model representation capability of the temperature. (ii) From our experiment observation (25 treatments, 72×25=1800 RWA), without even modelling, we were sure that RWA prefers young plants; and the relationship is at least monotonic, if not linear. So α×S is a very reasonable assumption. The model fitting results and the predictions from the models verified our assumption.
The extension of the same-shape from modelling development to reproduction is relatively more complex than the extension of Taylor's model. In the original same-shape modelling for development (Wagner et al., Reference Wagner, Wu, Sharpe and Coulson1984, Reference Wagner, Wu, Feldman, Sharpe and Coulson1985; Sharpe et al., Reference Sharpe, Curry, DeMichele and Cole1977), it was suggested that the applicability of the same-shape method should depend on the testing of the sameness of the same-shape curves. In other words, the shape of the curves (figs 1 and 2 in this article) is invariant with respect to the temperature regimes, and they can be obtained from each other by sliding along the x-axis. This is a very practical testing method for the applicability and has been widely used in the application of the same-shape approach in insect developmental modelling. However, there are relatively few discussions on why this testing should be sufficient. We, therefore, offer the following discussion on this modelling approach in the general context of both development and reproduction domains.
The idea behind the same-shape distribution approach is actually to smooth the difference between two different temperature regimes, constant under laboratory conditions vs. fluctuating in field, so that the developmental (reproduction) progression under natural conditions can be approximated with the model built from lab data under constant temperatures. There are two key points. (i) By accumulation or summation of rates or times, we obtain a monotonic function, that is, the curves either increase monotonically or just ‘pause’, but never jump down. The underlying mathematical principle is the approximation of the integral of a function with the step function, which is applicable to both linear and nonlinear functions, and actually even to discontinuous functions. (ii) Despite the difference between individuals due to genetic differences and their responses to temperature, the distribution of the developmental times (reproduction amount) in a population should still follow the same trend. The first key point guarantees that the general trend at population-level is properly captured, and the second key point ensures that the individual drift will not affect the general trend. The original method, for experimentally verifying the sameness of the same-shape curves, essentially verifies that the above two key points are satisfied. Obviously, as long as the testing is successful, whether it is the summed-curve for the development or reproduction makes no difference.
We conjecture that there might be a potential difference between reproduction and development in some insects. Developmental rates might be more evenly distributed over time, and the reproduction might be more like a Gaussian distribution over time with middle-aged adults producing more progenies. In other words, there might be a reproduction peak. It might also be the case that young adult insects are more productive, so this curve may not be in the perfect form of a Gaussian distribution. Of course, one may also argue that the insect developmental process could also follow a Gaussian distribution over time, with middle-aged individuals developing fastest. Even if this difference indeed exists, it does not invalidate the same-shape approach as long as the sameness-testing of the same-shape curves succeeds. This is because the accumulation or summation process will always lead to the monotonically increasing rates or times; it will never lead to the decrease of the accumulated values because negative developmental rates or times are biologically impossible. The underlying curve being accumulated may affect the shape of the summation curve; but, as long as the resulting curves are of the same-shape, which is verified by the sameness-testing, the same-shape approach always applies, regardless of development or reproduction.
One may wonder what can be done if the sameness-testing fails. Although it has not been tested in insect modelling, a possible solution is to perform a second-order summation, i.e. summing up the rates or times again, which should smooth the curve. Of course, a formal set of procedures has to be developed to implement the ‘second-order’ approach. The summation or accumulation as a general operator in mathematical modelling has also been used in other disciplines. One successful example is the Grey System theory, where accumulation is used as a very general approach to smooth up curves, which are said to reduce or eliminate noise (errors) in data. In the Grey System theory, the first-order accumulation is often sufficient, but the second-order is also frequently used to improve the model fitting. Grey System theory was pioneered by Deng (Reference Deng1982, Reference Deng1989). The applications of the Grey System theory in insect population dynamics were approached in Ma & Zhang (Reference Ma and Zhang1990) and Ma (Reference Ma1991). The Grey System theory was advanced to study Grey systems, to which our understanding (information) is incomplete, or between completely known (white box or system) and totally unknown (black box system) (Deng, Reference Deng1982, Reference Deng1989). The high-order accumulation approaches used in the Grey System theory should be of general inspiration for devising similar procedure for extending the rate-summation approach discussed in this paper.
In perspective, the modelling approach developed in this paper can be similarly applied to other insects. Its advantages include: (i) a general framework for building insect reproduction prediction model, which is applicable under field variable temperature, based on the data obtained from laboratory demographic research; and (ii) the incorporation of individual variability in reproduction. Furthermore, the same-shape reproduction distribution model and rate-summation approach described in this article have been used as the reproduction module in a survival-analysis-based simulation model for RWA population dynamics (Ma & Bechinski, Reference Ma and Bechinski2008b). The latter application demonstrates the practical significance of the approaches developed in this article in modelling insect population dynamics.
Acknowledgements
Ma wishes to thank Dr James Johnson, Dr Marc Klowden, Dr Joseph McCarffrey, Dr Bahman Shafii, Dr Molly Stock, University of Idaho, and Dr Sharron Quisenberry, Virginia Tech., for their valuable advice and help during his doctoral study when this research was conducted. Special thanks to Mr Vance Nebling for his assistance in laboratory experiments.



