INTRODUCTION
Holocene paleoclimatic and paleoecological records have been developed from many natural archives and collectively highlight the tremendous spatiotemporal variability in the climate of the Earth system (e.g., Chen et al., Reference Chen, Yu, Yang, Ito, Wang, Madsen and Huang2008; Wanner et al., Reference Wanner, Beer, Bütikofer, Crowley, Cubasch, Flückiger and Goosse2008; Baker and Fritz, Reference Baker and Fritz2015; Flantua et al., Reference Flantua, Hooghiemstra, Vuille, Behling, Carson, Gosling and Hoyos2016; Marlon et al., Reference Marlon, Pederson, Nolan, Goring, Shuman, Booth and Bartlein2017). Furthermore, these records demonstrate that climatic variability has been sufficient in magnitude and rate to drive rapid changes in disturbance regimes and ecosystems (e.g., Marchant et al., Reference Marchant, Behling, Berrio, Cleef, Duivenvoorden, Hooghiemstra and Kuhry2001; Marlon et al., Reference Marlon, Bartlein, Daniau, Harrison, Maezumi, Power, Tinner and Vanniére2013; Clifford and Booth, Reference Clifford and Booth2015; Flantua et al., Reference Flantua, Hooghiemstra, Vuille, Behling, Carson, Gosling and Hoyos2016; Calder and Shuman, Reference Calder and Shuman2017). However, the climatic and ecological history of some critically important regions and ecosystems is incompletely described, and this is particularly true in tropical regions, where much of the planet's biodiversity and nearly 3 billion people reside (Cincotta et al., Reference Cincotta, Wisnewski and Engelman2000; Myers et al., Reference Myers, Mittermeier, Mittermeier, da Fonseca and Kent2000; Kummu and Varis, Reference Kummu and Varis2010). One tropical ecosystem type of considerable importance from a hydrologic and biodiversity perspective is the páramo, an ecosystem located above the upper forest line and below the permanent snowline in the Andes of tropical South America and the highlands of Costa Rica (Baruch, Reference Baruch1984). Up to 60% of its plant species are endemic, and together with the surrounding Andean forest, the region may be home to 50% of the plant diversity found in mountain ecosystems (e.g., Cleef, Reference Cleef1981; Vuilleumier and Monasterio, Reference Vuilleumier and Monasterio1986; Luteyn, Reference Luteyn1999; Sklenář et al., Reference Sklenář, Luteyn, Ulloa Ulloa, Jørgensen and Dillon2005). In addition to its high conservation value, the páramo and its watersheds store and supply critical water resources for major Andean rivers and cities (Buytaert et al., Reference Buytaert, Celleri, De Bievre, Cisneros, Wyseure, Deckers and Hofstede2006, Reference Buytaert, Cuesta-Camacho and Tobón2011). High-altitude tropical ecosystems like the páramo are expected to experience increasing temperature in the coming decades, with considerable spatial variability in anticipated precipitation changes (Buytaert et al., Reference Buytaert, Cuesta-Camacho and Tobón2011). Such projections highlight the need for a dense spatial network of paleoclimatic and paleoecological records that can capture the spatial complexity of climatic and ecological variability at a range of temporal scales to better assess model projections, anticipate climate-induced ecological and hydrologic impacts, and assist in management efforts (e.g., Marchant et al., Reference Marchant, Behling, Berrio, Cleef, Duivenvoorden, Hooghiemstra and Kuhry2001).
Pollen studies from the high-elevation Andes have provided detailed records of vegetation history and centennial- to millennial-scale temperature change (e.g., Bosman et al., Reference Bosman, Hooghiemstra and Cleef1994; Marchant et al., Reference Marchant, Behling, Berrio, Cleef, Duivenvoorden, Hooghiemstra and Kuhry2001; Bakker et al., Reference Bakker, Olivera and Hooghiemstra2008; Bogota-A et al., Reference Bogota-A, Groot, Hooghiemstra, Lourens, Van der Linden and Berrio2011; González-Carranza et al., Reference González-Carranza, Hooghiemstra and Vélez2012; Velásquez and Hooghiemstra, Reference Velásquez and Hooghiemstra2013; Giraldo-Giraldo et al., Reference Giraldo-Giraldo, Velásquez-Ruiz and Pardo-Trujillo2017; Munoz et al., Reference Munoz, Gorin, Parra, Velásquez, Lemus, Monsalve-M and Jojoa2017). Paleoenvironmental reconstructions using multiple proxies, however, provide richer information on past environments and potentially greater sensitivity to decadal- and multidecadal-scale climatic and ecological changes (Marlon et al., Reference Marlon, Pederson, Nolan, Goring, Shuman, Booth and Bartlein2017). Furthermore, vegetation-independent proxies for past hydrology and/or temperature have proved extremely valuable for directly assessing vegetation sensitivity to past climatic variability and examining vegetation responses to abrupt climate change (e.g., Booth et al., Reference Booth, Jackson, Sousa, Sullivan, Minckley and Clifford2012). For example, testate amoebae, a group of protozoa that produce decay-resistant shells, have been widely applied as paleoenvironmental proxies in north-temperate and boreal regions (e.g., Woodland et al., Reference Woodland, Charman and Sims1998; Lamentowicz and Mitchell, Reference Lamentowicz and Mitchell2005; Booth, Reference Booth2008; Payne et al., Reference Payne, Charman, Matthews and Eastwood2008; Swindles et al., Reference Swindles, Charman, Roe and Sansum2009; Markel et al., Reference Markel, Booth and Qin2010; Lamarre et al., Reference Lamarre, Magnan, Garneau and Boucher2013; Amesbury et al., Reference Amesbury, Swindles, Bobrov, Charman, Holden, Lamentowicz and Mallon2016) and are a potential source of information on past hydrology and ecology that could be developed from the many peatlands and lakes of the páramo. However, applying testate amoebae and similar approaches is contingent on adequate ecological understanding and calibration of paleoenvironmental proxies, and little work on the calibration of paleoenvironmental indicators other than pollen has been undertaken in the páramo to date.
Testate amoebae occur in a range of environments, including lakes and peatlands, where they have been used for paleoenvironmental reconstruction (e.g., Charman, Reference Charman2001; Mitchell et al., Reference Mitchell, Charman and Warner2008). Studies on peatland-inhabiting testate amoebae have demonstrated that community composition in these habitats is primarily controlled by environmental conditions at the surface of the peatland, particularly substrate moisture and pH (Mitchell et al., Reference Mitchell, Charman and Warner2008). Well-defined ecological niches with respect to substrate moisture and pH have been described empirically and used to develop transfer functions for paleohydrologic reconstruction in many temperate and boreal regions, including portions of Europe (e.g., Woodland et al., Reference Woodland, Charman and Sims1998; Lamentowicz and Mitchell, Reference Lamentowicz and Mitchell2005; Payne et al., Reference Payne, Charman, Matthews and Eastwood2008; Swindles et al., Reference Swindles, Charman, Roe and Sansum2009; Amesbury et al., Reference Amesbury, Swindles, Bobrov, Charman, Holden, Lamentowicz and Mallon2016), North America (e.g., Booth, Reference Booth2008; Markel et al., Reference Markel, Booth and Qin2010; Lamarre et al., Reference Lamarre, Magnan, Garneau and Boucher2013; Swindles et al., Reference Swindles, Amesbury, Turner, Carrivick, Woulds, Raby and Mullan2015), South America (e.g., Van Bellen et al., Reference Van Bellen, Mauquoy, Payne, Roland, Daley, Hughes, Loader, Street-Perrott, Rice and Pancotto2014), New Zealand (Charman, Reference Charman1997; Wilmshurst et al., Reference Wilmshurst, Wiser and Charman2003), and Asia (Qin et al., Reference Qin, Mitchell, Lamentowicz, Payne, Lara, Gu, Huang and Wang2013; Song et al., Reference Song, Li, Wang, Wu and Wu2014; Li et al., Reference Li, Wang, Zhao and Wang2015). However, very few modern calibration studies have focused on tropical ecosystems (Swindles et al., Reference Swindles, Reczuga, Lamentowicz, Raby, Turner, Charman and Gallego-Sala2014), and although testate amoebae have been described from the páramo (Grabandt, Reference Grabandt, Rabassa and Salemme1990; Montoya et al., Reference Montoya, Rull and van Geel2010), species–environment relationships have not been quantitatively explored for transfer function development.
In this study, we investigated the modern ecology of testate amoebae in peatlands of the Colombian páramo to assess their potential use as paleoenvironmental indicators in these ecosystems. Our specific objectives were to (1) assess potential environmental controls on testate amoeba communities in páramo peatlands, (2) develop transfer functions for paleoenvironmental inference, and (3) examine testate amoebae in a peat core spanning the late Holocene. Finally, we use our modern calibration data set to infer past environmental changes from our subfossil data set and compare our inferences to geochemical and pollen records from the same core and a recently published lake sediment record from the region.
STUDY SITES
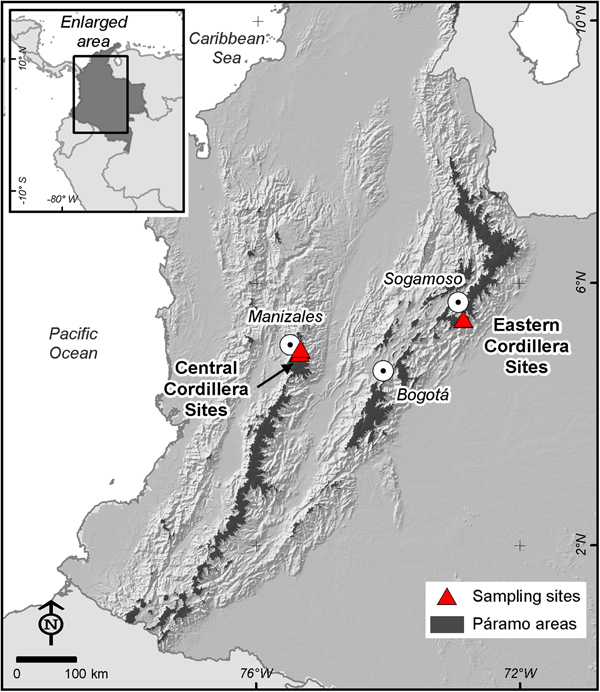
Colombia has three major orogenic belts that support páramo ecosystems: the Western, Central, and Eastern Cordillera. Our study sites for modern sampling were located in the Central and Eastern Cordillera, with four peatlands located near the city of Manizales just north of the Nevado del Ruiz Volcano in the Central Cordillera and one peatland in the Eastern Cordillera near the city of Sogamoso (Fig. 1, Table 1). A peat core was analyzed from the Triunfo peatland, one of our Central Cordillera sites, and was described in more detail by Giraldo-Giraldo et al. (Reference Giraldo-Giraldo, Velásquez-Ruiz and Pardo-Trujillo2017).
(color online) Location of the sampled peatlands in the Central and Eastern Cordillera of Colombia, showing the nearest major cities to our sampling locations and the distribution of páramo in Colombia (data for páramo distribution from Instituto Alexander Von Humboldt [2012]; http://www.siac.gov.co/catalogo-de-mapas).

Studied peatlands and site-specific data.

The Eastern Cordillera of Colombia is a northeast-trending inverted basin where more than 6 km of sediment accumulated during Cretaceous times (Kerr and Tarney, Reference Kerr and Tarney2005; Spikings et al., Reference Spikings, Cochran, Villagomez, van der Lelij, Vallejo, Winker and Beate2015). These sediments include thick sequences of black shales and nearly pure quartz arenites derived from the Guiana craton to the east. Near Lake Tota, a singular, Mio-Pliocene volcanic complex is present, but represents an anomalous occurrence in the deformed, mostly sedimentary pile of the Eastern Cordillera. The Central Cordillera near the Ruiz volcano is composed of a mostly Paleozoic–Mesozoic plutonic–metamorphic complex of continental affinities to the east and mostly Mesozoic–Cenozoic oceanic–affinity volcanic and sedimentary sequences to the west (Gonzalez, Reference Gonzalez2001). These sequences are separated by a north- to northeast-trending suture. The Ruiz volcano and other volcanoes in the Central Cordillera are Pliocene and younger, the result of subduction of the Nazca plate under northwestern South America (Kerr and Tarney, Reference Kerr and Tarney2005; Spikings et al., Reference Spikings, Cochran, Villagomez, van der Lelij, Vallejo, Winker and Beate2015).
In the Colombian Andes the seasonal hydrologic cycle is controlled by the interhemispheric movement of the intertropical convergence zone (ITCZ), superimposed on more local patterns caused by orographic relief, evapotranspiration in the Amazon basin, continent–atmosphere–ocean interactions (i.e., El Niño–Southern Oscillation [ENSO]), and dynamics of the western Colombian wind currents (Mesa et al., Reference Mesa, Poveda and Carvajal1997; Poveda et al., Reference Poveda, Jaramillo, Gil, Quiceno and Mantilla2001; Poveda and Mesa, Reference Poveda and Mesa2004; Flantua et al., Reference Flantua, Hooghiemstra, Vuille, Behling, Carson, Gosling and Hoyos2016). Due to the double annual passage of the ITCZ over the Colombian Andes, the Central Cordillera experiences a bimodal annual cycle with wet seasons in April–May and September–November (Poveda et al., Reference Poveda, Alvarez and Rueda2011). Precipitation exhibits a unimodal peak from June to August on the eastern slopes of the Eastern Cordillera as a result of the convection of humid air masses from the Amazon basin into the Andes (Poveda et al., Reference Poveda, Alvarez and Rueda2011). Over interannual and decadal times scales, ENSO and other ocean–atmosphere phenomena such as the Pacific Decadal Oscillation, North Atlantic Oscillation, and Atlantic Multidecadal Oscillation influence the climate of the region (Poveda et al., Reference Poveda, Vélez, Mesa, Hoyos, Mejía, Barco and Correa2002, Martinez et al., Reference Martinez, Obrochta, Yokoyama and Battarbee2015; Flantua et al., Reference Flantua, Hooghiemstra, Vuille, Behling, Carson, Gosling and Hoyos2016). In the Colombian Andes in particular, ENSO has a strong effect on precipitation, river discharge, and soil moisture (Poveda et al., Reference Poveda, Jaramillo, Gil, Quiceno and Mantilla2001, Reference Poveda, Vélez, Mesa, Hoyos, Mejía, Barco and Correa2002). El Nino events (warm phase) are associated with a decrease in precipitation, a decrease in soil moisture and evapotranspiration, and, consequently, a decrease in riverine discharge in the central region of Colombia (Poveda et al., Reference Poveda, Jaramillo, Gil, Quiceno and Mantilla2001). La Nina events (cold phase) bring the opposite pattern, with intense and abundant rainfall and increased river discharge (Mesa et al., Reference Mesa, Poveda and Carvajal1997; Poveda et al., Reference Poveda, Jaramillo, Gil, Quiceno and Mantilla2001).
All modern sampling sites for testate amoebae were located between 3750 and 4100 m in elevation and were surrounded by páramo vegetation (Table 1). Peatlands were bryophyte dominated, including abundant mosses likely representing species in the genus Breutelia, although many other similar mosses were likely also present. Sphagnum mosses and cushion plants (Plantago rigida) were locally abundant within several of the peatlands. A diversity of other vascular plants were also present, including species of Cyperaceae, Asteraceae, Apiaceae, Rosaceae, and Gunneraceae, although these species rarely dominated the sampling locations. A more detailed vegetation and geologic description of the Triunfo peatland where the peat core was collected can be found in Giraldo-Giraldo et al. (Reference Giraldo-Giraldo, Velásquez-Ruiz and Pardo-Trujillo2017).
METHODS
Field methods
Modern testate amoeba sampling
At each of the five studied peatlands, we collected surface substrate samples for testate amoebae in an effort to capture the full range of moisture and vegetation variability of the site. At locations where moss or moss mixed with low-growing vascular plants occurred, we collected approximately 10 cm3 of the upper 5–7 cm of the moss and associated vegetation. At locations with standing water that lacked vegetation, we collected approximately 10 cm3 of the upper 1–2 cm of the loose substrate. Each sampling location was photographed, and these photographs were later used to quantify the presence or absence of various plant groups at the surface where testate amoebae live as an additional descriptor of the microhabitat. Microhabitat groups included Sphagnum moss, Disterigma sp., cf. Breutelia, Plantago rigida, other mosses, and standing water.
At each sampling location at Triunfo and Laguna Negra, water-table depth, pH, and conductivity were measured. However, our pH meter broke after sampling these two peatlands, and for the remaining sites we could only obtain water-table depth measurements for sampling locations. Water-table depth was measured as distance from the peatland surface to the water table, by digging a small hole and waiting for the water table within the hole to equilibrate with the surrounding peat. Positive values were used to denote water-table depths below the surface of the peat, whereas standing water was recorded as negative values (i.e., higher values indicate drier conditions). Conductivity and pH were measured with an Oakton multiparameter meter, with measurements made on water squeezed from surface moss/substrate for locations without standing water, and measurements taken directly from standing water where present. Measurements were made in this way to record the water-chemistry environment experienced most directly by testate amoebae, which live on the moss water film and on the surface substrate.
Peat-core collection
A 7-m-long peat core was collected with a Russian corer from near the center of the Triunfo peatland in 2012. A pollen record from the upper portion of the core has been previously published (Giraldo-Giraldo et al., Reference Giraldo-Giraldo, Velásquez-Ruiz and Pardo-Trujillo2017). The peatland is located in the Central Cordillera of Colombia at about 3800 m above sea level (m asl); it lies in a depression created by late Quaternary glacial activity and is surrounded by escarpments of andesitic and basaltic volcanic deposits (Herd, Reference Herd1982). The peatland is fed hydrologically by direct precipitation and runoff from the surrounding volcanic deposits. The drainage basin is characterized by páramo vegetation, although livestock grazing and other human activities have modified the natural vegetation patterns. The peat core was collected from Triunfo peatland in 50-cm-long increments, and individual core drives were wrapped in the field and sent to the Institute for Stratigraphic Research at Universidad de Caldas for cold storage and subsampling.
Laboratory methods
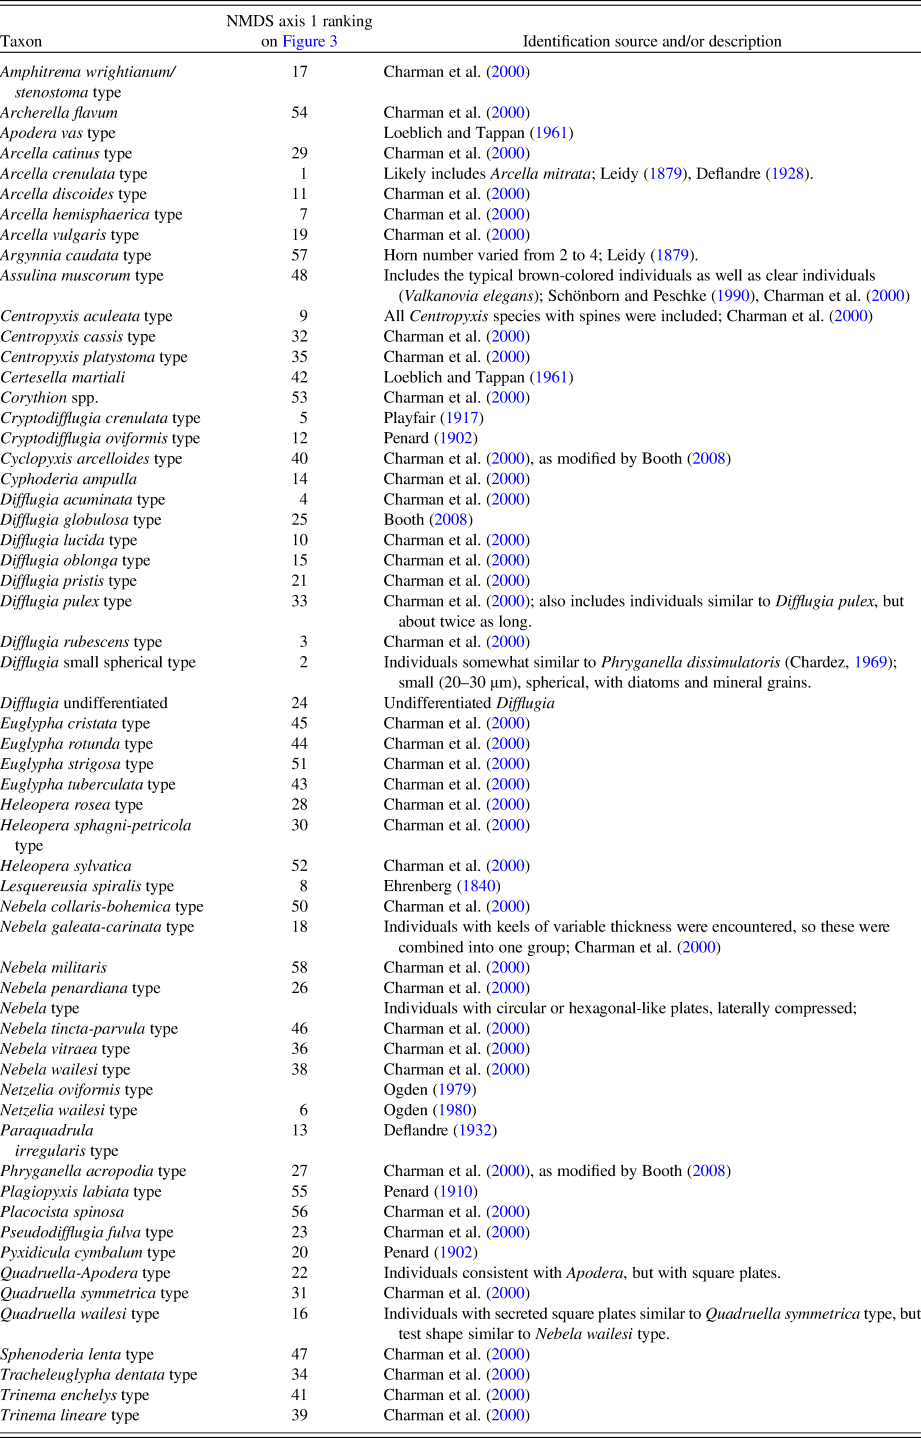
Testate amoebae were isolated from both modern and subfossil samples using the method of Booth et al. (Reference Booth, Lamentowicz and Charman2010). For peat-core analyses, approximately 1 cm3 of peat was collected from 1-cm spanning peat slices at approximately 4–6 cm increments along the core, except within thick tephra layers lacking in organic matter. Both modern and subfossil samples were boiled in distilled water for 10 minutes and washed through 355-μm- and 15-μm-diameter sieves, and the material caught in the 15-μm sieve was stored in glycerol. Microscopic slides were prepared from these residues, and all testate amoebae were identified and tallied under a light microscope at 400× magnification until a minimum of 200 or 100 individuals was obtained for the modern and subfossil samples, respectively. Identifications were made using various guides and literature sources (Table 2). For a few fossil samples, count totals of 100 individuals were not obtainable, and only fossil samples with at least 50 tallied testate amoebae were included in our interpretation and analyses. The relative abundance of each taxon was calculated as a percent of the total number of testate amoeba counted in the sample.
Testate amoeba taxa identified in modern and subfossil samples from the studied páramo peatlands, with information on taxonomy and identification. Ranking along the nonmetric multidimensional scaling (NMDS) axis 1 gradient is also shown, with higher numbers generally indicating greater abundance in drier, more acidic habitats and lower numbers generally indicating higher abundance in wetter, less acidic habitats. Taxa without a ranking occurred in fewer than four samples and were excluded from analyses.

Sediment samples for geochemical analyses were dried and crushed with a mortar and pestle before geochemical analysis. Geochemical analyses, including total carbon, total inorganic carbon, total nitrogen, δ15N, and δ13C, were performed on core samples at the Light Stable Isotope Mass Spectrometer Laboratory in the Department of Geological Sciences at the University of Florida. Total carbon and total nitrogen were measured using a Carlo Erba NA 1500 CNS elemental analyzer. Inorganic carbon was determined by acidification followed by coulometric titration using an AutoMate Prep Device coupled with a UIC 5014 CO2 coulometer. Percent organic carbon was calculated by subtraction of inorganic carbon from total carbon. Samples for carbon stable-isotope analysis of organic matter were treated with 2N HCl to remove any carbonate and then washed with distilled water to remove chloride. Approximately 50 mg of carbonate-free bulk sediment was loaded into tin sample capsules for carbon isotopes and placed in a 50-position automated carousel on the elemental analyzer. Nonacidified samples were used for nitrogen isotopes. Combustion gases were carried in a helium stream through a Conflo II interface to a Thermo Electron DeltaV Advantage isotope ratio mass spectrometer. All carbon and nitrogen isotope results are reported in per mil (‰) and expressed in standard delta notation. Carbon isotopes are reported relative to VPDB while nitrogen isotopes are reported relative to AIR.
Analytical methods
To describe patterns of variation in testate amoeba communities and explore relationships between community composition and environmental variables, we used nonmetric multidimensional scaling (NMDS) (Kruskal, Reference Kruskal1964; McCune et al., Reference McCune, Grace and Urban2002). NMDS does not make assumptions regarding underlying species distributions along compositional gradients, making it particularly well suited to ecological community data. Outliers and rare taxa can have a large influence on ordination techniques, and to reduce the effect of rare taxa that are likely not well ecologically described in our data set, we excluded those taxa present in less than four modern samples from all analyses. Community data were square-root transformed before ordination analyses, and all analyses were performed using PC-ORD software (McCune and Mefford, Reference McCune and Mefford2011)
Transfer functions were developed using a variety of commonly used models, including weighted averaging (weighted average [WA]), partial least squares (PLS), weighted-averaging partial least squares (WA-PLS), and modern analog technique (MAT). These models were chosen because they have been used successfully to develop transfer functions from testate amoeba data in other studies (e.g., Woodland et al., Reference Woodland, Charman and Sims1998; Booth, Reference Booth2008; Lamentowicz et al., Reference Lamentowicz, Lamentowicz and Gąbka2008; Amesbury et al., Reference Amesbury, Swindles, Bobrov, Charman, Holden, Lamentowicz and Mallon2016; Swindles et al., Reference Swindles, Lamentowicz, Reczuga and Galloway2016). Assessment of transfer function performance was done using standard cross-validation approaches, including bootstrapping and leave-one-site-out procedures, and all transfer function analyses were carried out in the software package C2 (Juggins, Reference Juggins2003).
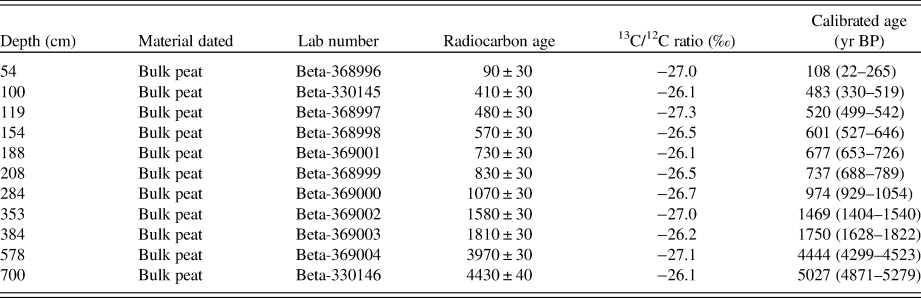
Standard methods were used to radiocarbon date and examine the paleoecological and geochemical record from the peat core. An age-depth model was built using a Bayesian approach, using 11 radiocarbon dates obtained on bulk sediment samples, the top of the core, and the default priors of Bacon software (Blaauw and Christen, Reference Blaauw and Christen2011). The composition of subfossil testate amoeba assemblages was described using cluster analysis approaches and the CONISS software package (Grimm, Reference Grimm1987).
RESULTS
Modern ecology of testate amoebae
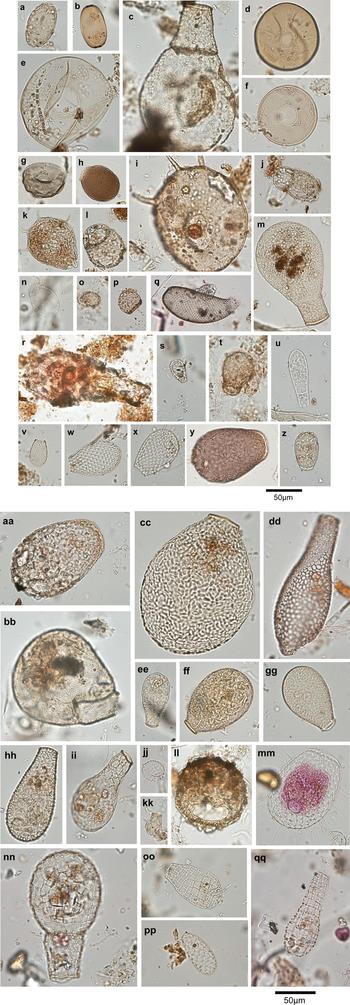
A total of 59 testate amoeba taxa were identified from 96 modern samples collected within the five peatlands. The most abundant taxa included Assulina muscorum, Euglypha tuberculata type, Corythion spp., Euglypha strigosa type, Pseudodifflugia fulva type, Centropyxis aculeata type, and Euglypha rotunda type (Fig. 2). Taxa in less than four samples, including Apodera vas, Microgromia type, Hyalosphenia minuta, Netzelia oviformis, and likely Nebela species, were excluded from further quantitative analyses. Páramo testate amoebae included many that are commonly found in temperate and boreal regions of the Northern and Southern Hemispheres, although taxa restricted to the Southern Hemisphere were also encountered (e.g., Certesella martiali, Apodera vas), as well as a few unusual taxa (Fig. 2, Table 2). A two-dimensional NMDS ordination (final stress = 15.5) represented about 87% of the compositional variability in the data set and revealed considerable overlap in testate amoeba community composition among the five peatlands (Fig. 3). The primary and secondary compositional gradients, as revealed by axis 1 and axis 2 of the NMDS ordination, represented 70% and 17% of the variability in the data set, respectively (Fig. 3).
(color online) Photomicrographs of abundant and unusual testate amoebae in the modern samples from the Colombian páramo. (a) Amphitrema wrightianum/stenostoma type, (b) Archellera flavum, (c) Apodera vas type, (d) Arcella catinus type, (e) Arcella crenulata type, (f) Arcella discoides type, (g) Arcella hemispherica type, (h) Assulina muscorum type, (i) Centropyxis aculeata type, (j) Centropyxis platystoma type, (k) Argynnia caudata type, (l) Centropyxis cassis type, (m) Certesella martiali, (n) Corythion spp., (o) Cryptodifflugia crenulata type, (p) Cyclopyxis arcelloides type, (q) Cyphodera ampulla, (r) Difflugia oblonga type, (s) Difflugia pulex type, (t) Difflugia rubescens type, (u) Euglypha cristata type, (v) Euglypha rotunda type, (w) Euglypha strigosa type, (x) Euglypha tuberculata type, (y) Heleopera rosea type, (z) Heleopera sylvatica, (aa) Heleopera sphagni-petricola type, (bb) Lesquereusia spiralis type, (cc) Nebela collaris-bohemica type, (dd) Nebela galeata type, (ee) Nebela militaris, (ff) Nebela parvula, (gg) Nebela tincta, (hh) Nebela penardiana type, (ii) Nebela wailesi type, (jj) Paraquadrula irregularis type, (kk) Pseudodifflugia fulva type, (ll) Plagiopyxis labiata type, (mm) Placocista spinosa, (nn) Quadruella-Apodera type, (oo) Quadruella symmetrica type, (pp) Tracheleuglypha dentata type, (qq) Quadruella wailesi type.

Nonmetric multidimensional ordination (NMDS) of modern testate amoeba communities of the Colombian páramo, showing the distributions of samples and species in the top two panels (species numbers are defined in Table 2). Axis 1 relationships with habitat and environmental variables are shown in the bottom three panels. Presence/absence data for vegetation and standing water are summarized with box plots in the center panel, showing the full range of axis 1 scores for samples (dots), 75% range (whiskers), 25% range (boxes), and median. The main gradient of testate amoeba compositional change is correlated with both pH and water-table depth.

Correlations among the NMDS axes and measured environmental variables indicated significant relationships between community composition and both pH and water-table depth (Fig. 3). For the samples for which pH was measured (n = 43) the correlation with NMDS axis 1 was particularly strong (r 2 = 0.76, p < 0.0001). When the same reduced data set was used, correlations between water-table depth and NMDS axis 1 were also significant but weaker (r 2 = 0.34, p < 0.0001), and a similar correlation between NMDS axis 1 and water-table depth was found using the entire data set (r 2 = 0.35, p < 0.0001). No significant correlation was found between conductivity and NMDS axis scores. Water-table depth and pH measurements were also correlated with each other, with drier habitats tending to be more acidic and wetter habitats generally more circumneutral (r 2 = 0.41, p < 0.0001). Microhabitats of the samples, as represented by presence/absence data for dominant plant groups and standing water, also tended to array themselves along axis 1 according to the pH and water-table gradient (Fig. 3). Optimal water-table depth and pH for individual testate amoeba taxa further highlight the correlation between water-table depth and pH, with taxa such as Argynnia caudata type, Nebela militaris, and Plagiopyxis labiata type more abundant on drier, acidic substrates, and taxa such as Quadruella wailesi type, Difflugia rubescens type, and Paraquadrula irregularis more common in wetter, more circumneutral habitats (Fig. 4).
Water-table and pH optima (dots) and tolerances (gray lines) for testate amoeba taxa. Numbers for taxa are defined in Table 2 and correspond to the position of each taxon along the axis 1 community gradient shown in Figure 3. The five taxa on the right were not encountered at sites where pH was measured.

Transfer function development and cross-validation
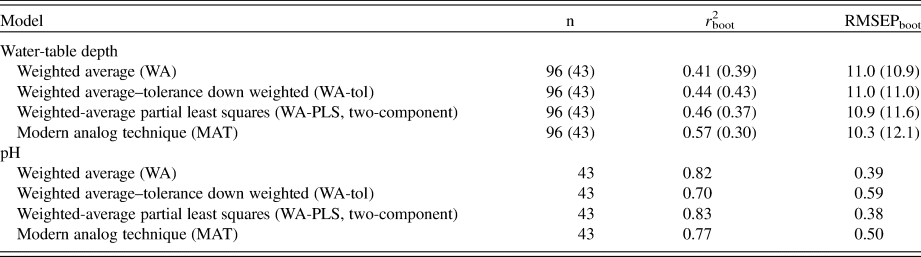
Because pH and water-table depth showed significant relationships with testate amoeba community composition, transfer functions for these variables were developed and performance was assessed through bootstrapped cross-validation (n = 1000). Performance among the models was relatively similar (Table 3), and therefore we used the commonly applied WA-PLS (two-component) model for all subsequent validation and reconstructions (Fig. 5). Water-table depth and pH were both successfully estimated from testate amoeba community composition, although cross-validation for pH indicated better performance for this variable (Fig. 5). To examine transfer function performance as a function of microhabitat, we also performed transfer function development and cross-validation within each vegetation/microhabitat grouping. Interestingly, within Sphagnum microhabitats, transfer function performance for water-table depth was better than performance for pH, while pH transfer functions outperformed water-table depth transfer functions in all other microhabitats (Fig. 5).
Bootstrapped (n = 1000) cross-validation for transfer functions for (a) water-table depth and (b) pH, comparing measured and predicted values to demonstrate the ability to estimate these variables from testate amoeba community composition. Cross-validation for transfer functions developed independently for each vegetation/habitat grouping are also shown to the right. The transfer function for pH outperforms water-table depth, except for within Sphagnum samples. RMSEP, root-mean-square error of prediction.

Cross-validation statistics showing performance of transfer functions for water-table depth and pH using a range of commonly applied transfer function models. The bootstrapped (n = 1000) root-mean-square error of prediction (RMSEP) and r 2 values indicate similar performance of the models. Values in parentheses provide statistics for water-table depth using only the samples with pH measurements.

In addition, because spatial autocorrelation can lead to unrealistic estimates of uncertainty (e.g., Payne et al., Reference Payne, Telford, Blackford, Blundell, Booth, Charman and Lamentowicz2012), we examined the results of sequentially leaving each site out of the transfer function model and using the resulting models to infer the environmental variables at each omitted site (Fig. 6). For water-table depth, uncertainty estimates were only slightly larger using this approach (Fig. 6a). The effects of spatial autocorrelation were difficult to fully assess for pH, because there were only two sites where pH measurements were obtained, and one of these sites (Laguna Negra) only captured about half of the pH gradient recorded at the other (Triunfo) (Fig. 6b).
Leave one-site-out cross-validation of transfer functions for (a) water-table depth and (b) pH to assess the potential impact of spatial autocorrelation on performance. RMSEP, root-mean-square error of prediction.

Paleoecological record and transfer function application
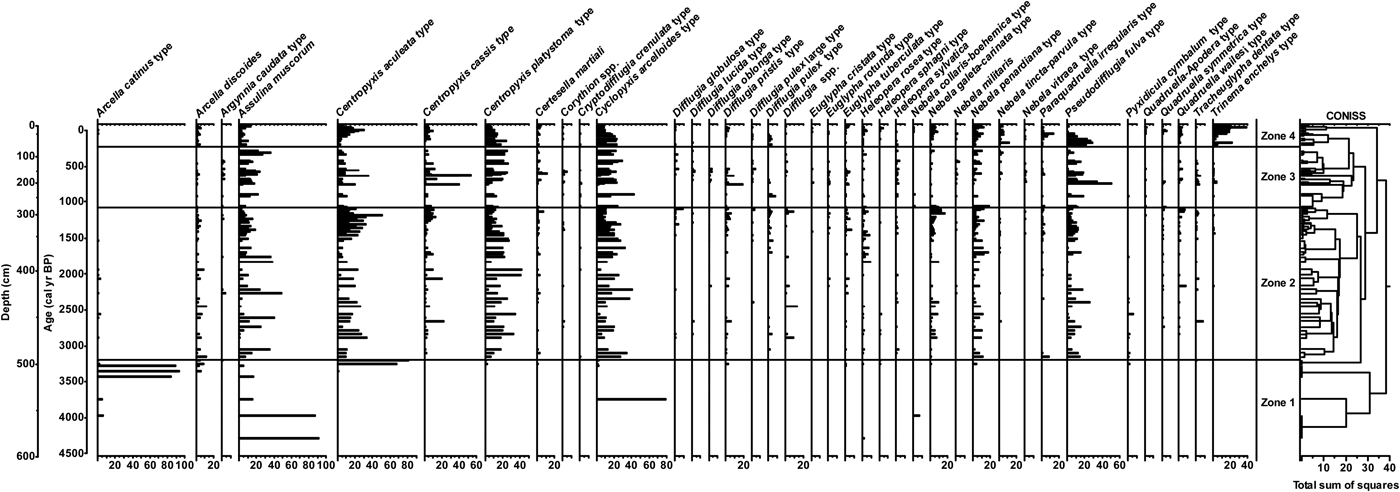
The peat core was composed of fibric peat interbedded with ash and lapilli layers (Cardona and Monroy, Reference Cardona and Monroy2015). An age-depth model developed from 11 14C dates (Table 4) and the surface of the peat core indicates average deposition times of ~7.5 yr/cm, and accumulation spanning the past 5000 years (Fig. 7). Testate amoebae were analyzed to a depth of 580 cm, or approximately the past 4300 yr, below which sufficient count totals were not obtainable. Low count totals prevented analyses at some depths between 500 and 580 cm as well. A total of 53 testate amoeba taxa were identified from the core analyses, with a few major changes in community composition over the duration of the record, particularly in the lower 100 cm, as well as long intervals of relatively stable community composition (Fig. 8). Some dominant taxa included Cyclopyxis arcelloides type, Centropyxis aculeata type, Centropyxis platystoma type, Assulina muscorum, Pseudodifflugia fulva type, Centropyxis cassis type, and Nebela penardiana (Fig. 8).
Age–depth model for the Triunfo peatland core, with the gray line indicating the model with highest probability and the dashed lines indicating the 95% confidence interval. Black vertical lines show the 2-sigma range of calibrated radiocarbon dates used in the model. The distribution of tephra-rich layers and the testate amoeba zonation from Figure 8 is shown to the right.

Relative abundance of testate amoebae plotted against depth and age in the Triunfo peatland core. Data are plotted on a linear depth scale, and ages are interpolated. Stratigraphically constrained cluster analysis, shown on the right side of the diagram, was used to guide the delineation of zones.
Radiocarbon dates and sample-specific information from the Triunfo peat core. Calibrated age is the date with highest probability followed by the 2-sigma range. Radiocarbon dates were calibrated using Calib 7.1 software and IntCal13 (Stuiver et al. Reference Stuiver, Reimer and Reimer2018).

Four biostratigraphic zones were identified using the guidance provided by stratigraphically constrained cluster analysis to facilitate discussion of the major changes in the record. Zone 1 (~4300–3200 cal yr BP) contained exceptionally variable testate amoeba communities, with abundant Assulina muscorum and Cyclopyxis arcelloides type in the lowermost samples, abundant Arcella catinus type in samples in the middle of the zone, and very abundant Centropyxis aculeata type in the upper two samples of the zone. Some Arcella catinus type individuals were large enough to be attributable to Arcella artocrea, although considerable numbers were of intermediate size between the typical size ranges of Arcella catinus and Arcella artocrea. Communities of Zone 2 (~3200–1100 cal yr BP) and Zone 3 (~1200–250 cal yr BP) had higher diversity than Zone 1 (~250 cal yr BP to present), with variable amounts of Cyclopyxis arcelloides type, Centropyxis spp., Assulina muscorum, and Pseudodifflugia fulva type characterizing the two zones. Trinema enchelys type increased in Zone 4, along with corresponding declines in other taxa, particularly Pseudodifflugia fulva type (Fig. 8).
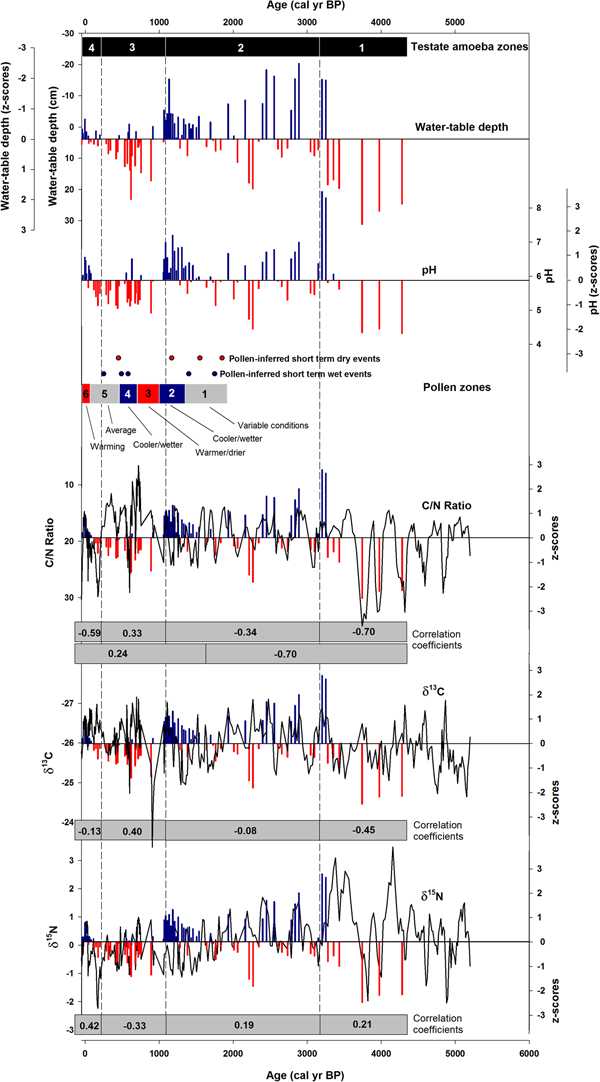
Reconstructed pH and water-table depths based on changes in testate amoeba community composition were similar to each other, which was not surprising, given the correlation between pH and water-table depth in the modern samples (Fig. 9). Inferred environmental conditions from Zone 1 samples were the driest and most acidic of the reconstruction, with the exception of the upper two samples dominated by Centropyxis aculeata type, which had wet and circumneutral pH estimates. Zone 2 reconstructions were less variable than those of Zone 4, but contained both dry/acidic and wet/circumneutral estimates. Most water-table and pH estimates from Zone 3 samples were drier than average and slightly acidic. Wetter and more neutral pH conditions occurred within Zone 4. The pH and water-table depth reconstructions show a correspondence with C/N measurements from the same samples, at least for much of the record, but less association with carbon and nitrogen isotope measurements (Fig. 9). For example, the coherence between the C/N measurements and the reconstructions is relatively good between about 1200 and 4300 cal yr BP (n = 34, r = −0.70); however, the correspondence is weak from about 1200 to 250 cal yr BP. Interestingly, during this time period of lower overall correspondence between testate amoeba–inferred estimates and C/N measurements, the two largest dry/acidic anomalies are associated with the two most positive δ13C values (Fig. 9). Little obvious relationship between δ15N values and testate amoeba–inferred conditions exists for most the record, although similar trends occur in the last 200 yr (Fig. 9).
(color online) Comparison of water-table depth and pH reconstructions based on testate amoebae, pollen, and geochemical measurements from the peat core, including C/N ratios, δ13C, and δ15N. Correlation coefficients between testate amoeba–inferred paleoenvironmental conditions (average z-scores of pH and water-table depth reconstructions) and the geochemical measurements are shown for each zone.

Some correspondence exists between the reconstructions and the pollen-based interpretation of temperature and moisture changes for the past 1900 yr (Fig. 9), although the testate amoeba data suggest that not all pollen-inferred warmer time periods were necessarily drier (Giraldo-Giraldo et al., Reference Giraldo-Giraldo, Velásquez-Ruiz and Pardo-Trujillo2017). Both pollen and testate amoebae suggest that a shift to more persistently wet conditions occurred at about 1300 cal yr BP, and this was followed by dry conditions after about 1000 cal yr BP (Fig. 9). However, although pollen data suggest cooler and perhaps wetter conditions from about 700 to 400 cal yr BP, the testate amoeba record suggests moderately dry and slightly acidic conditions on the peatland surface (Fig. 9). Testate amoeba data also suggest that the warming during the past century has been associated with somewhat wetter and less acidic conditions.
DISCUSSION
Testate amoeba ecology and potential for environmental inference
Although testate amoebae have been widely used as surface-moisture proxies in north-temperate and boreal peatlands, the ecology of testate amoebae in tropical peatlands is comparably less well understood. In tropical South America, recent work in the lowland Amazon basin demonstrated good preservation potential and the sensitivity of community composition to surface-moisture conditions (Swindles et al., Reference Swindles, Reczuga, Lamentowicz, Raby, Turner, Charman and Gallego-Sala2014, Reference Swindles, Lamentowicz, Reczuga and Galloway2016, Reference Swindles, Kelly, Roucoux and Lawson2018a, Reference Swindles, Morris, Whitney, Galloway, Gatka, Gallego-Sala and Macumber2018b). Our results indicate similarly good potential for using testate amoebae as paleoenvironmental indicators within peatlands of the páramo, suggesting that the technique may have utility across much of the tropical elevation gradient. Testate amoebae could provide a consistent proxy type for use in studies of Holocene hydrologic change and peatland development and, when applied alongside other proxies, provide insight into long-term interactions among vegetation, temperature, and hydrology.
Páramo testate amoebae have not been previously studied in a systematic and quantitative way. The only previous examinations of testate amoebae within páramo wetlands were part of efforts to describe the elevational distribution of non-pollen palynomorphs (e.g., algal, fungi, and zoological remains) in surface samples from the Eastern Cordillera of Colombia (Grabandt, Reference Grabandt, Rabassa and Salemme1990) and the Venezuelan Andes (Montoya et al., Reference Montoya, Rull and van Geel2010). These studies noted the high overall abundance of testate amoebae and made some inferences regarding distribution, including, for example, that Arcella were more common in the páramo and superpáramo zones than at other elevations and that Archerella flavum was restricted to Sphagnum habitats (Grabandt, Reference Grabandt, Rabassa and Salemme1990; Montoya et al., Reference Montoya, Rull and van Geel2010). However, no local hydrologic or water-chemistry data were collected in these studies; chemical treatments were applied to the surface samples, which likely removed taxa from the analyses; and taxonomic precision was limited. Our modern testate amoeba data set provides baseline information of species–environment relations within peatlands of the páramo and demonstrates that testate amoeba communities of peatlands in the region are sensitive to local hydrology and water chemistry, similar to peatlands elsewhere.
Our results from two peatlands indicate that pH may have a stronger relationship with testate amoeba community composition than water-table depth (Fig. 3); however, sampling from more sites is needed to confirm this pattern. In Northern Hemisphere studies of relatively nutrient-rich peatlands, pH has sometimes been identified as a more important control than surface moisture on testate amoeba community composition, particularly at more minerotrophic locations with standing water (Booth, Reference Booth2001; Opravilova and Hajek, Reference Opravilova and Hajek2006; Markel et al., Reference Markel, Booth and Qin2010). The sampled páramo peatlands had a broad range of pH values (3.9–6.8), similar to the poor-to-rich fen gradient in other regions. Interestingly, transfer functions for water-table depth outperformed those for pH when only Sphagnum samples were included, suggesting that when local conditions are more oligotrophic, water-table depth is a more proximal control on community composition (Fig. 5). However, because pH and water-table depth measurements were correlated (r 2 = 0.41), a simple interpretation of the relative strength of surface-moisture versus pH is difficult. Furthermore, pH may be a better indicator of long-term surface-moisture conditions within the mosses or substrate surface than the measurements of water-table depth made on the day of sampling. Until further sampling and measurements can be done at a range of sites to more fully describe the pH–water table environmental space of páramo peatlands, we interpret testate amoeba community composition to be related to the dual and correlated influence of pH and surface moisture on the overall surface microenvironment. The potential influence of two correlated variables on testate amoeba community composition suggests caution in the interpretation of down-core reconstructions (Juggins, Reference Juggins2013), as it is possible that the relationship between pH and water-table depth has changed through time. A larger spatial array of sampling sites will likely allow for assessment of the relative influence of the two variables on páramo testate amoebae, as it has elsewhere (e.g., Amesbury et al., Reference Amesbury, Swindles, Bobrov, Charman, Holden, Lamentowicz and Mallon2016), and improve the robustness and uncertainty estimates of reconstructions.
The transfer function for water-table depth also notably decreases in its predictive ability on the dry side of the gradient, with similar estimates of water-table depth for samples with measured water-table depths greater than about 30 cm from the peatland surface (Fig. 5a). Interestingly, pH estimates do not show the same degree of decreased performance on the circumneutral side of the gradient, although performance is still reduced (Fig. 5b). pH may better reflect the annual microenvironment of the peatland surface experienced by testate amoebae at these drier sites. However, the patterns indicate that water-table depth reconstructions deeper than a threshold of about 30 cm do not necessarily indicate increasingly dry conditions at the surface, and interpretation of fossil reconstructions should reflect this decreased performance on the dry side of the gradient.
Paleoenvironmental reconstruction at Triunfo peatland
Pollen analyses on the Triunfo core have been performed on the last 1900 yr of the record, and reveal that the site has been surrounded by páramo vegetation during this entire time and that the local wetland vegetation has been dominated by many of the same taxa that are present today (Giraldo-Giraldo et al., 2018). Although the relative abundance of wetland pollen taxa has been used to qualitatively discuss potential moisture changes, our reconstructions provide more direct estimates of pH and hydrology. Water-table depth and pH reconstructions based on the testate amoeba record indicate changes between standing water and subsurface water tables throughout much of the past 4300 yr. Before 3200 cal yr BP, reconstructions indicate dry and acidic conditions at the coring site. An abrupt increase in water levels and associated increase in pH occurred at 3200 cal yr BP, and then variable conditions occurred from 3200 cal yr BP until about 1000 cal yr BP. Drier and more acidic conditions became more common after 1000 cal yr BP, a pattern also evident in the pollen data (Fig. 9). Over the past century or two, when pollen data indicate a warming trend, environmental conditions at the surface of the peatland have generally become wetter and less acidic. These changes in both the mean state and variability of the reconstructions correspond with the broad changes in testate amoeba community composition reflected in the stratigraphic zones (Fig. 9).
The correlation between testate amoeba–based environmental reconstructions and the C/N ratio of bulk peat samples from 4300 to 1200 cal yr BP provides additional support for the testate amoeba–based paleohydrologic inferences during this time window (Fig. 9). Given that water-table depth reconstructions indicate shifts between standing water and subsurface water levels, the relative contribution of terrestrial and algal-derived organic matter to the sediments would be expected to change during these water-level changes. In lake ecosystems, C/N ratios greater than or less than 15 are often interpreted as reflecting higher inputs of terrestrial- or algal-derived organic matter, respectively (Meyers and Ishiwatari, Reference Meyers and Ishiwatari1993). Although carbon inputs from wetland plants would have continued at Triunfo even during periods of standing water, the relative contribution of algal carbon would likely have increased during wetter time periods with standing water. Algae and biofilms are very abundant in the pools on the surface of the peatland today. However, little correlation exists between C/N and the testate amoeba reconstruction during the interval between 1200 and 250 cal yr BP. If the testate amoeba reconstruction is correct, this time period was associated with mostly dry and acidic conditions, and the lack of any standing water for long periods of time would have limited algal carbon contributions. Surprisingly, however, the C/N ratios are the lowest of the record and are also quite variable. The time period from about 1200 to 500 cal yr BP contained abundant tephra, including a series of closely spaced, thick tephra deposits (Fig. 6). How ecological and biogeochemical dynamics would have been impacted by repeated deposition of large amounts of tephra is unclear, but abundant tephra-derived minerals like silica may have stimulated algal productivity, decreased terrestrial-derived carbon from wetland plants via disturbance, or impacted testate amoebae. Despite a few studies in northern peatlands (Payne and Blackford, Reference Payne and Blackford2008; Hughes et al., Reference Hughes, Mallon, Brown, Essex, Stanford and Hotes2013), impacts of tephra deposition are still not well understood.
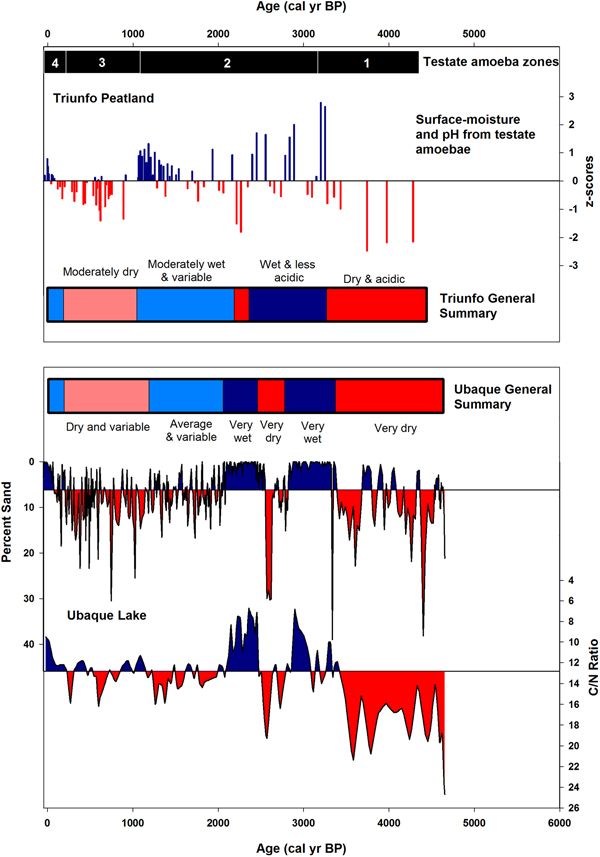
More research is needed to assess the relationship between climatic variability and páramo peatland hydrology, as well as the potential role of nonclimatic effects on hydrology. However, regional-scale climate changes likely drove the largest-magnitude fluctuations in the Triunfo reconstruction. For example, the nearest high-resolution hydrologic reconstruction is from Lake Ubaque (2070 m asl) which is located in the Eastern Cordillera about 160 km east of the Triunfo peatland. C/N ratios and percent sand in this record have been interpreted as reflecting frontal slope hydroclimatic variability along the Eastern Cordillera (Bird et al., Reference Bird, Rudloff, Escobar, Gilhooly, Correa-Metrio, Vélez and Polissar2018). The record contains an abrupt shift from drier to wetter conditions at about 3200 cal BP, very similar to the major transition in testate amoeba communities and inferred environmental conditions at Triunfo (Fig. 10). Furthermore, although the regions might be expected to record different climates at some time scales (Marchant et al., Reference Marchant, Behling, Berrio, Cleef, Duivenvoorden, Hooghiemstra and Kuhry2001; Bird et al., Reference Bird, Rudloff, Escobar, Gilhooly, Correa-Metrio, Vélez and Polissar2018), both records suggest some of the wettest time periods of the late Holocene between about 3200 and 2200 cal BP and drier conditions after this time (Fig. 10). In the last 200 yr, both sites also have experienced a wetting trend.
(color online) Comparison of the Triunfo peatland testate amoeba reconstruction with a lake-level record from Lake Ubaque (Bird et al., Reference Bird, Rudloff, Escobar, Gilhooly, Correa-Metrio, Vélez and Polissar2018). All proxies are arranged so that downward changes are indicative of drier conditions. Conditions wetter and drier than the long-term average are shown in blue and red, respectively. Qualitative summaries of the record are also shown for comparison.

In summary, our research results attest to the potential of using testate amoebae in peatlands of the páramo to reconstruct surface-moisture and pH changes. Testate amoebae are of particular value to high-resolution studies because their short generation time and rapid response to environmental change (e.g., Koenig et al., Reference Koenig, Schwendener, Mulot and Mitchell2017) make them highly sensitive to decadal-scale changes in peatland hydrology (e.g., Booth, Reference Booth2010). Although testate amoebae are widely used as proxies in north-temperate and boreal ecosystems, our work demonstrates that testate amoebae are useful paleohydrologic indicators in the páramo, where they are well preserved in peatland deposits. In combination with other recent ecological and paleoecological studies of testate amoebae in lowland tropical peatlands (Swindles et al., Reference Swindles, Reczuga, Lamentowicz, Raby, Turner, Charman and Gallego-Sala2014, Reference Swindles, Lamentowicz, Reczuga and Galloway2016, Reference Swindles, Kelly, Roucoux and Lawson2018a, Reference Swindles, Morris, Whitney, Galloway, Gatka, Gallego-Sala and Macumber2018b), our results suggest that testate amoebae could potentially be applied across a broad elevation gradient to address hydrologic and climatological questions in topographically heterogeneous tropical regions, particularly when used as part of multiproxy studies.
ACKNOWLEDGMENTS
Fieldwork and sample collection costs were supported by a Lehigh University Faculty Grant for International Connections to RKB. BL and ZW were supported during their work on this project by a South China Normal University Grant for Excellent Students Visiting and Studying Abroad, which allowed them to reside at Lehigh University for 6 months. Fieldwork, sample collection, and geochemistry analysis were partially covered by a grant from the Inter-American Institute for Global Change Research (CRN3038) awarded to JE, which was supported by the U.S. National Science Foundation (GEO-1128040). JE also was partially funded by the Canadian Queen Elizabeth II Diamond Jubilee Advanced Scholar Program (QES-AS), a partnership among universities in Canada, the Rideau Hall Foundation, and the Community Foundations of Canada. The QES-AS was made possible with financial support from the International Development Research Centre and the Social Science and Humanities Research Council. All authors thank Mark Brenner, Felipe Velasco, Diego Felipe Vallejo, and Raul Andres Trejo for their help in the field. The article was improved by constructive feedback from Henry Hooghiemstra and Graeme Swindles.