Like wines, for election forecasting there are some good years and then there are some not so good years. The 2014 vintage of PS election forecasts, now aged past runoffs and recounts, ranks among the more successful of years.
In the October 2014 issue of PS, five forecasters or teams of forecasters published their predictions of the 2014 midterm congressional elections. Each predicted partisan seat changes in the US House and three of the five also predicted seat changes in the US Senate. Each of the forecasts was made at the end of August, between 9 and 12 weeks before Election Day.
With the 114th Congress now sworn into office, it is time to step back and evaluate how well the forecasts performed. In this re-cap, the forecasters offer their evaluations of their predictions. Before reviewing the performance of each of the individual models, however, a few thoughts about the general performance in 2014 of the PS forecasts are in order.
First, as a group, the House forecasts were quite accurate. Republicans gained 13 seats in the House. Their majority increased from 234 following the 2012 election to 247 members in the new Congress. Because their numbers for a Republican majority were already high, making gains more difficult, this outcome could be characterized as a wave (or mini-wave) election for Republicans—and the forecasters pretty well caught the wave. The median forecast predicted Republicans to gain 14 seats, only one seat off. Four of the five forecasts were within three seats of the outcome. Although chance has some small role in this degree of accuracy, especially with many races being decided by razor-thin margins, the fact that most of the forecasts were so close to the actual outcome should count to the forecasters’ credit.
Second, making this accuracy of the House forecasts more impressive is that these were not “safe” forecasts. Four of the five forecasts predicted double-digit seat changes in an era in which these are not the norm. Net partisan seat swings had been held to fewer than 10 seats in 10 of the 14 national elections held since 1986. The political landscape of 2014 also suggested a small seat swing. The 2012 election left very few split-result districts, districts in which opposite parties won presidential and House vote pluralities. These are the districts one would look to for change, and there were precious few of them. Finally, in predicting Republicans to gain more than eight seats, the forecasts were predicting that the Republican Party would emerge from the election with a larger majority than it had after the 2010 landslide midterm (242 seats) and its largest majority since the one sent to Washington after Herbert Hoover’s defeat of Al Smith in 1928. This was not an easy election to forecast, and these were not cautious forecasts—and they were made nearly three months before the election.
Third, the accuracy of the Senate forecasts, in general, is more difficult to characterize. With Democrats defending 21 of the 36 seats up for election, with five of those being open-seat contests, and six having been carried in 2012 by Mitt Romney by at least 14 points, Republicans were positioned for substantial seat gains. The question was how substantial? Would Republicans gain the six seats required for them to control the Senate? Two of the three Senate forecasts (Abramowitz and Highton, McGhee, and Sides) saw this as essentially a toss-up. One (my forecast) predicted an eight-seat Republican gain with better than two to one odds of Republicans capturing a majority. With the Louisiana runoff completed, Republicans gained nine seats in the election. Considering how close many of the races were and the long lead time of the forecasts, this was a respectable-to-very-good showing for these forecasts.
Finally, the PS forecasts compared quite favorably to other forecasts, most notably the relatively new crop of forecasts that have sprung up in media outlets over the last several election cycles. The PS forecasts are more transparent (the specifications are clear and public), have longer lead times before the election, are more stable (eschewing frequent or even daily updating), and are generally more parsimonious and uncomplicated. Moreover, the forecasts possess these many virtues without apparently sacrificing anything in terms of accuracy–if 2014 is any indication.
The comparisons are clearest in the 2014 Senate forecasts. Although each eventually predicted a Republican Senate majority, in mid-September of 2014 (more than three weeks after the PS forecasts were made) Nate Silver’s “538,” the New York Times’ “Leo,” and the Washington Post’s “Election Lab” (updating Highton, McGhee, and Sides’ PS forecast) cast the Senate majority as a toss-up. Sam Wang’s Princeton Election Consortium at the time had the Democrats heavily favored. The PS forecasts were at least as accurate or more accurate than these media forecasts—moreover, they achieved this accuracy earlier and without the noise created by the flurry of incessantly updated forecasts.
While there is much to celebrate here for the PS forecasts, one election is but one election, and each forecasting model must stand on its own merits. We turn now to those evaluations.
THE GENERIC BALLOT MODEL AND THE 2014 CONGRESSIONAL ELECTIONS
Alan I. Abramowitz, Emory University
The generic ballot model underestimated the size of Republican gains in the 2014 midterm elections. Based on the generic ballot results in late August, the numbers of US House and Senate seats held by each party prior to the election, and a midterm decline variable, the predictions were a Republican gain of four seats in the House and five to six seats in the Senate. The actual election results were a Republican gain of 13 seats in the House and nine seats in the Senate.
One factor that may have contributed to an underestimate of Republican gains in both the House and Senate was the use of generic ballot results based on registered voters. Because voter turnout was extraordinarily low in 2014, the actual electorate may have been more Republican than would normally have been expected based on the registered voter results in late August that showed a tie on the generic ballot.
In the case of the Senate forecast, a second factor undoubtedly contributed to an underestimate of Republican gains. The Senate model includes the relative numbers of Democratic and Republican seats at stake but does not consider the partisan tilt of those seats. However, the Democratic seats up for election in 2014 were unusually difficult to defend. Of the 21 Democratic seats, seven were in states won by Republican Mitt Romney in 2012, including six that he won by a double-digit margin. Democrats lost all seven seats. One possible future change in the Senate model would be to incorporate information on state presidential election results into the seat exposure variable.
While the generic ballot model underestimated Republican gains in the House and Senate in 2014, the model’s performance needs to be evaluated based on the lead time of the forecast. Unlike media forecasting models that continued updating their predictions based on the latest polling data right up until Election Day, the generic ballot model used data available in late August to predict House and Senate seat change more than two months before Election Day. Given the model’s simplicity and its long lead time, its record of accuracy has been quite impressive.
The PS forecasts are more transparent (the specifications are clear and public), have longer lead times before the election, are more stable (eschewing frequent or even daily updating), and are generally more parsimonious and uncomplicated.
FORECASTING THE 2014 HOUSE SEAT DIVISION IN RETROSPECT
Joseph Bafumi, Dartmouth College
Robert S. Erikson, Columbia University
Christopher Wlezien, University of Texas, Austin
Based on information available more than three months in advance of the midterm election, our forecast for the US House of Representatives in 2014 was that the Republicans would win 248 seats (Bafumi, Erikson, and Wlezien 2014). The actual division was 247 Republican and 188 Democratic seats. We overshot the Republican surge by one mere seat.1
The precision of this estimate, of course, owes a lot to “luck.” Our seat forecast came with a wide band of uncertainty, considering the range of our 1,000 simulated outcomes. Our 95% confidence interval for the Republican Party showing ranged from 228 (still a majority) to 268 seats.
Our seat prediction was based, in part, on our prediction of the national vote division, which arose from our modeling past House vote margins as a function of the generic ballot polls 121 to 180 days in advance of the election plus accounting for midterm loss with a dummy variable for the party of the president. This vote prediction was 52.5% Republican (with a 95% confidence interval from 49.7% to 55.3% Republican). This too was close to the actual outcome, the Republicans winning 53.0% of the national two-party vote.2 We slightly undershot the Republican Party vote, but slightly overshot the Republican Party seats.
Our preelection PS article in October 2014 also included guidelines for forecasting the election from generic ballot congressional polls later in the campaign. When we applied our modeling to more recent poll data from late in the campaign, the prediction shifted by four seats to the Democrats, yielding a modest undershooting of the actual Republican showing. We made a final public forecast nine days before Election Day claiming that the Republican Party would win 244 Republican seats, an undercount of three seats.3 The slight dose of misplaced optimism for the Democrats resulted because the generic poll did not shift as much in the Republican direction as it did for the out-party during the final months of previous midterm campaigns (Bafumi, Erikson, and Wlezien 2010). This may be because voters are making up their minds earlier in the cycle as a result of today’s political polarization and early voting opportunities.
Substantively, there are two important takeaways from our forecasting exercise.
First, the national House vote at midterm is quite predictable from polls taken at any stage of the campaign. The election-year campaign does little to affect the national outcome except to prime voters to think about the (negative) consequences of rewarding the presidential party.
Second, the results affirm our prediction that the Republicans would win even more seats than in 2010 but with a lesser vote margin. This differential is because of the oft-noted structural changes working in the Republican’s favor—the post-2010 US Census redistricting, Republican Party gerrymandering, and the fact that the net incumbency advantage flipped to the Republicans. A full analysis would probably also show that the Republican Party gained by a further nationalization of the congressional vote. Our take away from this election: Not so much any more is congressional politics local.
NOTES
-
1. Assuming the Republican Party GOP holds its lead in disputed AZ2.
-
2. The figure (53.0 is from data in Wikipedia entry on House of Representatives 2014(http://en.wikipedia.org/wiki/United_States_House_of_Representatives_elections_2014).
-
3. Http://blogs.lse.ac.uk/usappblog/tag/house-of-representatives/.
REFERENCES
Bafumi, Joseph, Robert S. Erikson, and Christopher Wlezien. 2014. “National Polls, District Information, and House Seats: Forecasting the 2014 Midterm Election.” PS: Political Science and Politics 47 (4): 775–8.
Bafumi, Joseph, Robert S. Erikson, and Christopher Wlezien. 2010. “Balancing, Generic Polls, and Midterm Congressional Elections.” Journal of Politics 72: 70519.
CATCHING THE 2014 REPUBLICAN WAVE
James E. Campbell, University at Buffalo, SUNY
The seats-in-trouble forecasts of the 2014 US House and Senate election outcomes were both very accurate and early. They missed the Senate outcome by one seat and the House by only three seats.
The forecasting equations produced these predictions of 2014 election results on August 15, 2014. The single predictor in the equations is an index of the net number of vulnerable seats held by a party. Whether a seat is vulnerable to being won by the opposite party is determined by an analysis of The Cook Political Report’s rating of the race before or around Labor Day of an election year. With few exceptions, the index can be constructed for both on-year and midterm elections since 1984. The index is then regressed against the actual seat change to determine how seats judged “in trouble” in August have translated historically into seat changes in November.
The Cook Political Report in mid-August indicated that 26 Democratic House seats and 14 Republican seats were no better than leaning toward their current party. Ten Democratic and two Republican Senate seats were toss-ups or inclined to the opposite party. These were the seats-in-trouble, and their net party difference is the seats-in-trouble index. Based on the index values (+12 Democrats in the House and +8 in the Senate) and the historic relationship of the index to seat change, the equations predicted that Republicans should be expected to gain 16 House seats and eight Senate seats. Republicans actually gained 13 House seats, three short of the forecast, and nine Senate seats, one more than predicted.
A skeptic might suggest that the seats-in-trouble forecast amounts to a simple reading of The Cook Political Report. The 2014 experience, however, suggests this is not the case. The Cook Political Report provides the important raw or semi-processed ingredients to the forecast, much as Gallup or other data collectors and interpreters provide valuable input for other forecast models, but the creation of the index and the regression analysis on historical election outcomes adds substantial value. An indication of the value added to the forecast is in the aggregate projections made by the experts at The Cook Political Report from their individual race evaluations. In mid-October, David Wasserman at Cook estimated that Republicans would gain between four and 10 seats (Wasserman Reference Wasserman2014). In late October, Jennifer Duffy at Cook wrote that “Overall, we tend to believe that Republicans will get to 51 seats. Anything beyond that is very difficult, but not impossible if a bit of a wave develops in a couple of states (Duffy 2014).” The seats-in-trouble forecasts were both different from and earlier than these readings and, using the mid-point of their House projections, also closer to the actual change in seats in both the House and the Senate.
Questions remain about how the index might be optimally constructed from Cook’s ratings and whether other ratings should also be incorporated, but the success of the forecasts in three successive elections could hardly be more promising.
REFERENCES
Duffy, Jennifer. 2014. “Senate Overview: Six Days Out,” The Cook Political Report, October 29. Available at http://cookpolitical.com/story/8022 (accessed November 2, 2014).
Wasserman, David. 2014. “House Overview: GOP on Track to Gain 4 to 10 Seats,” The Cook Political Report, October 17. Available at http://cookpolitical.com/story/7935 (accessed November 2, 2014).
FORECASTING LESSONS FROM 2014: LONG LEAD, STRONG THEORY, NO POLLS
Michael S. Lewis-Beck, University of Iowa
Charles Tien, Hunter College, CUNY
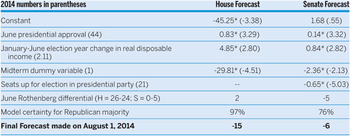
The Lewis-Beck and Tien forecast team came extremely close to the final midterm 2014 results, with their Democratic forecasts of a loss of 15 seats in the US House of Representatives, and a loss of 6 seats in the US Senate (Lewis-Beck and Tien 2014a, b). Why did their models work so well? The Structure-X forecasts for the House and Senate are based on a classic referendum model—rooted in strong theory. The congressional midterm elections stand as a referendum on the president and his party. Voters judge White House performance mainly along two dimensions: the president’s actions on key economic and noneconomic issues. These judgments are especially severe at midterm time. In table 1, we see these two dimensions, as measured by income growth and by presidential popularity, along side the midterm measure. In addition, because the model bases itself on aggregate, national-level data, we supplement the specification with idiosyncratic local information (drawing on the useful Rothenberg Report). Note that these forecasts were made on August 1, 2014.
Structure-X models Forecasting the 2014 Congressional Elections

Forecasts = seat change of president’s party; Rothenberg differential for House=out party seats in trouble – presidential party seats in trouble, for Senate = out party seats as Pure toss-up, Tilt or Lean toward out party – presidential party seats in same categories; t-scores in parentheses with * noting significance at .05; number of elections = 33, 1948–2012.
Besides the precision of the forecasts, four things distinguish these models from most others:
-
1. The reliance on established theories of electoral behavior, in particular with regard to issue voting. The bedrock comes from political economy notions and the reward or punishment meted out by the voters.
-
2. The simplicity of the models, following from the parsimony principle of Occam’s razor.
-
3. The absence of any vote intention measures from the polls, often found to be biased this election cycle.
-
4. The long lead time, with predictor measures taken and available more than three months before the election.
These were among the earliest, perhaps the earliest, of the fixed (unchanging over time) forecasts that were issued. This outcome speaks to the time-honored political science practice of taking “the long-view,” as our colleague Lee Sigelman would gently remind us. The long-view, in terms of forecasting, would seem to be what it’s all about.
REFERENCES
Lewis-Beck, Michael S., and Charles Tien. 2014a. “Congressional Elections Forecasting: Structure-X Models for 2014,” PS: Political Science and Politics 47 (4): 782–5.
Lewis-Beck, Michael S., and Charles Tien. 2014b. Congressional Briefing, “The Midterm Forecasts Are In: The Science of Election Forecasting Part 2,” American Political Science Association, Capitol Hill Visitors’ Center, Washington, DC, October 22.
ELECTION LAB POST-MORTEM
Benjamin Highton, University of California, Davis
Eric McGhee, Public Policy Institute of California
John Sides, George Washington University
In the preelection (October 2014) issue of PS, we presented a midterm election forecast that was current as of the end of August. It gave the Republicans a nearly certain chance of retaining their US House majority and even odds of winning a US Senate majority (Highton, McGhee, and Sides Reference Highton, McGhee and Sides2014).
Between August and Election Day, the forecast shifted in Republicans’ favor. Because our forecast model—which combined structural factors (“fundamentals”) and polling data—gave substantial weight to the polls in September and October, much of this shift derived from improved poll numbers for Republican candidates in key states. This shift also brought the polls closer in line with the fundamentals in these races—a pattern evident in previous elections (Sides Reference Sides2014a).
Our final House forecast estimated that Republicans had better than a 99% chance of retaining their House majority and would control 243 seats—a nine-seat increase from the number they controlled after the 2012 election. They ended up controlling 247 seats, well within the 95% confidence interval of the forecast (236 to 251 seats).
In addition, we forecasted each House race. Of those 435 forecasts, 420 were correct, based on the results compiled by Wasserman (Reference Wasserman2014). Of course, many races were not difficult to predict. Among a subset of 44 close races that were decided by 10 points or less, we correctly called 30 races. We can also calculate a Brier score for our House forecast. Brier scores take into account the confidence in and accuracy of predictions, and range between 0 and 1, with lower scores indicating better forecast performance (see Brier Reference Brier1950). For our House forecast, the average Brier score was .025 overall, and .217 for the close races.
In our last Senate forecast (Sides Reference Sides2014b), we estimated that Republicans had a 98% chance of winning a Senate majority and would pick up eight seats—although there was a 36% chance they would win more than that. They ended up winning nine, for a total of 55 seats.
The race that we called incorrectly was North Carolina’s, where both the fundamentals and the polling average favored Democratic incumbent Kay Hagen. At the same time, our model gave her Republican opponent, Thom Tillis, a non-negligible 23% chance of winning. The Brier score for our final Senate forecast was .026, second lowest of several forecasting models, although all the models did relatively well (see Sides Reference Sides2014c).
For future elections, we will continue to think about our model’s level of confidence, which was higher than several similar models. The 2014 midterm election certainly encouraged reflection on the confidence of any forecast that ultimately relied on polls, given that the polling averages underestimated the vote share of Republican candidates in key Senate races.
The congressional midterm elections stand as a referendum on the president and his party. Voters judge White House performance mainly along two dimensions: the president’s actions on key economic and noneconomic issues. These judgments are especially severe at midterm time.
SYMPOSIUM CONTRIBUTORS
Alan I. Abramowitz is the Alben W. Barkley Professor of Political Science at Emory University. He has authored or coauthored six books, dozens of contributions to edited volumes, and more than 50 articles in political science journals dealing with political parties, elections, and voting behavior in the United States. He is also one of the nation’s leading election forecasters. Abramowitz’s most recent book, The Polarized Public: Why American Government Is So Dysfunctional, examines the causes and consequences of growing partisan polarization among political leaders and ordinary Americans. He can be reached at polsaa@emory.edu.
Joseph Bafumi is associate professor of government at Dartmouth College. He conducts research in American politics and has published in numerous scholarly journals including the American Political Science Review, Journal of Politics, Political Analysis, and Quarterly Journal of Political Science. He has taught courses on voting behavior, public policy and methodology. In 2010–2011, he was awarded an APSA Congressional Fellowship and worked as a budget analyst for the Senate Budget Committee. He can be reached at joseph.bafumi.jr@dartmouth.edu
James E. Campbell is a UB Distinguished Professor of Political Science at the University at Buffalo, SUNY. He is the author of three books, including The American Campaign: US Presidential Campaigns and the National Vote, and more than 80 journal articles and book chapters. He previously served as Chair of the Political Forecasting Group, President of Pi Sigma Alpha, an APSA Congressional Fellow, and an NSF program director. His post-election analysis, “The Republican Wave of 2014: The Continuity of the 2012 and 2014 Elections,” is forthcoming in The Forum. He can be reached at jcampbel@buffalo.edu.
Robert S. Erikson is professor of political science at Columbia University. His research on American politics and elections has been published in a wide range of scholarly journals, and he is coauthor of The Timeline of Presidential Elections (Chicago), The Macro Polity (Cambridge), Statehouse Democracy (Cambridge), and American Public Opinion (Pearson). He is a former editor of the American Journal of Political Science and Political Analysis. He can be reached at rse14@columbia.edu
Benjamin Highton is a professor in the department of political science at University of California, Davis. He joined the department in 1999. Previously he was an APSA Congressional Fellow. His research and teaching interests include American national politics, political behavior, elections, public opinion, and research methods. His recent publications include Facing the Challenge of Democracy: Explorations in the Analysis of Public Opinion and Political Participation (2011). His numerous articles have been published in a variety of journals, including Political Behavior, Journal of Politics, Legislative Studies Quarterly, and Perspectives on Politics. He can be reached at bhighton@ucdavis.edu.
Michael S. Lewis-Beck is F. Wendell Miller Distinguished Professor of Political Science at the University of Iowa. His interests are comparative elections, election forecasting, political economy, and quantitative methodology. Professor Lewis-Beck has authored or coauthored more than 240 articles and books, including American Voter Revisited, Forecasting Elections, Economics and Elections, and Applied Regression. He has served as editor of the American Journal of Political Science and of the Sage QASS series (the green monographs) in quantitative methods. Currently he is associate editor of International Journal of Forecasting and of French Politics. In fall, 2014, Professor Lewis-Beck was Visiting Professor, LUISS University, Rome. He can be reached at michael-lewis-beck@uiowa.edu.
Eric McGhee is a research fellow at the Public Policy Institute of California (PPIC) with expertise in elections, legislative behavior, political participation, political parties and party polarization. His publications include California’s Future: Political Landscape, Voter Turnout in Primary Elections, and California’s 2011 Redistricting: The Preliminary Plan, all for PPIC. He also is a contributor to the Monkey Cage. He is a former APSA Congressional Fellow. He can be reached at mcghee@ppic.org.
John Sides is an associate professor in the department of political science at George Washington University. His work focuses on political behavior in American and comparative politics. He is the author, with Lynn Vavreck, of The Gamble: Choice and Chance in the 2012 Election. He can be reached at jsides@gwu.edu.
Charles Tien is a professor in the department of political science at Hunter College and The Graduate Center, CUNY. His areas of research include American politics, Congress, and quantitative research methods. His recent work has appeared in International Journal of Forecasting, Polity, DuBois Review, and Defense Analysis. He can be reached at ctien@hunter.cuny.edu.
Christopher Wlezien is Hogg Professor of Government at the University of Texas at Austin. His research on American and comparative politics has appeared in numerous journals, and he is coauthor of Degrees of Democracy (Cambridge) and The Timeline of Presidential Elections (Chicago) and coeditor of a number of other books, including Who Gets Represented? (Russell Sage). He was founding coeditor of The Journal of Elections, Public Opinion and Parties and currently is associate editor of Public Opinion Quarterly. He can be reached at Wlezien@austin.utexas.edu.