I. INTRODUCTION
In recent years, there has been a sustained interest on III-nitrides driven by their wide-range band gaps suitable for optoelectronics applications especially in near-IR/near-UV devices. Among all the III-nitrides, InN has the shortest direct band gapReference Nanishi, Saito and Yamaguchi1, Reference Yang, Hwang, Yang, Chen and Wang2 and smallest effective mass for electrons,Reference Fu and Chen3 which leads to high mobility and high saturation velocity at room temperature. These advantages make it a highly competitive candidate for various optoelectronic devices, such as solarcell, high mobility transistors, light-emitting diodes, and so on.Reference Bhuiyan, Hashimoto and Yamamoto4 The growth of single crystalline and good quality InN films has been widely studied since the 1990s by metalorganic vapor-phase epitaxy (MOVPE). Because of the low InN dissociation temperature and extremely high equilibrium vapor pressure of nitrogen over the InN film,Reference Trainor and Rose5 a low-growth temperature of about 500 °C is necessary for InN preparation. However, this work is extremely challenging due to a low decomposition rate of NH3 at low-growth temperature, which restricts the achievement of high quality InN films. Therefore, the knowledge on the fundamental properties, such as the structural, electrical, and optical properties, of InN material is of shortage.
In this work, a series of InN films were grown in different conditions using MOVPE to understand their structural properties. The crystalline structures of as-grown wafers were analyzed by x-ray diffraction (XRD) and Raman scattering measurements. Moreover, phonon dispersions were simulated by the first principles calculation to identify the experimental results. The relationship between the structural properties of InN films and growth conditions is systematically discussed.
II. EXPERIMENTAL AND THEORETICAL DETAILS
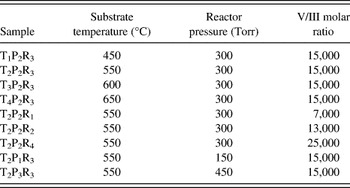
A series of nominally undoped InN films were epitaxied on a 1.5-μm-thick wurtzite GaN underlayer with (0001) sapphire substrate by MOVPE. During the growth of GaN underlayer, trimethylgallium (TMGa) and ammonia (NH3) were used as the source precursors, with high purity N2 as the carrier gas. Then, InN film was epitaxied for about 1 h on the top of GaN underlayer using trimethylindium (TMIn) instead of TMGa. Three sets of wafers of about 250-nm-thick InN films were chosen to examine the effects of growth condition. The growth conditions of the three sets of films are summarized in Table I. For the first set (T1P2R3, T2P2R3, T3P2R3, T4P2R3), the growth temperatures varied from 450 °C to 650 °C under a pressure of 300 Torr with a V/III molar ratio of 15,000. For the second set (T2P1R3, T2P2R3, T2P3R3), the pressures of chamber increased from 150 to 450 Torr with a step of 150 Torr, while the V/III ratio were kept on 15,000 at the growth temperature of 550 °C. Finally, for the third set (T2P2R1, T2P2R2, T2P2R3, T2P2R4), the V/III ratio varied from 7000 to 25,000 with a constant NH3 flow of 5500 sccm, while the temperature and the pressure were fixed at 550 °C and 300 Torr.
Growth conditions of various wafers.

The crystalline structures of the as-grown wafers were characterized by an XRD system (Panalytical X’pert PRO, PANalytical B.V., Holland) and a confocal microprobe Raman system equipped with a CCD detector and a Leica DMLM microscope (Renishaw UV–vis 1000, Renishaw, UK). Raman spectra were recorded at room temperature in  backscattering geometry, where z is perpendicular to the InN film surface. The excitation light source was the 514 nm line of Ar-ion laser.
To identify the Raman scattering results, phonon dispersions were calculated within the framework of LDA,Reference Hohenberg and Kohn6, Reference Kohn and Sham7 using ABINIT package.Reference Gonze, Rignanese, Verstraete, Beuken, Pouillon, Caracas, Jollet, Torrent, Zerah, Mikami, Ghosez, Veithen, Raty, Olevano, Bruneval, Reining, Godby, Onida, Hamann and Allan8–10 The interaction between the ions and valence electrons was described by the Hatwigsen, Goedecker, and Hutter (HGH) pseudopotentials.Reference Hartwigsen, Goedecker and Hutter11 The Brillouin zones were sampled by an 8 × 8 × 8 Monkhorst-Pack mesh of k points. The convergence for the ground-state total energy was attained at a plane-wave cut off of 90 Ry. For linear response functions, the density functional perturbation theoryReference Baroni, Giannozzi and Testa12, Reference Giannozzi, de Gironcoli, Pavone and Baroni13 was implemented to calculate the interatomic force matrices, from which phonon band structures in the Brillouin zone were obtained, with the LO–TO splitting being taken into account.Reference Gonze, Rignanese, Verstraete, Beuken, Pouillon, Caracas, Jollet, Torrent, Zerah, Mikami, Ghosez, Veithen, Raty, Olevano, Bruneval, Reining, Godby, Onida, Hamann and Allan8, Reference Saib, Bouarissa, Rodríguez-Hernández and Muñoz14
III. RESULTS AND DISCUSSION
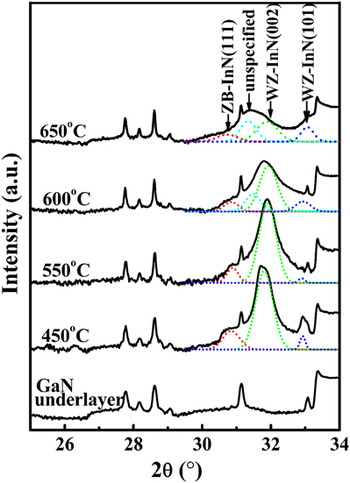
XRD is an effective experimental method of revealing general crystal properties of the films. A θ-2θ scan was carried out for all samples in the range from 25° to 80°. The XRD patterns ranging from 25° to 34° are shown in Fig. 1 for the four InN thin films grown at different temperatures. For comparison, the spectrum of the sample without InN film on the GaN underlayer is also displayed. All the samples with InN films exhibit diffraction peaks only in the range of 30°–34°, except for the background spectrum from GaN underlayer and sapphire substrate. It is apparent that these peaks all come from the InN films.15 The dominant peak of the InN films grown at low temperature is narrower and centered at about 31.8°, which was assigned to the InN (002) plane of wurtzite (WZ) structure after comparing it with the Powder Diffraction File (PDF). The width of the dominant peak becomes broader and weaker when the growth temperature increases. As the temperature is raised up to 600 °C, another diffraction pattern appears in lower angle side and emerges as a diffraction peak in the sample grown at 650 °C. The peak position is centered at about 31.3° according to the fitting results as cyan short dotted line shown in Fig. 1. On both sides of the dominant peak, there are two weak shoulders in all the films. By fitting the diffraction patterns, the shoulders in upper and lower angle sides are determined to be at 33.0° and 30.9° and are assigned to the WZ InN (101) and ZB InN (111), respectively, according to the PDF. Besides, the structural phase related to the fitted diffraction peak centered at 2θ = 31.3° could not be determined from the current data for the sample T3P2R3 and T4P2R3. Lattice constants were found to be c = 5.60–5.63 Å and a = 3.56–3.59 Å for WZ structure and a = 5.01 Å for ZB structure, with a slight deviation from previous reports.Reference Kim, Lambrecht and Segall16 As the films are about 250-nm-thick, the deviation is probably due to the internal or thermal stress. In addition, XRD profiles in the range from 34° to 80° of the InN film only show similar patterns of InN WZ (004), (202), and ZB (222) [not shown here]. Although there are different phase diffractions, XRD diffraction intensity of the films is dominated by WZ structure peaks, especially for the films grown at lower temperatures.
X-ray diffraction (XRD) patterns of InN thin films at different growth temperatures, with the pressures of chamber at 300 Torr and the V/III molar ratio at 15,000. The temperatures are labeled above each curve. The peaks labeled with short dotted line are the fit peaks.

We then closely examine the intensity dependence of diffraction peaks on the growth temperature for an optimization. As the temperature changes from 450 °C to 550 °C, there is a slight increase in the WZ InN (002) peak intensity and a slight decrease in both ZB (111) and WZ (101) peaks. When the temperature further increases to 600 °C and to 650 °C, the peak intensity of WZ InN (002) decreases while that of the WZ InN (101) increases; the intensity ratio of ZB (111) to WZ (002) also increases, and both their full-width at half-maximum (FWHM) increases. The FWHM of InN (002) peak decreases from 0.31° to 0.28° when the growth temperature changes from 450 °C to 550 °C and significantly increases to 0.36° and 0.46° when the temperature further increases to 600 °C and 650 °C, respectively. This suggests that 550 °C is closest to the optimal growth temperature for a single-phase and high quality WZ InN film, in which the thermal decomposition or thermal etching of InN is smallest.
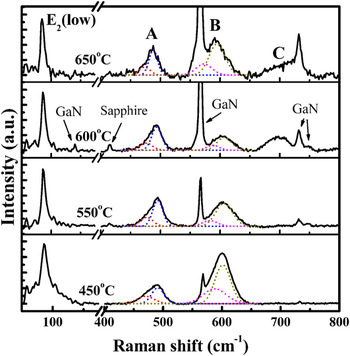
While XRD patterns reveal the general crystal properties in the long-range order crystal, Raman spectra are very sensitive to local crystallinity and microstructures near the film surface. Figure 2 displays the room-temperature Raman spectrum for InN films grown at different temperatures. All four spectra display a strong peak at 568 cm−1, which is the characteristic E2 phonon frequency of the GaN underlayer. Additionally, the spectra show a few other weak bands at 141, 415, 732, and 745 cm−1, which can be assigned to the phonons of GaN underlayers and sapphire substrates.Reference Azuhata, Sota, Suzuki and Nakamura17, Reference Kladko, Kolomys, Slobodian, Strelchuk, Raycheva, Belyaev, Bukalov, Hardtdegen, Sydoruk, Klein and Vitusevich18 Except for above scattering peaks, three prominent modes typical for InN films appear at 86, 490–495, and 592–603 cm−1. There is also a new phonon band centered at about 700 cm−1 when the growth temperature is 600 and 650 °C. The mode centered at 86 cm−1 is sharp and is intuitively attributed to the E2 low phonon mode of WZ InN structure according to the previous reports.Reference Yu Davydov, Emtsev, Goncharuk, Smirnov, Petrikov, Mamutin, Vek-shin, Ivanov, Smirnov and Inushima19, Reference Ranjan, Bin-Omran, Sichuga, Nichols and Bellaiche20 In comparison with the E2 low phonon peak, the latter three bands exhibit broader line width and more asymmetric line shape, labeled as A, B, and C, which means that they may not simply come from WZ InN structure, and this will be studied on later.
Raman spectra of InN thin films at different growth temperatures, with the pressures of chamber at 300 Torr and the V/III molar ratio at 15,000. The temperatures are labeled above each curve. The peaks labeled with short dotted line are the fit peaks.

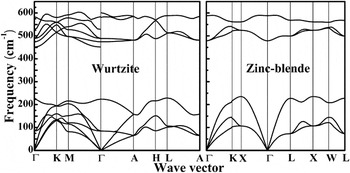
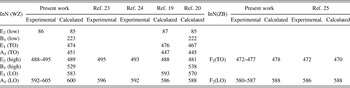
As with the XRD pattern, the bands A and B likely came from WZ and ZB structures because they appear in all the samples. The WZ structure has six Raman-active phonons of A1 (TO), A1 (LO), E1 (TO), E1 (LO), and a doubly degenerate E2, while the ZB structure has only two Raman-active phonons F2 (TO) and F2 (LO).Reference Harima21 For WZ InN grown along c direction, the  backscattering geometry allowed the observation of the E2 and A1 (LO) phonon modes, while for ZB InN with [111] orientation, both F2 (TO) and F2 (LO) modes should be allowed in this geometry. To further analyze the structural properties from the bands A and B, the phonon dispersions for both the WZ and ZB InN were calculated. The calculated results are shown in Fig. 3. There are twelve phonon modes, including nine optical and three acoustic branches, in the WZ InN structure, whereas the ZB InN gives only six phonon modes, three of which are acoustical and the others are optical branches. The calculated dispersion curves for the WZ and ZB phase are in agreement with the results given in literatures.Reference Ranjan, Bin-Omran, Sichuga, Nichols and Bellaiche20, Reference Tütüncü, Srivastava and Duman22 For the WZ InN structure, the allowed E2 low, E2 high, and A1 (LO) modes are located at 85, 489, and 600 cm−1 at Γ point, respectively. The allowed TO and LO phonon modes of ZB InN appear at 478 and 588 cm−1, respectively, which is in the same regions of band A and B. Taking into account the appearance of WZ InN (101) in XRD patterns, the Raman selection rule would probably be broken so that the other phonon peaks such as E1 (TO), A1 (TO), and E1 (LO) might show up. Nevertheless, Raman spectra do not show any visible peak at about 448 cm−1, where the A1 (TO) mode should appear. This fact means that the Raman selection rule is almost complied with even if the crystal orientation is not perfect. For this reason, we speculate that the contribution of E1 (TO) at about 474 cm−1 and E1 (LO) at about 583 cm−1 to the bands A and B is negligible for WZ InN. Thus, in view of the co-existence of WZ and ZB phase, Raman bands of both A and B can be fitted with two individual peaks. The former is fitted with F2 (TO) of ZB InN and E2 high phonon of WZ InN and the latter is synthesized by F2 (LO) of ZB InN and A1 (LO) mode of WZ InN structure, as represented by the dashed lines in Fig. 2. The experimental fitted values of F2 (TO) and F2 (LO) of ZB InN and E2 high and A1 (LO) of WZ InN are compared with our calculated results of the zone-center and the values reported previously in Table II.Reference Yu Davydov, Emtsev, Goncharuk, Smirnov, Petrikov, Mamutin, Vek-shin, Ivanov, Smirnov and Inushima19, Reference Ranjan, Bin-Omran, Sichuga, Nichols and Bellaiche20, Reference Kwon, Lee, Miki, Yamano and Yoshida23–Reference Kaczmarczyk, Kaschner, Reich, Hoffmann, Thomsen, As, Lima, Schikora, Lischka, Averbeck and Riechert25 The fitted values of four phonon modes are close to the calculated values, although they shifted slightly in different samples. Moreover, both our theoretical and experimental results are in good agreement with the comparison data despite a little higher value for A1 (LO) mode. Accordingly, these data further confirm the presence of the ZB structure in InN films deduced from the XRD measurement.
Phonon dispersion curves of InN for both WZ and ZB in the structure.

Summary of the experimentally observed and theoretically calculated phonons of InN (WZ and ZB modifications).

Close comparison reveals that the bands A and B shift slightly to higher wave number as the temperature changes from 450 °C to 550 °C and shift back when the temperature further increases to 650 °C. It is known that the phonon frequency is closely related to the misfit stress between InN film and GaN underlayer, which is generally accommodated by lattice strain and defects. On the basis of Raman scattering data along with XRD measurements, we can deduce that the higher the Raman phonon frequency of bands A and B are, the narrower the FWHM of the InN XRD (002) peak is, which indicates higher crystalline quality with fewer defects. The shift in phonon frequency is likely due to the lattice strain rather than defects as the sample grown at 550 °C has the narrowest FWHM. In light of this, we simulated phonon dispersions of WZ structure under different biaxial compressive strains. As expected, the phonon frequency at Brillouin center increases with increase in the compressive strain. On the basis of above analysis, the growth temperature of 550 °C is more appropriate for the InN film epitaxy.
From Table II, it is observed that neither WZ nor ZB InN structure would have the phonon mode at around 700 cm−1, which appears in sample T3P2R3 and T4P2R3. Generally, the excited states of free electrons, either single-particle excitation or collective excitation (plasmons), can also contribute to Raman scattering by coupling with lattice vibration. Since almost all the InN thin films obtained so far are of n type with high electron concentration, the formation of plasmon will be easier and the coupling between plasmon and LO phonon (PLP) will be enhanced.Reference Harima21, Reference Qian, Shen, Ogawa and Guo26 With increasing electron concentration, the upper branch PLP+ mode increases from the LO frequency to higher value, while the lower branch PLP− mode goes to the TO frequency range. From this point of view, 700 cm−1 should be related to the PLP+ if the band C could be attributed to PLP. However, most observed PLP modes in previous reports are PLP−.Reference Yu Davydov, Emtsev, Goncharuk, Smirnov, Petrikov, Mamutin, Vek-shin, Ivanov, Smirnov and Inushima19, Reference Aderhold, Davydov, Fedler, Klausing, Mistele, Rotter, Semchinova, Stemmer and Graul27, Reference Inushima, Mamutin, Vekshin, Ivanov, Sakon, Motokawa and Ohoya28 Simultaneously, the XRD patterns of those two samples with band C show an undefined peak at about 2θ = 31.3°. In the light of this, we would ascribe the band C to another new structure phase rather than PLP coupling mode. In addition to WZ and ZB structure, InN has rocksalt (RS) phase that usually appear in the sample under high pressure.Reference Pinquier, Demangeot, Frandon, Chervin, Polian, Couzinet, Munsch, Briot, Ruffenach, Gil and Maleyre29, Reference Ueno, Yoshida, Onodera, Shimomura and Takemura30 It has been found that an intrinsic compressive stress (i.e., Laplace pressure) induced by the surface tension exists in many isolated 3D islands in Volmer–Weber growth.Reference Wang, Kushvaha, Yan and Xiao31–Reference Pao and Srolovitz33 For this reason, small structures are subjected to a stressed state even without any external force. To further identify this additional Raman peak, we calculated the phonon dispersion curves for the RS structure (not displayed here). The phonon dispersion curves eliminate the possible contribution of RS phase because there is no phonon mode in the region higher than 600 cm−1. Therefore, the band C in Raman spectrum and the undefined peak in XRD pattern are believed to come from a new structural phase, which needs further investigations.
Since the growth pressures and V/III molar ratios are other critical components to obtain high-quality InN films, another five samples were epitaxially grown under different conditions at the optimized temperature of 550 °C, as listed in Table I. Figure 4 shows XRD patterns and Raman spectra of InN films growth at 15,000 V/III ratio under different reactor pressures. As seen in Fig. 4(a), no diffraction peak of the unspecified structure appears at 31.3°. Furthermore, neither noticeable intensity nor position variation is observed as the reactor pressure changed in the region of 150–450 Torr, except for slightly narrower FWHM of WZ (002) under higher pressure. This tendency is in agreement with the previous report in the region of 150–450 Torr.Reference Kadir, Ganguli, Gokhale, Shaha, Chandvankar, Aroraa and Bhattacharya34 Similarly, the unspecified phonon band is also invisible at about 700 cm−1, as shown in Fig. 4(b), which confirms that there is no unspecified structural phase in the InN films grown under different pressures. Besides, the line width and the intensity of all InN Raman phonon modes are rarely affected by reactor pressure as compared to the growth temperature. The relatively higher quality could be attributed to the enhancement of ammonia decomposition as a result of reduced flow velocity of the reactant gases and the suppression of re-evaporation of nitrogen from the InN layer under higher pressure. However, as the effective In supply at the growth surface is influenced by the reactor pressure,Reference Kadir, Ganguli, Gokhale, Shaha, Chandvankar, Aroraa and Bhattacharya34 the structural quality will probably be degraded under the reactor pressure higher than 450 Torr. For these reasons, we further examined the influence of V/III ratio with a compromised reactor pressure of 300 Torr.
(a) XRD patterns and (b) Raman scattering spectra of InN thin films under different reactor pressure, with the V/III ratio kept at 15,000 and the growth temperature kept at 550 °C.

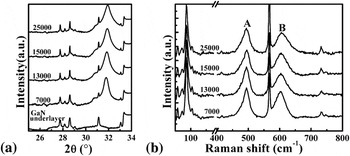
The effect of V/III ratio on the structural properties of InN films is illustrated in Fig. 5. Neither XRD patterns nor Raman spectra show the unspecified peak or any obvious change in different samples. Close examination shows that the line width of XRD patterns weakly broaden as V/III ratio increased in a given range of 7000–25,000. According to the InN phase diagram calculated by Jones et al.,Reference Jones and Rose35 the boundary line as a function of N full composition between solid phase and liquid phase at the temperature of 550 °C is about 97%. Because the ammonia decomposition rate at this temperature is less than 0.1%,Reference Piner, Behbehani and El-Masry36 all V/III ratios in our case appear in the solid and liquid coexistent region. The V/III ratio of 7000 is located closer to the solid line. Several studies in literature pointed out that a high V/III ratio is required to achieve In droplet-free InN filmsReference Nanishi, Saito and Yamaguchi1, Reference Koukitu, Takahashi and Seki37, Reference Matsuoka and Pearton38 although some achieved good quality films with a low V/III ratio.Reference Briot, Maleyre, Clur-Ruffenach, Gil, Pinquier, Demangeot and Frandon39 Nevertheless, the In-droplet growth regime is tentatively precluded because no obvious In diffraction peak is observed in all our samples. On the basis of above analysis, we believe that a relatively lower V/III ratio of precursor is more conducive to obtain high quality InN films, although it has modest effect on the InN microstructures.
(a) XRD patterns and (b) Raman scattering spectra of InN thin films as a function of V/III ratio with the temperature and the pressure fixed at 550 °C and 300 Torr, respectively.

IV. CONCLUSION
We have studied the effect of various growth conditions on the crystalline quality of InN films grown on GaN underlayer with c-plane sapphire substrate by MOVPE. The XRD and Raman scattering investigations reveal that the samples mainly contain WZ structure as well as a small amount of ZB phase, while the samples grown at higher temperature include unspecified structural phase. The calculated phonon dispersions confirm this revelation and further suggest the existence of a new structural phase, other than the WZ, ZB, or RS phase, in the samples grown at 600 and 650 °C. The analysis shows that the growth temperature plays a key role in the structural phase purity and 550 °C is an optimal temperature for growing the InN film in better crystalline quality. Besides, a relatively higher reactor pressure and lower V/III ratio are also found to help improve the crystalline quality despite their small effect on the structural properties. Our present study provides a well-founded guideline for growth optimization of InN film, which can lead to the further refinement of In-rich InGaN and InAlN films grown by MOVPE.
ACKNOWLEDGMENTS
The authors thank Yaping Wu and Huiqiong Wang in the Department of Physics of Xiamen University. This work was partly supported by the Special Funds for Major State Basic Research Project, the National Natural Science Foundation (Grant Nos. 60827004, 90921002), and Fujian and Xiamen projects of China.