I. INTRODUCTION
Amorphous solids, such as bulk metallic and network glasses, constitute a class of materials which attract both scientific and engineering interest. Reference Schuh, Hufnagel and Ramamurty1,Reference Hufnagel, Schuh and Falk2 Despite their out-of-equilibrium nature, these materials have impressive elastic (in terms of extension) and plastic (in terms of strength) properties. However, their ductility upon yield is limited because of the emergence of local plastic instabilities, leading to immediate failure under tension and the formation of a few dominant shear bands under compression. Reference Pampillo3,Reference Leamy, Chen and Wang4
Two widely used material preparation protocols used to influence the mechanical properties of the amorphous solid are that of aging and rejuvenation. Reference Sun, Concustell and Greer5 Aging involves careful thermal annealing procedures, which induce structural relaxation and a reduction in energy, resulting in improved elastic properties and a higher yield, but at the expense of ductility. Rejuvenation generally involves structural excitation and an increase in energy, tending to delocalize plasticity and increase ductility, but at the expense of a well defined yield point and thermal stability.
Recently, a number of quite different rejuvenation protocols have been investigated, in particular temperature quenching/ramping between ambient temperatures (well below the glass transition temperature) and liquid Nitrogen temperatures, Reference Ketov, Sun, Nachum, Lu, Checchi, Beraldin, Bai, Wang, Louzguine-Luzgin, Carpenter and Greer6 and stress relaxation/creep at ambient temperatures under strains and stresses which are almost two orders of magnitude below the yield point. Reference Greer and Sun7,Reference Küchemann and Maass8 The implication of these works is that the underlying structural excitations, which collectively lead to plasticity, must be thermally driven or driven by thermal-stresses which develop during cooling.
The amorphous atomic structure contains no discrete translational symmetry, and (so far) no canonical defect framework has been identified which would mediate microscopic plastic processes. Despite this situation, a number of generic atomic scale mechanisms have been proposed using both theory and atomistic simulation. The most widely known mechanisms are those of free-volume migration, Reference Spaepen9 local shear transformation, Reference Argon10 and shear transformation zone theory. Reference Falk and Langer11,Reference Falk and Langer12 All rely on the concept of a local change in atomic structure, which via the Eshelby inclusion picture, Reference Eshelby13 results in a far-field plastic strain or stress. The Eshelby procedure involves (i) removing a volume element bounding the region in which the local plastic event occurs, (ii) allowing this volume element to relax elastically, and (iii) reinserting this into the medium after which the entire material is allowed to relax to give the far field stress signature associated with the original plastic event. Via elasticity, such structural transformations can interact leading to complex collective behavior.
Via simulation, the emergent behavior of such unit-scale processes is able to rationalize the transition from a low temperature heterogeneous plasticity to a high temperature homogeneous plasticity. This has been seen in thermally driven coarse grained models Reference Bulatov and Argon14–Reference Li, Homer and Schuh19 and stress driven atomistic simulation Reference Falk and Langer11,Reference Maloney and Lemaître20–Reference Demkowicz and Argon22 (see also the review article Ref. Reference Rodney, Tanguy and Vandembroucq23). Since the atomistic simulations must be performed at high strain rates, the type of plasticity normally being studied is predominantly athermal. Here, the material is driven by stress to a local structural instability. Whilst supporting the effective temperature theories associated with the shear transformation zone construct, Reference Falk and Langer12 such plasticity is quite different from the coarse grained models Reference Bulatov and Argon14–Reference Li, Homer and Schuh19 and that of early theory Reference Spaepen9,Reference Argon10 —all of which rely on thermal fluctuations to drive local structural transformations.
The present atomistic simulations will demonstrate that significant structural change under zero load, and well below the glass transition temperature regime, does occur via thermally activated processes when physical simulation times reach the order of several hundred nano-seconds to a micro-second. In thermally activated plasticity, microscopic plastic processes are driven by thermal fluctuation, where the system passes from one local energy minimum to another via a saddle-point configuration. Here, the external and internal stresses bias those processes which relieve the applied load or the internal stress. It is this latter bias which leads to collective and possibly local macroscopic plasticity. Since the thermal energy scale is small, such unit plastic processes are spatially local and rare when compared to the Debye time-scale. Emergent collective behavior of many structural transformations will therefore occur at much longer time-scales—many orders of magnitude larger than that probed by atomistic simulation—but comparable to the time scale of a typical deformation experiment. Experimental evidence of thermally activated plasticity is numerous for temperatures approaching the glass transition regime Reference Schuh, Hufnagel and Ramamurty1 and also at much lower temperatures in shear band nucleation, propagation, and arrest. Reference Maaß, Klaumüzer and Löffler24–Reference Maaß and Löffler27
Atomistic simulation techniques able to probe local structural transitions not driven to an instability by an external stress fall into the broad category of potential energy landscape (PEL) exploration algorithms. For model glass systems, the activated-relaxation-technique nouveau Reference Barkema and Mousseau28–Reference Olsen, Kroes, Henkelman, Arnaldsson and Jónsson30 (ARTn) has provided important insight into local changes in atomic structure as the system passes through a saddle-point to a new nearby local energy minimum. Reference Rodney and Schuh31–Reference Swayamjyoti, Löffler and Derlet38 All these works have shown that model glass structures admit a distribution of barrier energies. When the glass configuration is sufficiently relaxed, this distribution tends to small values for increasingly small barrier energies. The associated structural excitations are local but complex in structure, containing a central group of atoms which undergo a maximum displacement, surrounded by a field of much smaller displacements that helps to accommodate the central structural change. In Refs. Reference Swayamjyoti, Löffler and Derlet35 and Reference Swayamjyoti, Löffler and Derlet38 these central structures, referred to as local structural excitations (LSE), were characterized by a chain-like geometry in which a sequence of neighboring atoms shifted to adjacent positions. In the work of Fan et al., Reference Fan, Iwashita and Egami36,Reference Fan, Iwashita and Egami37 such displacements could be correlated quadratically with the corresponding barrier energy suggesting a direct link to the Eshelby inclusion construct. Reference Eshelby13 In the work of Swayamjyoti et al., Reference Swayamjyoti, Löffler and Derlet38 the barrier energy (and how it changes upon application of an external stress) could be correlated with the stress signature of the corresponding saddle-point configuration under zero-load.
The present work investigates thermally activated LSE under zero load conditions for a model Lennard Jones (LJ) binary structural glass. This is done by studying the degree of increasing atomic scale displacements as a function of increasing temperature using the molecular dynamics method. Four orders of temperature ramping rates are considered, with the slowest rate demonstrating significant activity at temperatures well below the glass transition regime. Section II details the simulation methodology and sample preparation methods, Sec. III presents the results of temperature ramping protocols in which the degree of structural relaxation is quantified in terms of quench protocol and temperature ramp rate. Section IV investigates the atomic-scale nature of the observed structural excitations and the local environment in which they occur. Using up to a micro-second of physical simulation time, the final section, Sec. V, discusses the results in terms of enthalpy storage and internal pressure distribution, demonstrating that through thermal activation alone significant enthalpy changes can be achieved via atomistic simulation.
II. SIMULATION METHODOLOGY AND GLASS PREPARATION PROCEDURE
Three-dimensional model 50:50 binary glass samples are considered using the Wahnstrøm parametrized Lennard-Jones pair potential Reference Wahnström39 :
 $${V_{{\rm{ab}}}}\left( r \right) = 4\varepsilon \left( {{{\left( {{{{\sigma _{{\rm{ab}}}}} \over r}} \right)}^{12}} - {{\left( {{{{\sigma _{{\rm{ab}}}}} \over r}} \right)}^6}} \right)\quad ,$$
where r is the distance between atoms of type a and b (equal to either type 1 or type 2). For this potential σ22 = 5/6σ11 and σ12 = σ21 = 11/12σ11, where σ11 sets the length scale and ε sets the energy scale. The potential is truncated at a distance of 2.5σ11. The time scale is set by the quantity
 ${\sigma _{11}}\sqrt {\left( {{m_1}{\rm{/}}\varepsilon } \right)}$
, where m
1 and m
2 are the masses of the two atom types. For the present simulations the masses of two atom types are arbitrarily chosen to be m
1 = 2 and m
2 = 1 atomic masses. For this system, the time step used is 0.002778
 ${\sigma _{11}}\sqrt {\left( {{m_1}{\rm{/}}\varepsilon } \right)}$
. The absolute temperature, T, is expressed as an energy, k
B
T, using k
B = 8.617 × 10⁻⁵ε. When obtained energies are compared to experiment, a characteristic metallic value of ε = 1 eV is used. Such Lennard-Jones pair potentials have been extensively used to study the generic properties of amorphous systems.
Reference Rodney, Tanguy and Vandembroucq23
Indeed, a Lennard-Jones pair potential was used in the papers of Falk and co-workers
Reference Falk and Langer11,Reference Shi and Falk21
—work which has significantly influenced the topic of bulk metallic glasses (BMGs). The implications for using such simplified pair potentials within the context of BMGs will be discussed in more detail in Sec. V.
A cubic simulation cell of side length 29.0613σ11 consisting of 32,000 atoms is considered. This gives a fixed volume density of 1.3078 (σ11)−3. Periodic boundary conditions are used. Such a size is sufficient to study local thermally activated structural excitations, each event of which can involve up to several atoms. The LAMMPS software Reference Plimpton40 (Scandia National Laboratories, Albuquerque, New Mexico) is used to perform the molecular dynamics simulations.
A very common protocol to produce an amorphous solid at 0 K is to begin with a high temperature equilibrium liquid configuration using either an NVT (fixed atomic number, volume, and temperature) or NPT (fixed atomic number, pressure, and temperature) ensemble. This is then followed by a linear quench in temperature. For the NPT ensemble, a simultaneous pressure quench is also included, such that, as the temperature approaches zero, so does the pressure. If the NVT ensemble is used with a not too slow quench rate, the final sample will generally contain a non-negligible hydrostatic stress component. In the present work, an NVT quench protocol is chosen, starting from an equilibrated liquid at a temperature of 1.5667T G (where T G is defined in the following section). At this high temperature the liquid has an average hydrostatic pressure equal to approximately 22.3ε/(σ11)3. Temperature control is performed by rescaling atomic velocities at a chosen time interval. When needed, for a given configuration of atomic positions at a specific temperature, displacements due to thermal vibrations are removed by performing a conjugate gradient (CG) relaxation to a zero force configuration. These configurations are referred to as CG-quenched (CG-q) samples.
The motivation to perform NVT, rather than NPT, simulations is driven by the simplifications associated with studying an evolving PEL at fixed density. Indeed, this will allow for a more direct comparison of how the PEL evolves as a function of temperature and time since, apart from the level of individual activities, the classes of structural excitations that do occur should not fundamentally change with an increase in temperature. This is an important first step when studying structural excitations which are thermally driven.
III. TEMPERATURE RAMPING
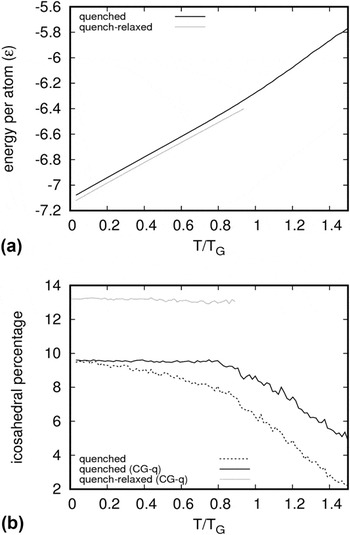
Figure 1(a) displays the potential energy versus time for a linear quench protocol with a temperature quench rate equal to Q LQ = −6 × 10⁻⁴ε/τ. This corresponds to a drop in temperature equal to 0.0157T G every 10,000 molecular dynamics iterations. The potential energy values are derived from an average at each temperature. Two, approximately linear, regimes may be identified with cross-over behavior in a narrow temperature interval identified as the glass transition temperature regime. Linear extrapolation of the low and high temperature regimes gives a fictive glass temperature equal to k B T G = 0.55ε. Below this temperature scale, the structure can be considered to be in an amorphous state, whereas above, it may be considered to be in a liquid-like or under-cooled liquid state.
(a) Potential energy per atom and (b) icosahedral percentage as a function of decreasing temperature of the quenched and the quench-relaxed samples. The quenched curve involves a direct linear quench from a high temperature equilibrium liquid configuration, whereas the quench-relaxed curve is interrupted by a fixed temperature relaxation protocol just below the glass transition regime. For the latter, only the subsequent linear quench data is shown.

Figure 1(b) plots the percentage of atoms which are icosahedrally coordinated as a function of temperature for both instantaneous and CG-q configurations at a given temperature. To determine the icosahedral content of a configuration, a Voronoi tessellation of the configuration is performed using the atomic positions as the Voronoi centers, and all atoms whose Voronoi polyhedron has 12 faces, each with five edges, are identified as being icosahedrally coordinated. In both cases, the icosahedral content increases with decreasing temperature. For the case of the CG-q configurations an approximate plateau is reached just below k B T G, whereas for the instantaneous configurations the increase is more gradual. This difference is explained by instantaneous configurations containing thermal noise in the atomic displacements, which perturb for a short period of time the local structure such that the Voronoi icosahedral identification algorithm fails to identify the icosahedral geometry. The CG-q data of Fig. 1(b) demonstrates the icosahedral fraction saturates below the temperature regime of T G. Inspection of icosahedral clusters of this sample (as defined by a connected set of nearest neighbor icosahedrally coordinated atoms), reveals this saturation is not the result of a system spanning cluster, but is rather due to a dense population of clusters consisting of several tens of atoms. Comparison of those atoms icosahedrally coordinated at 0 K with those at higher temperatures reveal an overlap greater than 90% for T < T G. Above T G this overlap drops rapidly to approximately 10%. Thus the developing icosahedral network effectively locks in (at the timescale of the current quench simulation) for temperatures well below the glass transition. Reference Baumer and Demkowicz41
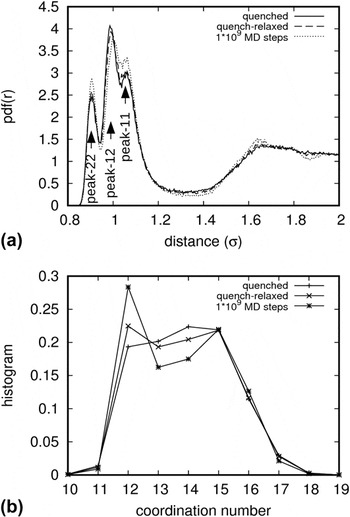
The final zero temperature sample is referred to as the quenched sample. Figure 2 plots the pair distribution function (PDF) and the coordination histogram of this configuration. The form of the PDF is typical for the used Lennard-Jones potential, Reference Wahnström39,Reference Derlet, Maaß and Löffler42 where the first nearest-neighbor peak in Fig. 2(a) has three contributions corresponding to the partial-PDFs between atoms of type 1 and 1 (peak-11), 2 and 2 (peak-22), and 1 and 2 (peak-12) [see Fig. 3(a) in Ref. Reference Derlet, Maaß and Löffler42]. The coordination histogram [Fig. 2(b)] for the quenched sample demonstrates a broad peak, which is due to two overlapping distributions [not shown here—see Fig. 3(c) in Ref. Reference Derlet, Maaß and Löffler42] corresponding to atoms of type 1 (centered at a coordination of 15) and of type 2 (centered at a coordination of 12). Thus the coordination of type 2 atoms is most likely to be 12, which is compatible with the observation that virtually all icosahedrally coordinated atoms are of type 2.
(a) Pair distribution function and (b) coordination histogram of the quenched, quench relaxed, and 109 MD step samples.

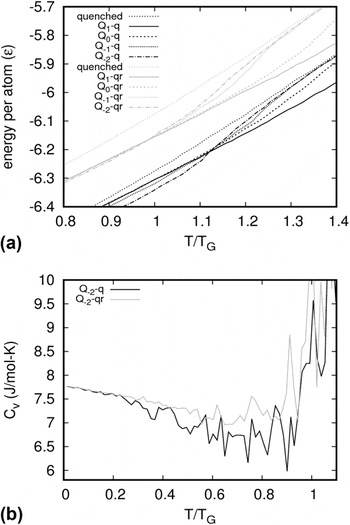
The final zero temperature sample, referred to as the quenched sample, is ramped in temperature up to and beyond T G using ramp rates spanning four orders of magnitude—Q −2, Q −1, Q 0, and Q 1, where Q n = −10 n Q LQ. Figure 3(a) displays, as dark lines, the internal energy as a function of increasing temperature for the quenched sample. The data of Fig. 1(a) is also included as a finely dotted line.
(a) Linear ramping protocol from a 0 K amorphous structure showing the potential energy per atom as a function of temperature in the vicinity of the glass transition. Data is shown for the four considered ramp rates for both the quenched and quench-relaxed samples. For easier viewing, the quench-relaxed data is shifted upwards by 0.2ε. (b) The derivative of the potential energy of the slowest ramp rate for the quenched sample, giving the heat capacity at constant volume.

The data reveals little difference in the internal energies between different ramp rates up to a temperature of approximately 0.6T G—all following the trend associated with the linear quench protocol. However, at higher temperatures, the curves begin to diverge, with the slower ramp rates showing a reduced gradient. This indicates relaxation occurs. At T G, the gradient with respect to temperature of the internal energy increases for all ramp rates, with all curves eventually rejoining the linear quench curve of the under-cooled liquid regime. Inspection of the glass transition regime demonstrates the slower temperature ramp rates transit to the “liquid” state at lower temperatures and over a narrower temperature interval. This indicates that the slower ramp rates have sufficient time to forget their lower temperature amorphous structure, over a shorter temperature interval, just as slower quench rates have sufficient time to forget their higher temperature “liquid” state.
The derivative with respect to temperature of the curves in Fig. 3(a) gives the heat capacity at constant volume. Figure 3(b) plots the resulting heat capacity for the slowest Q −2, and demonstrates a form which is similar to what is seen experimentally for metallic glasses. The vertical scale is given in units of J/molK and demonstrates (upon integration up to T G) the total heat flow in terms of potential energy is of the order of approximately 2.5 kJ/mol—a value that is not significantly greater than experiment (which, however, considers total enthalpy flow). It is noted that a direct one-to-one comparison with experiment is somewhat problematic since, via differential scanning calorimetry (DSC), it is the heat capacity at constant pressure which is usually measured. Reference Sun, Concustell and Greer5,Reference Chen and Coleman43 A more detailed comparison of heat flow between simulation and experiment will be discussed in Sec. V.
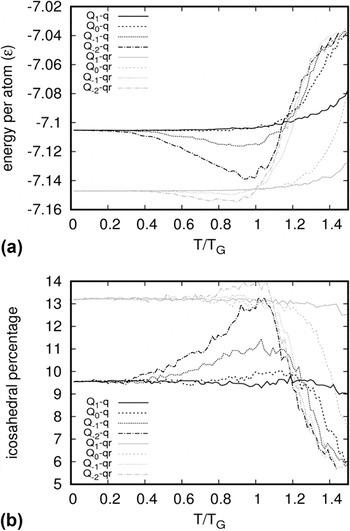
To directly observe the degree of relaxation occurring during the temperature ramps, CG-q configuration quantities as a function of temperature are now inspected. Figure 4 displays the potential energy and icosahedral percentage for the CG-q samples as a function of increasing temperature, for the four considered ramp rates. It is seen that when the ramp rate is lower than the initial quench rate, the energy of the CG-q samples decreases as the temperature is increased. This trend continues to just below T G, after which the CG-q energy rapidly increases, converging to the values of the faster ramp rates. With the observed energy relaxation close to but less than T G, comes an increase in icosahedral content—see Fig. 4(b). Thus for the slower ramp rates, the amorphous structure begins to relax well below T G, both in terms of a decreasing cohesive energy and increased icosahedral percentage. For the Q −2 temperature ramp, the energy reduction is similar to that estimated from the heat-capacity curves displayed in Fig. 3(b). The trend of increasing icosahedral content with decreasing energy is a general feature of metallic amorphous systems Reference Sheng, Luo, Alamgir, Bai and Ma44 with past atomistic simulations observing a linear relationship between the two quantities. Reference Ding, Cheng and Ma45
Linear temperature ramping protocol from a 0 K amorphous structure showing the CG-q (a) potential energy per atom and (b) icosahedral percentage as a function of temperature. Data is shown for the four considered ramp rates.

Together these results indicate significant structural relaxation which occurs at temperatures close to, but below, the glass transition regime. This suggests an efficient simulation protocol to produce a relaxed amorphous configuration should involve halting the linear quench protocol at the temperature where this maximum relaxation occurs. At this fixed temperature, the system is then relaxed as long as possible, followed by the normal linear quench protocol toward 0 K. This protocol is now performed by taking an atomic configuration at a temperature of T = 0.95T G, and allowing it to relax at that temperature for approximately 30 million molecular dynamics iterations. During this relaxation significant energy relaxation and icosahedral fraction increase are observed (not shown). After this, the linear quench protocol is performed at the original quench rate Q LQ, bringing the sample to zero Kelvin. This sample is referred to as the quench-relaxed sample. Figure 1(a) displays the resulting internal energy per atom as a function of temperature for the final linear quench protocol. It is seen that the energy per atom has non-negligibly reduced indicating a more relaxed configuration, whilst the gradient with respect to temperature is constant and equal to that of the quenched sample at low temperatures. Figure 1(b) displays the resulting CG-q icosahedral percentage during the linear quench part showing the icosahedral content for this more relaxed sample has increased by approximately three percent. Figure 2(a) plots the corresponding PDF and it is seen that there is a slight increase/decrease of the peak-22/peak-12 indicating a general increase in the coordination around the smaller atoms of type 2, at the expense of more distant atoms of type 1. This is directly seen in the coordination histogram [Fig. 2(b)] which demonstrates a distinct peak that has emerged at a coordination of 12 for particles of type 2. Such a restructuring of the nearest neighbor environment is in agreement with the increase in icosahedral content of the sample is observed in Fig. 1(b).
A similar temperature ramping protocol is performed for the quench-relaxed sample using the four ramp rates Q 1, Q 0, Q −1, and Q −2 and the resulting data is shown in Figs. 3 and 4 as dashed lines. The internal energy per atom as a function of increasing temperature [Fig. 3(a)] demonstrates little difference in internal energies between different ramp rates up to a temperature of approximately 0.95T G, indicating that much less relaxation has occurred when compared to the quenched sample. At higher temperatures, the faster ramp rates converge to the under-cooled liquid curve at much higher temperatures than for the quenched sample, again indicating that the quench-relaxed sample is significantly more relaxed. This is further seen in the CG-q configurations (Fig. 4), which shows similar trends to that seen for the quenched sample in terms of increasing icosahedral content with decreasing energy, but at a significantly reduced level. These trends are also reflected in the calculated heat capacity [Fig. 3(b)], which demonstrates a reduced signature at and below the glass transition regime.
IV. ATOMIC-SCALE ACTIVITY DURING TEMPERATURE RAMPING
To investigate the nature of atomic scale activity as the temperature is ramped, the atomic displacements between the CG-q configurations (used in Fig. 4) of neighboring temperatures are calculated. This has the advantage of removing thermal noise and explicitly considers displacements associated with a change to a different local potential energy minimum. Such displacement data is used to quantify the level and nature of structural change as a function of temperature and ramp rate.
Direct visual inspection of the atomic displacement fields reveals:
-
(i) Atomic displacements may be characterized by a central region containing a number of atoms with maximum displacement magnitude, surrounded by a field of smaller displacements whose magnitudes decrease irregularly with increasing distance from the central region.
-
(ii) The abundance of these local displacement structures increases with temperature.
-
(iii) In some cases, the displacement structure disappears at a later time, and often at a higher temperature, indicating reversible activity. Reappearance is also observed.
-
(iv) At the lowest temperatures (T < 0.5T G) the atomic displacements of the central atoms are typically a fraction of a bond length, whereas at temperatures approaching T G, the central atomic displacement magnitude is typically a bond length.
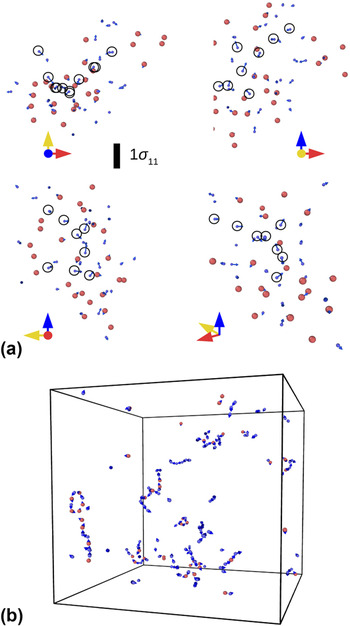
Figure 5(a) gives an example of a displacement structure occurring at 0.17T G, showing the central atoms undergoing the largest displacements, surrounded by a smaller field of accommodating displacements. Only atoms with displacements greater than 0.1σ11 are shown with the largest displacements being approximately 0.4σ11. To aid in the three-dimensional visualization of this activity, four different viewing orientations are shown and a sub-set of atoms are circled. Figure 5(b) plots a displacement map of the entire simulation cell at the temperature 0.48T G. Here, only atoms with displacement magnitudes greater than 0.5σ11 are shown. Inspection of the figure reveals several local displacement fields in the form of sequential chain like motion in which one atom replaces the position of another atom. Because of the relatively large minimum displacement threshold, the surrounding (and smaller) displacement fields are not seen in this figure. Close inspection of each chain-like structure reveals atomic displacement magnitudes of the order of σ11, which is the typical length scale of the nearest neighbor distance [see Fig. 2(a)]. These displacement structures involve chains of linear extent, strongly curved chains, and also closed loop chains. Such string-like atomic displacements have been observed in simulations of the under-cooled liquid Reference Donati, Douglas, Kob, Plimpton, Poole and Glotzer47–Reference Kawasaki and Onuki51 and the amorphous solid Reference Faupel, Frank, Macht, Mehrer, Naundorf, Rätzke, Schober, Sharma and Teichler52–Reference Teichler55 regimes. Moreover, the displacement fields seen in the present dynamical simulations are similar to those obtained using the ARTn PEL exploration method. Reference Swayamjyoti, Löffler and Derlet35,Reference Swayamjyoti, Löffler and Derlet38 Following these later past works, such activity will be referred to as LSEs.
Atomic displacement map at (a) the temperature T = 0.17T G, showing one local group of atoms undergoing a structural transformation (with atoms undergoing the largest displacements circled) and (b) at the temperature 0.48T G, showing several local groups of atoms undergoing a structural transformation. Here each vector indicates the atomic displacement and each ball (large/small corresponding to atoms of type 1/2) indicates the initial position of the associated atom. Only atoms whose displacement is greater than 0.1σ11 and 0.4σ11 are respectively shown in (a) and (b). In (a) four different view directions are given as defined by the indicated orthogonal axes shown in each sub-panel. Visualization is via OVITO. Reference Stukowski46 In (a) a scale bar is given in terms of the length unit σ11 and in (b) the bounding box represents the three-dimensional periodic simulation cell which has a side length of 29.0613σ11.

The larger displacements seen in Fig. 5(b) at the temperature 0.48T G, compared to those in Fig. 5 at the temperature 0.17T G reflect the general trend that with increasing temperature, individual atomic displacements increase. This trend has been seen in past work Reference Schober, Gaukel and Oligschleger53,Reference Oligschleger and Schober54 and is compatible with the quadratic relationship between maximum atomic displacement and barrier energy found by Fan et al. Reference Fan, Iwashita and Egami36 The displacement structures shown in Figs. 5(a) and 5(b) are from the quench-relaxed sample for the Q −1 ramp rate. Similar results are obtained for the other ramp rates and also the quenched sample. This behavior reflects a transition from a regime of sub-bond-length displacements, which might be identified as the so-called rattling-in-the-cage to a regime of super-bond-length displacements Reference Ciamarra, Pastore and Coniglio56 —a transition which here occurs below the glass transition regime.
Through an analysis of the characteristic environment and atom type of the those atoms involved in the localized structural excitations, it is found that atoms of type 2 (the smaller atoms) are mainly involved. For both the quench and quench-relaxed samples, the percentage of initially icosahedrally coordinated atoms is about 2–4%—a percentage significantly lower than the total average seen in Fig. 1(b). This is related to the observation that those atoms involved are generally under-coordinated with an average coordination (nearest neighbor number) typically in the range of 9–11.5. For the quenched sample, the average atomic volume of those atoms involved is slightly below that of the global average of type 2 atoms, whereas for the quench-relaxed sample, the average volume is about 20% lower at T < 0.1T G increasing to the volumes seen in the quenched sample at T ∼ 0.8T G. For the quenched sample, the average number of atoms involved in an LSE ranges between 1 and 3, whereas the quench-relaxed sample it is 1–2 atoms. The more relaxed sample tends to admit more localized LESs—a result also seen in the work of Fan et al. Reference Fan, Iwashita and Egami36
V. DISCUSSION AND CONCLUDING REMARKS
The main findings of the current work may be summarized as:
-
(i) When quenching from the high-temperature equilibrium liquid state, the icosahedral content increases as a function of decreasing temperature until the glass transition temperature regime. Below this temperature regime, and at the time-scale of the quench simulation, the icosahedral content plateaus to a maximum value.
-
(ii) Efficient relaxation of computer generated amorphous structure occurs at a temperature just below the fictive glass transition temperature.
-
(iii) Linear temperature ramping protocols, involving four orders of magnitude difference in ramp rate, reveal significant thermally activated relaxation (increased icosahedral content) well below the glass transition temperature.
-
(iv) This structural relaxation is mediated by thermally activated LSEs consisting of a chain of central atoms undergoing maximum displacement surrounded by a field of smaller displacements. At lower temperatures, the central displacements are less than that of the mean atomic distance, however, as the temperature approaches the glass transition regime, the central maximum displacements are typically the magnitude of a bond length. This suggests a transition from correlated rattling-in-a-cage to that of atomic hops. The temperature regime at which this change occurs will depend on the temperature ramp rate and more generally on the time-interval of observation.
-
(v) The atoms involved in such LSE activity originate in regions characterized mainly by low coordination, high density and low icosahedral content. Atoms of type 2, the smaller atoms, are predominantly involved.
Findings 4 and 5 are compatible with the original work of Wahnström Reference Wahnström39 who also observed chain-like structural activity occurring mainly for the smaller atoms for the Lennard-Jones parameterization presently used. In that work, this latter result was speculated to be due to the small system size of the simulation (500 atoms). The much larger system size considered here precludes this. The ARTn work Reference Swayamjyoti, Löffler and Derlet35,Reference Swayamjyoti, Löffler and Derlet38 finds that the obtained LSEs also mainly involve the smaller atoms. A possible origin for the observed asymmetric activity in terms of particle size might lie in the approximately linear scaling between barrier energy and positive internal pressure signature of the LSE at its saddle point [see Fig. 7(a) of Ref. Reference Swayamjyoti, Löffler and Derlet38], which implies the barrier energy is strongly influenced by the elastic response of the surrounding matrix. The dominance of small-atom involvement in thermally activated LSEs may be then understood by acknowledging that the movement of a larger atom will induce a larger hydrostatic strain on the surrounding matrix and therefore have a larger hydrostatic pressure signature. In turn, this will tend to result in a larger barrier energy for the saddle-point configuration and accordingly make the associated thermally activated process rarer.
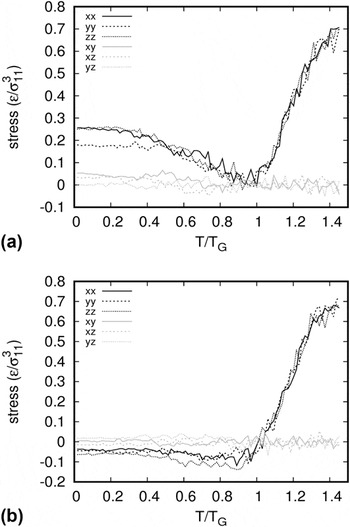
What drives such structural relaxation? Since the simulations were performed at fixed volume, a state variable (in addition to internal energy) will be the stress of the simulation cell. Figure 6 displays the components of the global stress for the quenched and quench-relaxed samples as a function of temperature for the slowest ramp rate Q −2. It is seen that the diagonal components of the quenched sample are non-zero and positive at 0 K, and therefore the simulation cell is under a state of compression. Upon temperature ramping, these components reduce almost to zero as T G is approached, whereas above the glass transition temperature regime they increase as the liquid regime is entered. On the other hand, the quench-relaxed sample has initially negative diagonal components and is therefore under tension. Upon ramping, these values continue to decrease. Together these results suggest that further structural relaxation will result in an increasingly negative (tensile) hydrostatic pressure.
Global stress components as a function of temperature for the CG-q configurations of the (a) quenched and (b) quench-relaxed samples at the Q −2 ramp rate.

Inspection of Fig. 6 reveals that the off-diagonal stress components remain small relative to the diagonal stress components at low temperatures. This is most likely due the high temperature liquid (from which the glass is prepared) being unable to support a shear. For the quench-relaxed sample, these components fluctuate around zero, whereas for the quenched sample, two components are initially non-negligibly finite at zero temperature. This is not systematic across different configuration realizations and probably due to a random fluctuation in shear stress of the liquid being frozen-in as the system transits to the amorphous solid regime. Such scatter in the shear stresses will then naturally be reduced in the quench-relaxed sample, since there is enough time for the system to relax these internal shear stress inhomogeneities. What ever their initial small values are, upon temperature ramping these shear stresses reduce and eventually fluctuate around zero at temperatures well below the glass transition for the slowest ramp rate considered. Together, these observations indicate it is the reduction in enthalpy (here at fixed volume) which drives structural relaxation, where both the internal energy and hydrostatic pressure are intimately related to atomic structure. In other words, the degree of structural relaxation (here defined by the fraction of icosahedral atoms) correlates most strongly with a reduction in enthalpy at fixed volume.
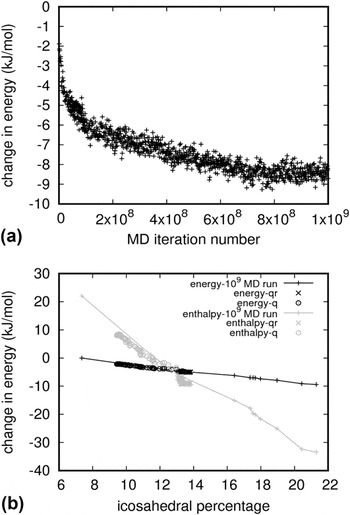
The above conclusion may be further verified by considering the behavior of a long-time relaxation simulation at a constant temperature of 0.95T G. Figure 7(a) plots the instantaneous potential energy (in units of kJ/mol) over a period of one billion molecular dynamics iterations, which (for a metal) would correspond to approximately one micro-second of physical time. At various time intervals of the relaxation simulation a linear quench at the rate Q LQ is performed to obtain a zero temperature amorphous structure. Figure 7(b) plots the resulting potential energy per atom as a function of icosahedral content. A similar linear relationship between energy and icosahedral content was seen in Ref. Reference Ding, Cheng and Ma45. Also shown is the enthalpy as a function of icosahedral content. Figure 7(b) demonstrates the dominance of enthalpy rather than energy as the key parameter, in measuring the energy release/storage of (in this case) structural relaxation. The PDF and coordination histogram associated with the one-billion iteration sample is shown in Fig. 2. Inspection of the figure, and comparison to the quench and quench-relaxed samples, indicates the same trend of an increasing peak-22 and an increasing coordination of 12 for atoms of type 2. This is again consistent with the observed increased icosahedral content of this sample. Inspection of the PDF [Fig. 2(a)] at distances beyond the nearest neighbor peaks also indicates a developing structure (not present in the quench and quench-relaxed samples) which is indicative of a developing medium range order—an aspect which will be investigated in future work.
(a) Instantaneous potential energy per atom as a function of molecular dynamics iteration number performed at a temperature of 0.95T G. (b) Zero Kelvin potential energy and enthalpy as a function of icosahedral content. Each data point represents a configuration which has been quenched (at the rate Q LQ) from configurations at T = 0.95T G, taken at various points along the relaxation curve of (a). Also shown in (b) is the energy/enthalpy versus icosahedral content for the slowest temperature ramp for the quenched and quench-relaxed samples (derived from the data in Figs. 4 and 6—here, only the temperature range for which relaxation occurs is included).

The energy and enthalpy versus icosahedral content derived from the slowest temperature ramp for both the quenched and quench-relaxed samples (the data contained in Figs. 4 and 6) is also included in Fig. 7, and shows good overlap with the one billion iteration MD relaxation run. Only that part of the temperature ramp involving relaxation [see Fig. 4(a)] is included. The observation that this curve is largely independent of sample realization demonstrates the approximate universality of this curve. Indeed for larger system sizes this universality is most likely to be exact, because the irregularities seen for the present system size should self-average at a sufficiently large volume. Figure 7 is a remarkable result since it suggests the energetics of the icosahedral content (and possibly its connectivity) follows a set of well-defined (but as yet unknown) constraints.
The high enthalpy release of a few tens of kJ/mol, seen in Fig. 7, due to relaxation is about an order of magnitude greater than that typically seen in experiments performed at much lower temperatures and longer time-scales than the micro-second considered here. Reference Sun, Concustell and Greer5 For rapidly quenched (melt-spun) metallic glasses values of up to 5 kJ/mol have been reported Reference Battezzati, Riontino, Baricco, Lucci and Marino57 with the representative value being about 1 kJ/mol—a lower bound value which has been associated with the creation of a single shear band. Reference Pan, Chen, Liu and Li58 The difference in change-in-enthalpy between simulation and experiment will also be, in part, due to the simulated samples being considerably less relaxed than that typically encountered in experiment.
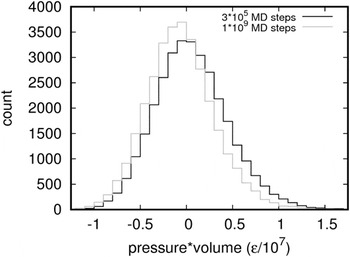
The origin of the pressure evolution may be seen via inspection of the local atomic pressure. Figure 8 displays local pressure histograms taken from the left most (105 MD steps) and right most (109 MD steps) configurations used in Fig. 7(b). The local pressures are given in units of pressure times volume, and when added together and divided by the total volume of the simulation cell will give the global pressure in units of Pascal. Representing the local pressure in this way avoids the need for defining a local atomic volume for each atom. The data shows that pressure reduction during relaxation at T = 0.95T G involves both a shift and narrowing of the local pressure distribution. This narrowing occurs primarily due to contraction of the distribution’s positive (compressive) tail. Thus, in terms of local pressure, the more relaxed the sample is, the more homogeneous the sample becomes at the atomic scale level.
Histograms of local pressure for two quenched samples taken after 105 and 109 molecular dynamics iterations of the relaxation simulation shown in Fig. 7(a).

The strong connection between pressure and icosahedral content may be qualitatively rationalized via the premise that the system attempts to maximize local packing via the minimization of bond energies. Reference Chaudhari and Turnbull59 In three dimensions, this is done via tetrahedral groupings of four neighboring atoms, which in turn are optimally packed locally to produce the icosahedral structure. Since this cannot be done with each bond energy being locally minimized (even for a mono-atomic system), bond frustration occurs, and a local non-zero pressure develops. Overall structural relaxation may then be seen as a global optimization of this local structure which reflects a decrease in pressure and an increase in icosahedral content as seen in Figs. 7 and 8. It is therefore unsurprising that the observed atomic scale activity is concentrated in regions which are under-coordinated and at a higher local density.
Whilst the presently used Lennard-Jones potential precludes direct quantitative comparison with a particular experimentally realizable binary bulk metallic glass, numerous past works have shown that its use qualitatively reproduces the behavior seen when many-body potentials based on, for example, the Embedded Atom Model (EAM) Reference Daw and Baskes60 are used. Such potentials phenomenologically model the unsaturated nature of the metallic bond. The similar results are due to a number of reasons. Firstly, this is because EAM potentials, like that of pair potentials, are central force potentials (even though they are often referred to as many-body potentials)—there is no explicit angular dependence. Secondly, because electron densities within a bulk metallic glass do not vary greatly throughout the material, the embedding functional is often well approximated by the linear term in a Taylor-series expansion with respect to electron density, giving an effective pair potential when it comes to evaluating the energy of a bond and the forces between atoms. Indeed, deviations in electron density (for which the unsaturated metallic bond needs to be taken into account explicitly and for which the EAM formalism was originally developed) such as that seen at surfaces and localized vacancies are not expected to be present in BMG. Finally, whilst the use of a pair potential does result in the Cauchy relationship (3B/5 = G, where B is the bulk modulus and G is the shear modulus) for a metallic crystal, this turns out not to be the case for a glass. Reference Suzuki and Egami61 In fact because of a lack of local symmetry in a glass structure there is a strong nonaffine contribution to the shear modulus, which reduces its value significantly Reference Léonforte, Boissière, Tanguy, Wittmer and Barrat62–Reference Tsamados, Tanguy, Goldenberg and Barrat64 —see also Ref. Reference Derlet, Maaß and Löffler42 which calculates the elastic constants for the presently used LJ potential, demonstrating a breakdown of the isotropic Cauchy relationship and a ratio of bulk modulus to shear modulus which is not so different from that of typical metallic glasses.
Extensions to the present work should consider temperature ramping simulations at constant pressure, such that thermal expansion and volume relaxation occur as the temperature increases. This will allow for a more direct comparison to experiment, where for example the heat capacity at constant pressure could be determined. Indeed, how the presently observed temperature dependent thermal activity might change under constant pressure conditions will give insight of how the thermally accessible PEL changes as a function of atomic density—answering such questions as whether or not thermal activity becomes more or less abundant at fixed temperature as the atomic density is decreased. An additional (crucial) aspect, which has also not been considered in the present work is the dependence of the observed thermal activity and structural relaxation on different atomic type concentrations and atom size ratios. Such material specific parameters strongly affect the ability of a glassy system to form icosahedral networks Reference Sheng, Luo, Alamgir, Bai and Ma44,Reference Ma65,Reference Miracle66 and therefore more stable amorphous structures. Furthermore, it has long been recognized that these quantities play a fundamental role in the glass formability of a binary alloy, Reference Tanaka67 and knowledge of the relationship between thermal activity and these material parameters in terms of enthalpy versus icosahedral content is of fundamental interest particularly in light of the growing interest in thermal–mechanical treatment protocols to produce homogeneously rejuvented or aged amorphous metals with a defined enthalpy and therefore structural state. Reference Sun, Concustell and Greer5
In conclusion, the present simulation work demonstrates significant atomic scale activity well below the glass transition temperature regime for a model Lennard-Jones binary glass system at fixed atomic density and atom type ratio. The microscopic relaxation processes are seen to be mediated by thermally activated localized structural excitations, which at the lower temperature regime takes the form of sub-bond-length atomic displacements. At higher temperatures, which begin to approach the glass transition regime, bond-length atomic displacements increasingly occur. These involve sequential string-like motion in which one atom replaces that of a neighboring atom. The observed relaxation, as characterized by the icosahedral content, is found to be driven mainly by pressure and therefore enthalpy in which the local atomic pressure distribution narrows with increasing relaxation. Through very long-time simulations involving an order of a micro-second of physical time, experimentally realistic relaxation enthalpies in the tens of kJ/mol range are beginning to be approached. Whilst the present work has been done under zero-load conditions, the results indicate thermally activated plasticity will occur for arbitrarily small loads—a conclusion which is compatible with recent thermo-plastic experimental bulk metallic glass preparation protocols and which will be investigated in future simulation work.
ACKNOWLEDGMENTS
The authors thank K. Albe, T. Brink, J. Loeffler, H. Roesner, D. Rodney, and G. Wilde for insightful discussions.