





Introduction
Application of biochar, a carbon-rich material produced from incomplete combustion of carbon-containing materials (e.g., agricultural residues and by-products, animal wastes, timber industry by-products, and municipal wastes), has gained attention as a soil amendment owing to its impact on soil improvement and restoration, soil carbon sequestration, and climate mitigation strategies (Blanco-Canqui Reference Blanco-Canqui2017; Kalu et al. Reference Kalu, Kulmala, Zrim, Peltokangas, Tammeorg, Rasa, Kitzler, Pihlatie and Karhu2022; Zhang et al. Reference Zhang, Xing, Wei, Liu, Zhao, Liu, Wang, Liu, Ren, Jia, Wei, Siddique and Zhang2025). Based on raw materials and pyrolytic conditions involved in the production process, the yield and physicochemical properties of biochar vary significantly; therefore, the impact of biochar on soil properties varies (Premalatha et al. Reference Premalatha, Bindu, Nivetha, Malarvizhi, Manorama, Parameswari and Davamani2023; Yadav et al. Reference Yadav, Bhandari, Bhatta, Poudel, Bhattarai, Yadav, Ghimire, Prava, Pragya, Shrestha and Oli2023).
Overall impact of biochar on soil properties has been reported to improve water holding capacity and plant available moisture (Burrell et al. Reference Burrell, Zehetner, Rampazzo, Wimmer and Soja2016), total porosity (Liu et al. Reference Liu, Dugan, Masiello, Barnes, Gallagher and Gonnermann2016), cation exchange capacity (Van Zwieten et al. Reference Van Zwieten, Kimber, Morris, Ky, Downie, Rust, Joseph and Cowie2010), nutrient recycling (Akhil et al. Reference Akhil, Lakshmi, Kartik, Viet and Jayaseelan2021), and soil microbial activity (Yang et al. Reference Yang, Ye, Zhang, Zeng, Tan, Song and Chen2021), while reducing salinity (Karimi et al. Reference Karimi, Moezzi, Chorom and Enayatizamir2020), bulk density (Glab et al. Reference Głąb, Palmowska, Zaleski and Gondek2016), leaching (i.e., nutrients, heavy metals, and other contaminants; Lu et al. Reference Lu, Cai, Zhang, Zhuang, Hu, Wang, Chen and Wang2022), and trace gas emissions (Bolan et al. Reference Bolan, Hoang, Beiyuan, Gupta, Hou, Karakoti, Joseph, Jung, Kim, Kirkham, Kua, Kumar, Kwon, Sik and Perera2021). In the literature, biochar application rates varied from 5 to 50 Mg ha−1 depending upon soil type; sandy soils have been reported to show more effects upon addition of biochar compared with clay soils (Premalatha et al. Reference Premalatha, Bindu, Nivetha, Malarvizhi, Manorama, Parameswari and Davamani2023; Yadav et al. Reference Yadav, Bhandari, Bhatta, Poudel, Bhattarai, Yadav, Ghimire, Prava, Pragya, Shrestha and Oli2023). While improved water holding capacity, low salinity, and better nutrient recycling of biochar amended soils (5 to 15 Mg ha−1) have been reported to increase yield in various crops (Kannan et al. Reference Kannan, Krishnaveni, Ponmani, Singh and Singh2020; Liu et al. Reference Liu, Zhang, Ji, Joseph, Bian, Li, Pan and Paz-Ferreiro2013; Parmar et al. Reference Parmar, Nema and Agarwal2014; Yadav et al. Reference Yadav, Bhandari, Bhatta, Poudel, Bhattarai, Yadav, Ghimire, Prava, Pragya, Shrestha and Oli2023), other reports indicated no yield impact (Major et al. Reference Major, Rondon, Molina, Riha and Lehmann2010; Nzanza et al. Reference Nzanza, Marais and Soundy2012) or yield reductions at higher biochar doses (>30 Mg ha−1) (Jeffery et al. Reference Jeffery, Abalos, Prodana, Bastos, van Groenigen, Hungate and Verheijen2017).
Although biochar soil amendment has been acclaimed for several soil health parameters and other benefits such as reducing soil contaminants (e.g., heavy metals, pesticides, polychlorinated biphenyls, polycyclic aromatic hydrocarbons, and phenols), difficulties in weed management in biochar-amended soils using soil-applied preemergence herbicides have been understudied (Khorram et al. Reference Khorram, Zhang, Lin, Zheng, Fang and Yu2016; Wang and Wang Reference Wang and Wang2019). Application of 1% wheat (Triticum aestivum L.) straw char (19.5 Mg ha−1) to a Stuttgart silt loam soil (Arkansas, USA) resulted in 7 to 80 times higher sorption of diuron, leading to poor control of barnyardgrass [Echinochloa crus-galli (L.) Beauv.] (Yang et al. Reference Yang, Sheng and Huang2006). Nag et al. (Reference Nag, Kookana, Smith, Krull, Macdonald and Gill2011) observed poor weed control efficiency (WCE) of trifluralin and atrazine for annual ryegrass (Lolium rigidum Gaudin) in Australian soils amended with wheat straw biochar (19.5 Mg ha−1) and reported respective increases of 1.6 and 3.5 times in GR50 (i.e., dose required to reduce weed biomass by 50%). Application of commercial wood chip biochar (5 Mg ha−1) resulted in 50% and 95% decreases in WCE of pendimethalin and atrazine in a Dothan sandy loam soil of Florida, USA (Soni et al. Reference Soni, Leon, Erickson, Ferrell and Silveira2015). Although increasing the rate of wheat biochar from 5 to 15 Mg ha−1 improved soil quality parameters (40% to 200%) and growth (46% to 57%) of lentil (Lens culinaris Medik.), biochar reduced fomesafen WCE and increased weed growth by 200% (Khorram et al. Reference Khorram, Fatemi, Khan, Kiefer and Jafarnia2018). Nath et al. (Reference Nath, Dhyani, Singh, Chaturvedi, Praharaj and Sarvadamana2020) also observed low WCE of pendimethalin in biochar-amended (4 Mg ha−1) dry direct-seeded rice (Oryza sativa L.) fields and reported a 7.5% reduction in yield. In a clay loam paddy field system, biochar (oil palm [Elaeis guineensis Jacq.] empty fruit bunches and rice husk sources) applications at 19.5 and 78 Mg ha−1 increased GR50 values (1.5 and 7 to 8.5 times, respectively) for imidazolinone herbicides to control weedy rice (O. sativa ‘MR 269’) (Yavari et al. Reference Yavari, Kamyab, Abd Manan, Chelliapan, Asadpour, Yavari, Sapari, Baloo, Sidik and Kirpichnikova2022). These findings indicated that biochar applications at and above 4 Mg ha−1 can reduce WCE of several preemergence herbicides across various geographic locations. These studies also indicated a several-fold increase in GR50 values for various preemergence herbicides in biochar-amended soils, which could lead to higher production cost coupled with risks of environmental contamination. Hence, evaluating low doses of biochar to achieve desirable WCE of preemergence herbicides is critically important for effective management of cropping systems.
We hypothesized that biochar application at a low dose would maintain the WCE for a preemergence herbicide comparable to non-amended soil or reduce negative impacts observed at higher biochar doses. The present study aims to evaluate the effect of a low dose (2 Mg ha−1) of two commercial biochars developed from two different raw materials (sugarcane and pinewood), on WCE of two preemergence herbicides (metribuzin and S-metolachlor). Two troublesome agronomic weeds in the southeastern United States, Palmer amaranth (Amaranthus palmeri S. Watson) and crowfootgrass [Dactyloctenium aegyptium (L.) Willd.], were evaluated using label-recommended control rates of the herbicides on a biochar-amended loamy soil of Alabama, USA. Although the study was conducted under controlled greenhouse conditions and needs further field evaluation trials, its findings show that appropriate selection of biochar and preemergence herbicide can help to achieve desirable WCE at label-recommended doses.
Materials and Methods
Biochar, Soil, and Weeds
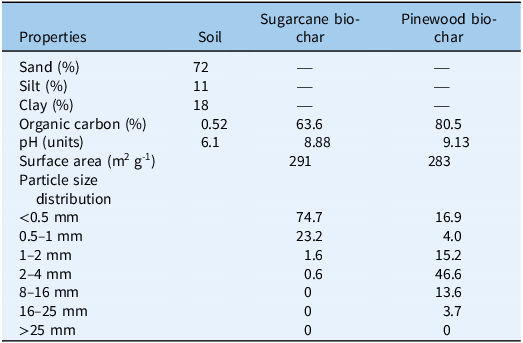
Commercially available sugarcane and pinewood biochars were supplied by Ashwood Trinity, Auburn, AL, USA. Table 1 shows various physicochemical properties of the studied biochars. Without further grinding, these were used in experimental runs to ensure retention of original physical properties. Bama sandy loam soil (fine-loamy, siliceous, subactive, thermic Typic Paleudults) used in the present study was collected from the Auburn University E.V. Smith Research and Extension Center, Shorter, AL, USA (32.442°N, 85.897°W) (Table 1). After being collected, soil samples were air-dried, passed through a 1-mm sieve, and used in different experiments. Seeds of A. palmeri and D. aegyptium, procured in 2022 from the Azlin Seed Service, Leland, MS, USA, were placed in permeable paper bags for storing under laboratory conditions at 20 ± 2 oC in the dark until commencement of the experiment.
Physicochemical properties of soil and biochar used in the study.

Table 1. Long description
A table comparing physicochemical properties of soil and biochars derived from sugarcane and pinewood. The table has four columns and eight rows, including headers. The columns are labeled Properties, Soil, Sugarcane biochar, and Pinewood biochar. The rows list various properties and their corresponding values for each category. Row 1: Sand (percent), 72, blank, blank. Row 2: Silt (percent), 11, blank, blank. Row 3: Clay (percent), 18, blank, blank. Row 4: Organic carbon (percent), 0.52, 63.6, 80.5. Row 5: pH (units), 6.1, 8.88, 9.13. Row 6: Surface area (m2/g), 291, blank, 283. Row 7: Particle size distribution, less than 0.5 mm, 74.7, 16.9. Row 8: Particle size distribution, 0.5 to 1 mm, 23.2, 4.0. Row 9: Particle size distribution, 1 to 2 mm, 1.6, 15.2. Row 10: Particle size distribution, 2 to 4 mm, 0.6, 46.6. Row 11: Particle size distribution, 8 to 16 mm, 0, 13.6. Row 12: Particle size distribution, 16 to 25 mm, 0, 3.7. Row 13: Particle size distribution, greater than 25 mm, 0, 0.
Chemicals and Reagents
Two preemergence herbicides were selected for the present study: metribuzin, representing photosystem II–inhibiting HRAC Group 5 herbicides; and S-metolachlor, representing very-long-chain fatty-acid elongase–inhibiting HRAC Group 15 herbicides. Metribuzin (TriCor® DF, UPL AgroSolutions Canada Inc., King of Prussia, PA, USA) and S-metolachlor (Dual Magnum®, Syngenta Crop Protection LLC, Greensboro, NC, USA) were used at recommended doses of 560 and 1,427 g ai ha−1, respectively. Analytical-grade standards of metribuzin and S-metolachlor were supplied by MilliporeSigma, St Louis, MO, USA. Anhydrous sodium sulfate and other analytical-grade solvents (methanol and ethyl acetate) were supplied by VWR International LLC, Radnor, PA, USA.
Biochar and Herbicide Treatments
Greenhouse trials were conducted in two experimental runs using a randomized complete block design at the Plant Science Research Center, Auburn University, AL, USA (32.588°N, 85.489°W), in 2025 (23 oC, 54% relative humidity, 16-h photoperiod). The three factors were: (1) biochar treatments (no biochar, sugarcane biochar [2 Mg ha−1], or pinewood biochar [2 Mg ha−1]); (2) herbicide treatments (no herbicide, metribuzin or S-metolachlor at recommended label rates); and (3) weed species (represented by a broadleaf [A. palmeri] and a grass weed [D. aegyptium]). The experimental unit consisted of a 0.254 m by 0.254 m by 0.0762 m polyethylene tray. For biochar treatments (2 Mg ha−1), the amount of biochar per tray (area = 0.064516 m2) was calculated on area basis. Therefore 12.9 g of the respective biochar was required per tray. The amount of soil required to fill each tray (0.254 m by 0.254 m by 0.0762 m) was 4.5 kg. For biochar treatments, 12.9 g of respective biochar was thoroughly mixed with 4.5 kg of soil. Control treatments without biochar were prepared using soil only. All soil treatments (with and without biochar) were watered and maintained at 50% water holding capacity for 7 d in a controlled greenhouse environment before sowing of weed seeds or herbicide applications. Then, 30 seeds per weed species were sown in two separate rows with a gap of 12.7 cm between the rows, followed by next-day application of selected preemergence herbicides at recommended label rates. All treatments were maintained at respective 50% water holding capacities at the time of spraying. All herbicides were applied using a CO2-powered backpack sprayer calibrated to deliver 187 L ha−1 of spray solution at 207 kPa output pressure. The backpack sprayer was equipped with a 1.9-m handheld boom containing four AIXR11002 flat-fan nozzles (TeeJet® Technologies, Glendale Heights, IL, USA) spaced 48 cm apart. All trays were moistened at regular intervals to maintain 50% water holding capacity of respective soil treatments. Each treatment had four replications per experimental run. Weed germination data were collected at 1, 3, 5, 7, 14, 21, and 28 d after sowing, and weed biomass was recorded on day 28. Percent germination and WCE were calculated using the following equations:
 $\%\rm{ Germination }=\left({\mathrm{Number\, of \, normal\, seedlings}}\over{{\mathrm{Number\, of\, seeds}}}\right)\times100$
 $\rm{WCE}(\%)=\left[\frac{\rm{(Number\ of\ normal\ seedlings\ in\ control}-\\\rm{Number\ of\ normal\ seedlings\ in\ treatment)}}{\rm{Number\ of\ normal\ seedlings\ in\ control}}\right]\times100$
Extraction and Analysis of Herbicide Residues
Twenty-five grams of soil samples (in triplicate) were collected from each treatment tray on days 7, 14, 21, and 28. Collected soil samples were air-dried and ground to pass through a 1-mm sieve. Soil samples were extracted sequentially to determine adsorbed, desorbed, and total sorbed residues (Ghosh and Singh Reference Ghosh and Singh2013). Processed soil samples (20 g) were agitated with 25 ml of aqueous solution of calcium chloride (0.01M) in 50-ml centrifuge tubes using an end-to-end shaker maintained at 100 rpm for 180 min at 28 ± 1 oC. Samples were centrifuged at 4,000 rpm for 10 min. The supernatant aqueous fraction (containing the readily desorbed fraction [D] of herbicide residues) and the soil sample (containing the adsorbed fraction [A] of herbicide residues) were collected and processed separately. The supernatant aqueous fraction was extracted with 25 ml of ethyl acetate by the liquid–liquid partitioning method over an end-to-end shaker maintained at 100 rpm for 180 min at 28 ± 1 oC. The ethyl acetate fraction was filtered through a layer of anhydrous sodium sulfate, evaporated to dryness, and redissolved in 1 ml of methanol for gas chromatography analysis. The soil fraction was reextracted with 25 ml of ethyl acetate over an end-to-end shaker maintained at 100 rpm for 180 min at 28 ± 1 oC. The ethyl acetate fraction was dried over anhydrous sodium sulfate and analyzed by gas chromatography. Total sorbed residue was calculated from the summation of adsorbed (A) and desorbed (D) residues.
An Agilent 6890N Series gas chromatography (GC) system fit with a mass selective detector (5975B Network) (Agilent Technologies, Santa Clara, CA, USA) and Restek 5Sil MS capillary column (length: 30 m; ID: 0.25 mm; film thickness: 0.25 µm) (Restek Corporation, Bellefonte, PA, USA) was used to analyze herbicide residues. The column temperature was kept at 60 oC for 1 min and then ramped to 300 oC at 25 C min−1 with holding times of 1 min, 1 min, and 2 min at 180 oC, 210 oC, and 300 oC, respectively. Inlet temperature was 280 oC with splitless injection mode, and ultra-pure helium gas was used as carrier with a flow rate of 1 ml min−1. The electron ionization (EI) mode was maintained at 70 eV, whereas the MS interface, source, and squad temperatures were maintained at 280 oC, 230 oC, and 150 oC, respectively. The injection volume was 1 µl. Identities of compounds were confirmed, and amounts were quantified using GC–mass spectrometry (GC–MS) in a single ion monitoring method. Retention time (Rt), quantifier ion (QtI), and qualifying ions (QfI) were used to confirm the identity of each herbicide: metribuzin Rt = 9.93 min, QtI m/z = 198, QfI m/z =214, 167, and S-metolachlor Rt = 10.52 min, QtI m/z = 162, and QfI m/z = 238, 252. The developed analytical method yielded 92.1% and 93.4% recoveries for S-metolachlor and metribuzin, respectively, at a 0.1 mg kg−1 spike level. The limit of detection (LOD) and limit of quantification (LOQ) values were 0.005 and 0.01 mg kg−1 and 0.003 and 0.01 mg kg−1 for S-metolachlor and metribuzin, respectively.
Statistical Analysis
Homogeneity between the two greenhouse runs was evaluated using generalized linear mixed models in JMP PRO v. 18 (JMP® 18, JMP Statistical Discovery, Cary, NC, USA). Run was included as a fixed main effect, and interactions between run and treatment factors (biochar, herbicide, and weed species) were tested for both germination and biomass data. Furthermore, the run by day interactions were also included for germination data to assess homogeneity between runs. As no significant run effects were detected (P > 0.05), data from the two runs were combined. Although both weed species were grown within the same tray, seeds of each species were planted in separate, clearly defined rows, and germination counts and biomass measurements were collected independently for each weed species. Interactions involving weed species were tested, and no significant run by weed species interactions were detected (P > 0.05), indicating consistent species responses across experimental runs. Pearson correlation analysis was used to examine associations between weed germination and adsorbed, desorbed, and total herbicide residues across sampling times (at 7, 14, 21, and 28 d; n =12). Analyses were performed separately for each weed species and significance was evaluated at α = 0.05 using JMP PRO v. 1.8.
Results and Discussion
Effects of Biochar on Weed Growth and WCE of Preemergence Herbicides
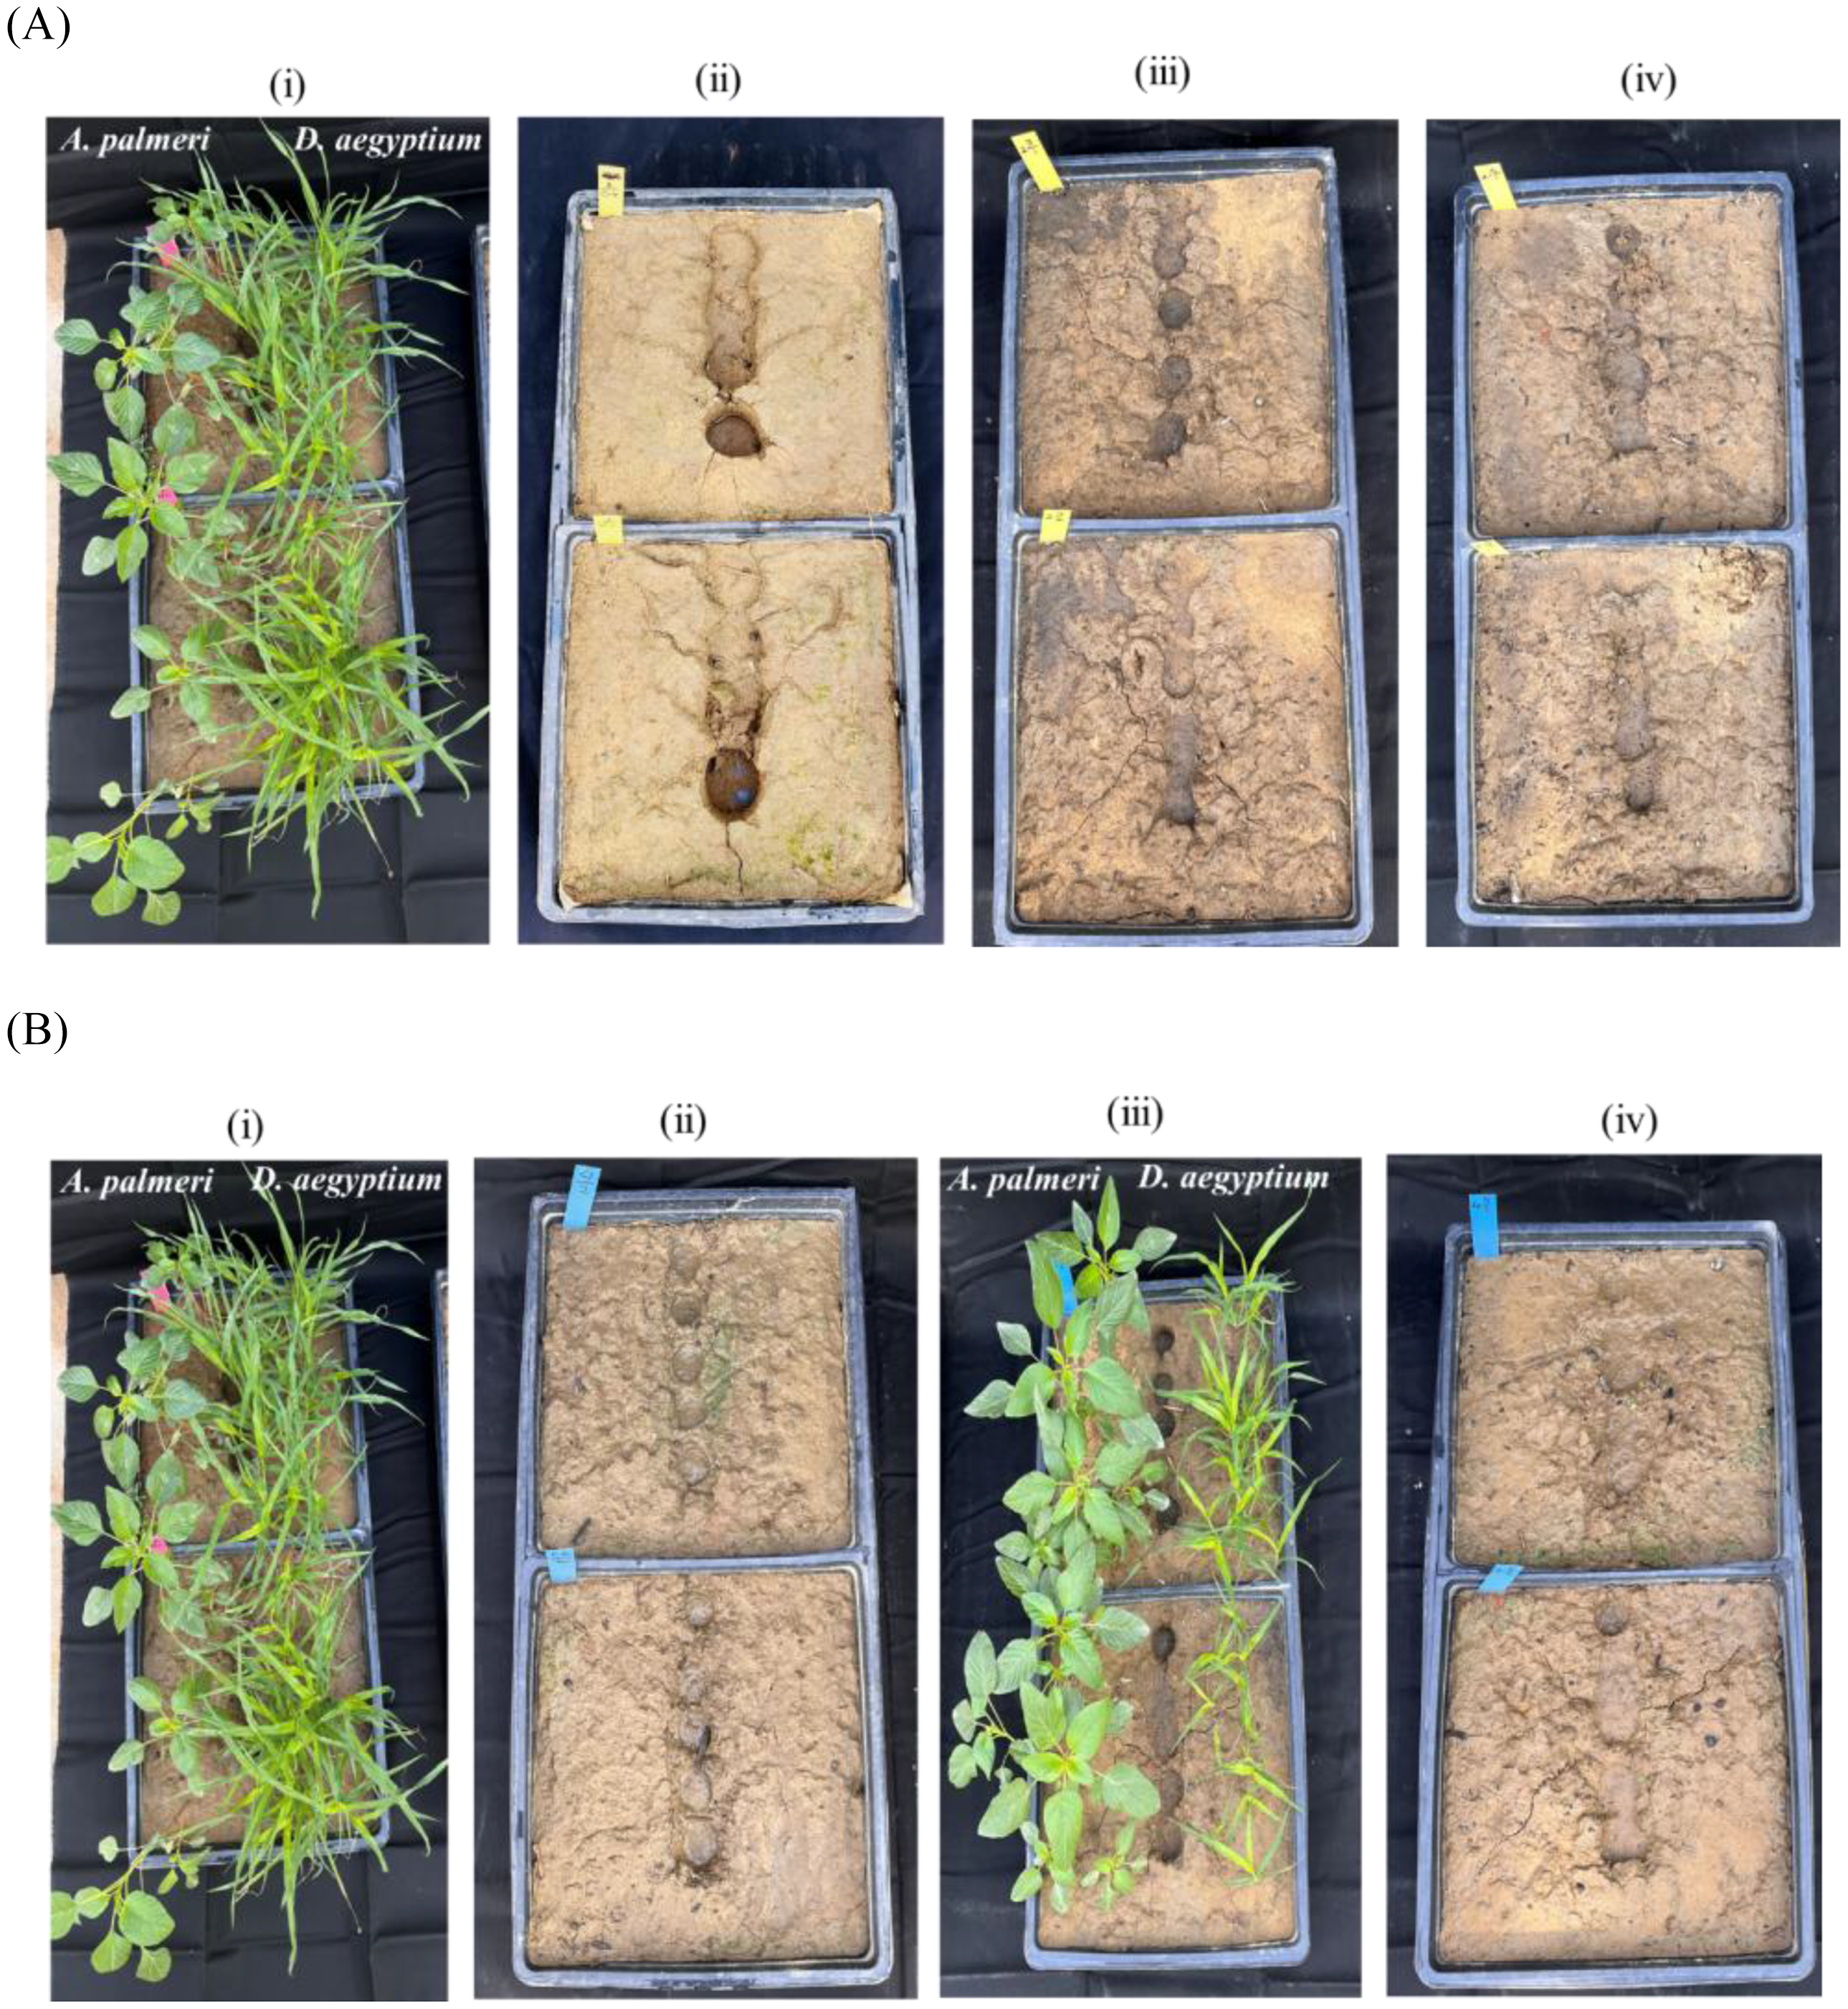
Application of sugarcane and pinewood biochars at 2 Mg ha−1 had differential impacts on weed growth (Figure 1) and WCE of preemergence herbicides. Under controlled greenhouse conditions, the treatment with no biochar and no herbicide showed nearly 15 (50% germination) and 23 (75% germination) seedlings out of 30 seeds per weed species of A. palmeri and D. aegyptium, respectively, with respective biomass yields of 46 and 69 g m−2 at the end of the 28-d experiment (Figure 1Ai). Application of metribuzin and S-metolachlor at recommended doses resulted in complete inhibition of germination of both weed species in soils with no biochar (Figure 1Aii and Bii). However, in sugarcane biochar-amended soils, nearly 8 and 6 seedlings out of 30 seeds per weed species of A. palmeri and D. aegyptium, respectively, were observed even after application of S-metolachlor at label-recommended dose. Therefore, sugarcane biochar reduced WCE of S-metolachlor significantly from 100% WCE in no-biochar soils to 46% and 74% for A. palmeri and D. aegyptium, respectively (P < 0.05). Weed biomass yields of 32 and 8.6 g m−2 were recorded for A. palmeri and D. aegyptium, respectively, in soils with sugarcane biochar treatments at the end of the 28-d experiment (Figure 1 Aiii). In contrast to S-metolachlor, 100% WCE was recorded with metribuzin in soils with sugarcane biochar (Figure 1Biii). Noticeably, complete inhibition of germination for A. palmeri and D. aegyptium, indicating 100% WCEs for metribuzin and S-metolachlor were observed in soils with pinewood biochar treatment (Figure 1Aiv and Biv).
Growth of Amaranthus palmeri and Dactyloctenium aegyptium at 28 d after application of (A) metribuzin and (B) S-metolachlor at recommended doses in soils with (i) no biochar and no herbicide, (ii) no biochar with herbicide, (iii) sugarcane biochar (2 Mg ha−1) with herbicide, and (iv) pinewood biochar (2 Mg ha−1) with herbicide.

Biochars developed from different raw materials have been reported to reduce the WCE of some preemergence herbicides. Soil amended with 1% (19.5 Mg ha−1) wheat straw biochar resulted in a 159% to 187% increase in biomass of Italian ryegrass (Lolium perenne L. ssp. multiflorum (Lam.) Husnot) and poor WCE for atrazine and trifluralin (Nag et al. Reference Nag, Kookana, Smith, Krull, Macdonald and Gill2011). The GR50 values for atrazine increased from 1.17 kg ha−1 ha to 4.16 kg ha−1 and from 1.45 kg ha−1 to 3.48 kg ha−1 for calcarosol and ferrosol soils, respectively. In the case of trifluralin, the GR50 values increased from 1.36 kg ha−1 to 1.48 kg ha−1 and from 1.00 kg ha−1 to 1.59 kg ha−1 for calcarosol and ferrosol soils, respectively. Nath et al. (Reference Nath, Dhyani, Singh, Chaturvedi, Praharaj and Sarvadamana2020) observed a 28.57% and 38.46% increase in weed number and weed biomass, respectively in 4 Mg ha−1 biochar-amended paddy soils over control for recommended application of pendimethalin (1.0 kg ha−1) followed by bispyribac-sodium (25 g ha−1) and also reported better WCE at higher doses of pendimethalin (2.0 kg ha−1) followed by bispyribac-sodium (25 g ha−1). Application of biochar from oil palm empty fruit bunches in a paddy soil increased GR₅₀ values of weedy rice (O. sativa MR 269) by 7.6%, 57.2%, 117.9%, and 673.9% for imazapic, 6.2%, 55.0%, 119.7%, and 710.6% for imazapyr, and 4.5%, 59.8%, 111.7%, and 666.9% for OnDuty® at 0.5%, 1.0%, 2.0%, and 4.0% application rates compared with their respective controls (95.5, 105.2, and 100 g ha−1) (Yavari et al. Reference Yavari, Kamyab, Abd Manan, Chelliapan, Asadpour, Yavari, Sapari, Baloo, Sidik and Kirpichnikova2022). The same study reported that application of biochar from rice husk increased GR50 values of weedy rice by 7.4%, 55.6%, 112.3%, and 647.3% for imazapic, 3.8%, 50.7%, 110.0%, and 703.8% for imazapyr, and 2.9%, 41.7%, 105.3%, and 624.7% for OnDuty® at 0.5%, 1.0%, 2.0%, and 4.0% application rates compared with their respective controls (95.1, 105.3, and 100 g ha−1). Khorram et al. (Reference Khorram, Fatemi, Khan, Kiefer and Jafarnia2018) reported that weed biomass increased by 78.4%, 186.3%, and 290.2% with 5, 10, and 15 Mg ha−1 applications of wheat straw biochar, respectively, using the recommended dose of fomesafen compared with the unamended control (51 g m−2). Therefore, biochar dose, raw materials used for biochar production, and soil types govern differential bioavailability of various herbicide molecules, leading to different WCE of preemergence herbicides.
The present study indicated that the application of pinewood biochar (2 Mg ha−1) resulted in 100% WCE for both preemergence herbicides (metolachlor and metribuzin). Although application of sugarcane biochar (2 Mg ha−1) decreased the WCE for S-metolachlor, complete weed control could be achieved with metribuzin. Therefore, findings of this greenhouse study indicated presence of biochar–herbicide–weed species specificity and also showed that appropriate selection of a biochar and preemergence herbicide could provide effective weed control. However, further field trials are required for verification before the locally available biochars are adopted at large scale in Alabama crop fields.
Herbicide Residue Analysis
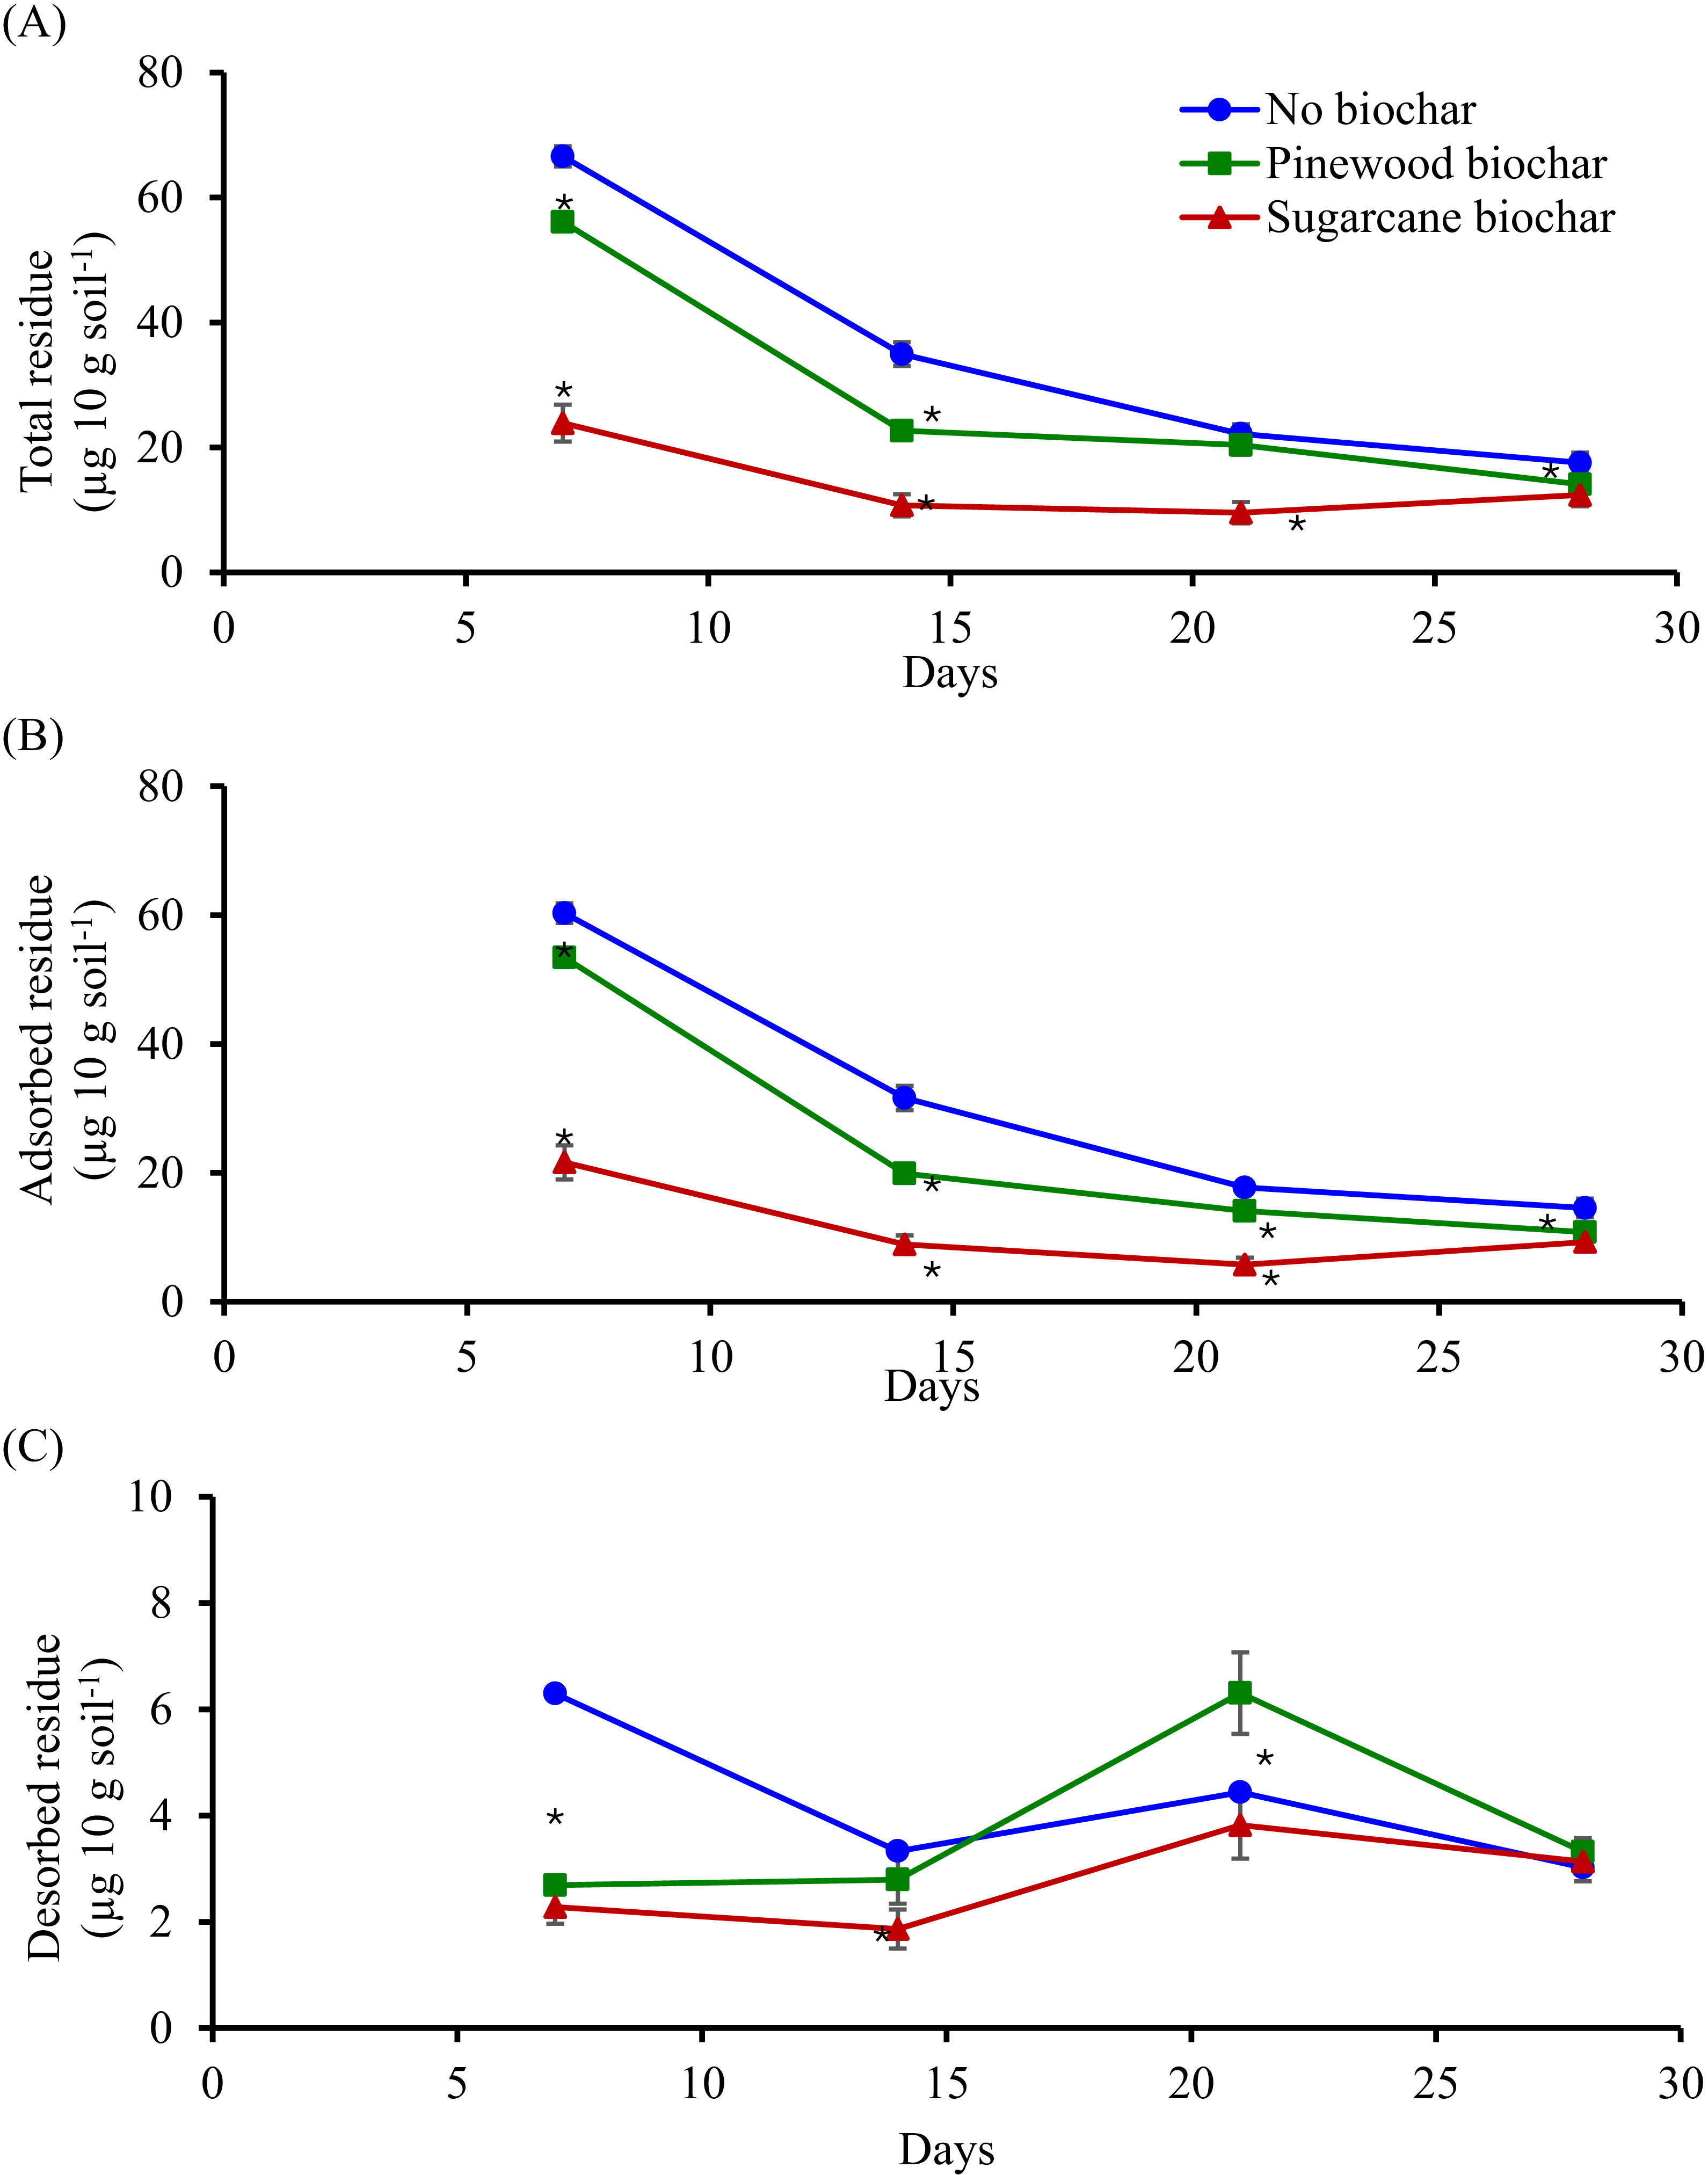
Biochar is known to adsorb and subsequently reduce the bioavailability of herbicide molecules. However, the extent of interaction depends on the characteristics of biochar (raw material used in biochar production, physicochemical properties, and application rate) as well as the properties of the herbicide itself (such as water solubility and K oc) (Nag et al. Reference Nag, Kookana, Smith, Krull, Macdonald and Gill2011; Spokas et al. Reference Spokas, Koskinen, Baker and Reicosky2009). In the present study, complete control of studied weeds was achieved with the label-recommended dose of metribuzin in soils amended with sugarcane and pinewood biochar. In contrast, altered WCE of S-metolachlor at its label-recommended dose in sugarcane and pinewood biochar-amended soils necessitated further analysis of herbicide residues. Figure 2 represents the change in total, adsorbed, and desorbed residues over the 28-d experimental period. Preemergence herbicide undergoes several processes after reaching the soil matrix and sorption is one of these important processes which determines availability of herbicide molecules. Herbicide molecules sorbed onto soil particles maintain an equilibrium with soil water–available herbicide molecules via adsorption and desorption processes. Hence, the amount of adsorbed, desorbed, and total residue plays an important role in governing the WCE of a given preemergence herbicide. On day 7, both total and adsorbed residues of S-metolachlor decreased by 64% in sugarcane biochar-amended soils compared with soils with no biochar, whereas total and adsorbed residues decreased by only 11% and 16% in pinewood biochar-amended soils compared with soils with no biochar. At this same time, nearly 3% and 24% germinations of D. aegyptium and A. palmeri, respectively, were observed in sugarcane biochar-amended soil, whereas no germination of either weed species was noticed in soils with no biochar and pinewood biochar. The reason for low availability of residues in sugarcane biochar-amended soils could potentially be due to formation of non-extractable residues or bound residues. Total, absorbed, and desorbed residues of S-metolachlor decreased over the 28-d experimental period in all treatments; however, the degree of decrement was always greater in sugarcane biochar-amended soils compared with soils with no biochar and pinewood biochar.
(A) Total, (B) adsorbed, and (C) desorbed residue dynamics of S-metolachlor in soils amended without and with pinewood and sugarcane biochar (2 Mg ha−1). Asterisks (*) indicate significant difference (P < 0.05) among three biochar treatments (no biochar, 2 Mg ha−1 of sugarcane and pinewood biochars) for a given type of residue.

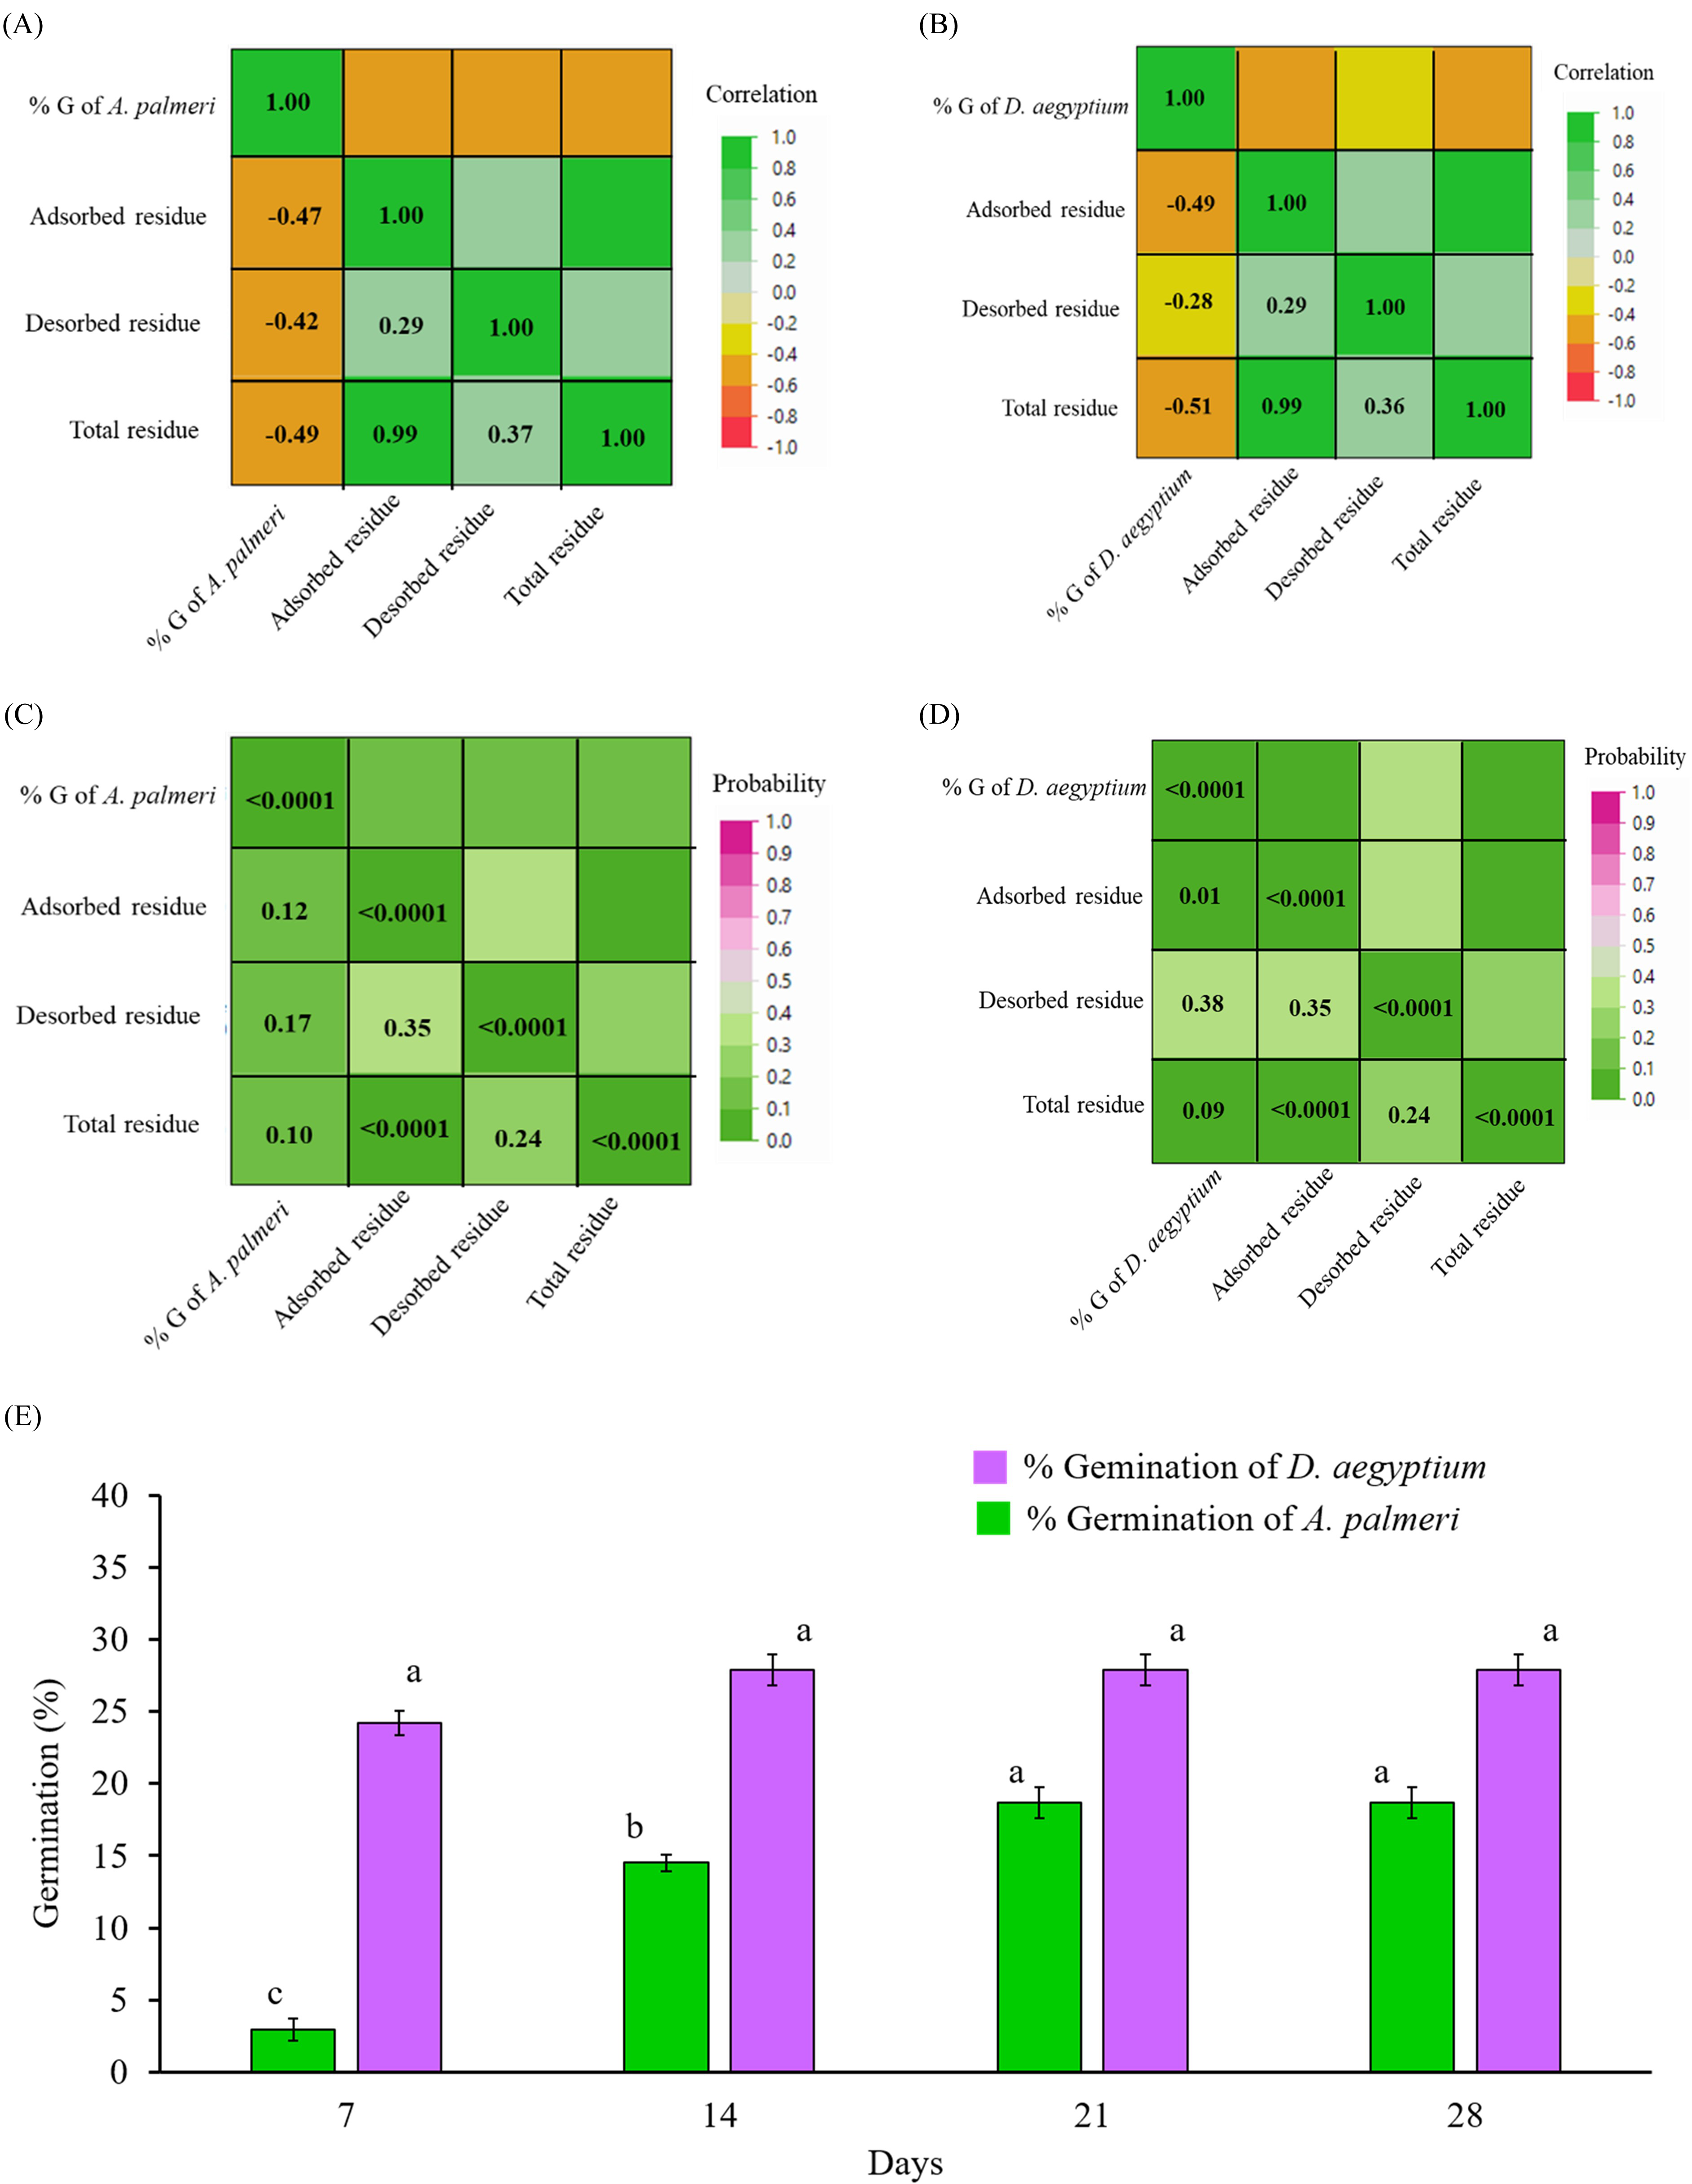
Pearson correlation analysis showed negative associations between weed germination and soil herbicide residues across sampling times (Figure 3A–D). Germination showed negative association with adsorbed (r = −0.47 and P = 0.12 for A. palmeri; r = −0.49 and P = 0.01 for D. aegyptium), desorbed (r = −0.42 and P = 0.17 for A. palmeri; r = −0.28 and P = 0.38 for D. aegyptium), and total residues (r = −0.49 and P = 0.10 for A. palmeri; r = −0.51 and P = 0.09 for D. aegyptium). These relationships were not statistically significant (P > 0.05), which could be due to the limited number of observations. Differential germination of weed species with respect to application of S-metolachlor in sugarcane biochar-amended soils indicated presence of variation in weeds’ sensitivity toward S-metolachlor residue (Figure 3E). Amaranthus palmeri showed 24% germination on day 7 and remained unchanged for rest of the period studied, whereas germination of D. aegyptium significantly increased from 3% on day 7 to 14% on day 14, followed by reaching 19% on day 21 and remaining unchanged afterward.
Color maps of correlations (A and B) and P-values (C and D) for S-metolachlor residues with weed germination and (E) germination percentage of Amaranthus palmeri and Dactyloctenium aegyptium in S-metolachlor-treated soils amended with sugarcane biochar (2 Mg ha−1). Within a weed species, different lowercase letters indicate significant difference (P < 0.05) in weed germination.

Figure 3. Long description
Panel A: A color map showing the correlation between S-metolachlor residues and Amaranthus palmeri germination. The axes include percent germination of A. palmeri, adsorbed residue, desorbed residue, and total residue. The color scale ranges from -1.0 to 1.0, indicating the strength and direction of the correlation. Panel B: A color map showing the correlation between S-metolachlor residues and Dactyloctenium aegyptium germination. The axes include percent germination of D. aegyptium, adsorbed residue, desorbed residue, and total residue. The color scale ranges from -1.0 to 1.0, indicating the strength and direction of the correlation. Panel C: A color map showing the P-values for the correlation between S-metolachlor residues and Amaranthus palmeri germination. The axes include percent germination of A. palmeri, adsorbed residue, desorbed residue, and total residue. The color scale ranges from 0.0 to 1.0, indicating the probability of the correlation. Panel D: A color map showing the P-values for the correlation between S-metolachlor residues and Dactyloctenium aegyptium germination. The axes include percent germination of D. aegyptium, adsorbed residue, desorbed residue, and total residue. The color scale ranges from 0.0 to 1.0, indicating the probability of the correlation. Panel E: A bar graph showing the germination percentage of Amaranthus palmeri and Dactyloctenium aegyptium over different days (7, 14, 21, and 28). The y-axis represents the germination percentage, and the x-axis represents the days. Different lowercase letters indicate significant differences (P < 0.05) in weed germination within a weed species.
Nag et al. (Reference Nag, Kookana, Smith, Krull, Macdonald and Gill2011) reported a decrease in bioavailable molecules of atrazine and trifluralin in 1% biochar-amended soils, which correlated with poor WCE of preemergence herbicides. Similarly, Yavari et al. (Reference Yavari, Kamyab, Abd Manan, Chelliapan, Asadpour, Yavari, Sapari, Baloo, Sidik and Kirpichnikova2022) reported a decrease in bioavailability of imazapic, imazapyr, and OnDuty® molecules in soils amended with biochar (0.5% to 4%), which necessitated higher GR50 values for these herbicides. Khorram et al. (Reference Khorram, Fatemi, Khan, Kiefer and Jafarnia2018) also reported decreased concentrations of plant-available fomesafen residues at higher doses of wheat straw biochar (5 to 15 Mg ha−1), which resulted in higher weed density and poor WCE of fomesafen in a lentil cropping system. Findings of the present study also aligned with the earlier reports, indicating lower bioavailability of herbicide molecules in biochar-amended soils, even at a low dose of 2 Mg ha−1 for sugarcane biochar. This resulted in poor WCE for S-metolachlor, while metribuzin efficiency remained unaffected. However, WCE of both herbicides remained unaffected with pinewood biochar (2 Mg ha−1).
Effects of Biochar Sources on WCE of Preemergence Herbicides
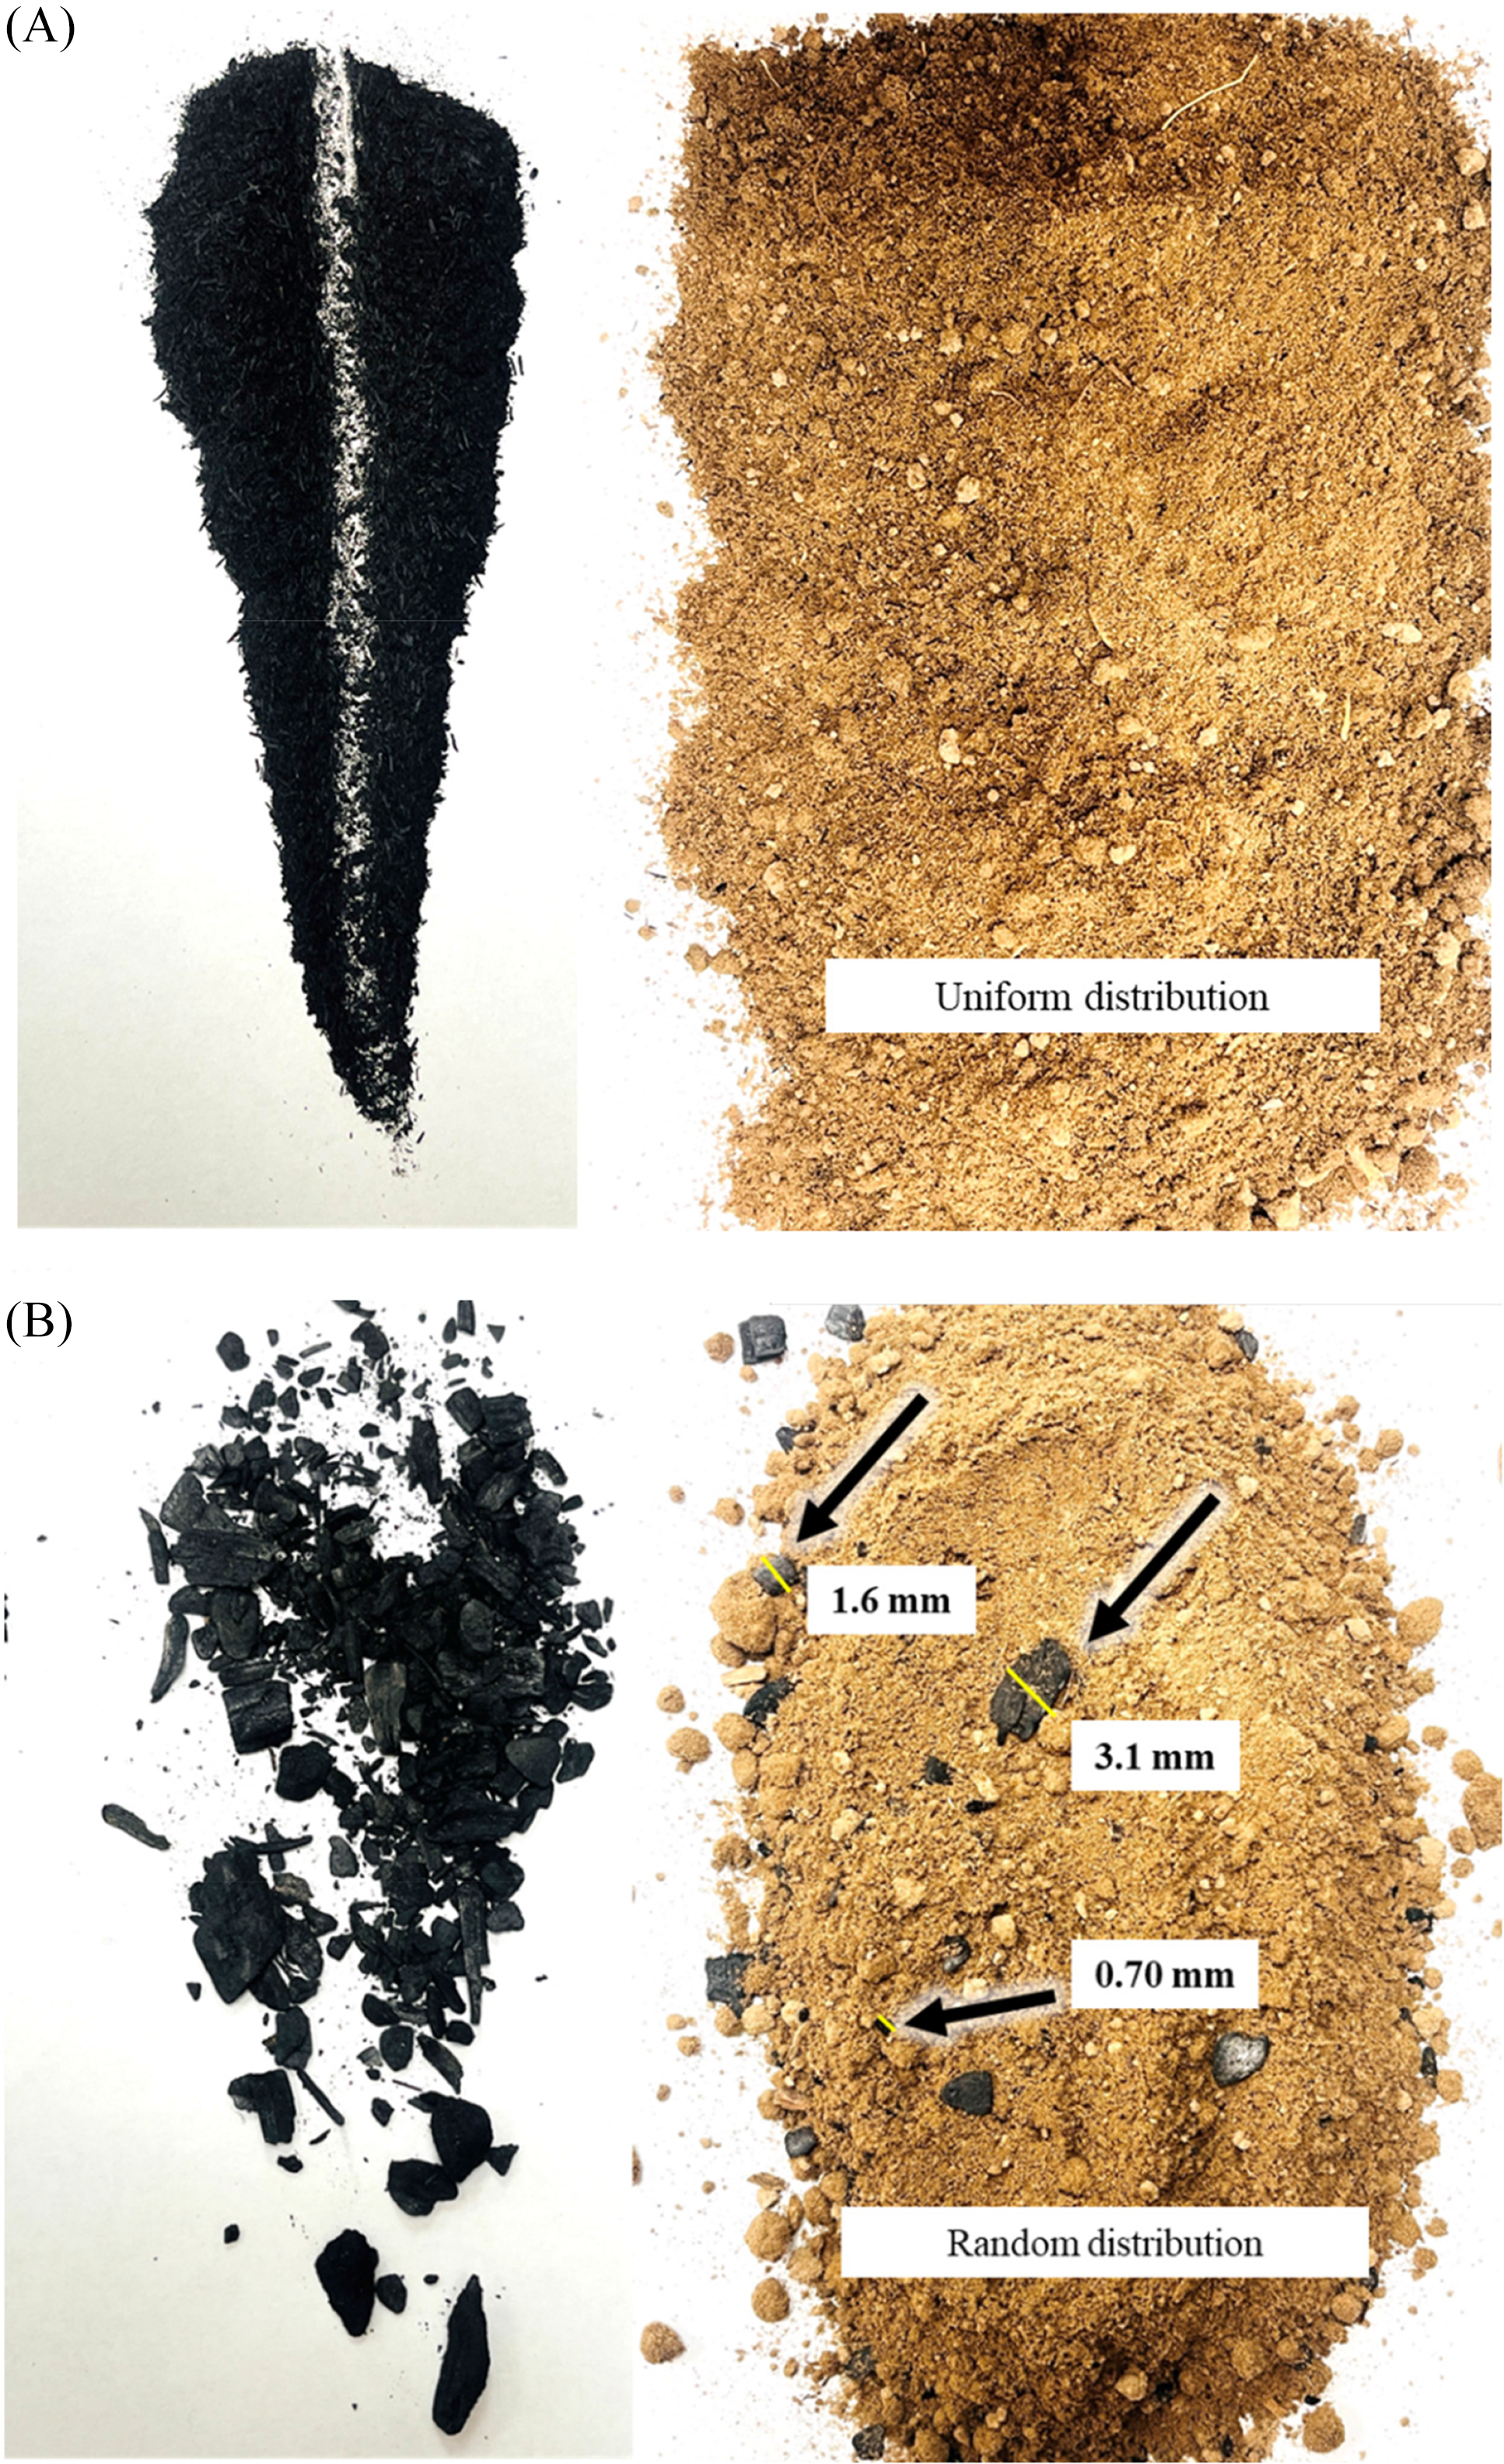
The present study indicated differential WCE at recommended doses of S-metolachlor and metribuzin in pinewood and sugarcane biochar-amended (2 Mg ha−1) soils. This could be related to differential properties of biochars and inherent chemical characteristics of selected herbicide molecules. Organic carbon (%) in the studied sugarcane and pinewood biochars was 63.6% and 80.5%, respectively, and both biochars had comparable surface areas (Table 1). Application of biochar has been reported to increase various soil properties, including total organic carbon content in soils (Zhang et al. Reference Zhang, Xing, Wei, Liu, Zhao, Liu, Wang, Liu, Ren, Jia, Wei, Siddique and Zhang2025), and an increase in organic carbon content through application of biochar has been reported to increase adsorption of herbicide (Nag et al. Reference Nag, Kookana, Smith, Krull, Macdonald and Gill2011; Yavari et al. Reference Yavari, Kamyab, Abd Manan, Chelliapan, Asadpour, Yavari, Sapari, Baloo, Sidik and Kirpichnikova2022). Hence, a 2 Mg ha−1 application of pinewood biochar with higher organic carbon could be expected to affect WCE of metribuzin and S-metolachlor more than sugarcane biochar. However, results showed lower WCE with sugarcane biochar compared with pinewood biochar, especially for S-metolachlor. This could be potentially explained by the differential particle size distribution in the respective biochar, which finally determined the distribution of biochar particles in soil. Figure 4A represented an even distribution of sugarcane biochar particles in the soil layer. In contrast, pinewood biochar application resulted in an uneven distribution of char particles in soil (Figure 4B), and some portions of soil did not show the presence of biochar.
Differential distribution of (A) sugarcane and (B) pinewood biochar (applied at 2 Mg ha−1) particles in topsoil when mixed for the study.

It could be noticed that even with differential particle size distributions, pinewood biochar (<1 mm = 21%) had a surface area of 283 m2 g−1, which was close to the surface area value of 291 m2 g−1 for sugarcane biochar (<1 mm = 97.9%). The surface area of a biochar could vary depending upon methods used for analysis (EBC 2012; McLaughlin et al. Reference McLaughlin, Shields, Jagiello and Thiele2012; Sigmund et al. Reference Sigmund, Hüffer, Hofmann and Kah2017). The surface areas of the studied biochars were analyzed following the method of McLaughlin et al. (Reference McLaughlin, Shields, Jagiello and Thiele2012). This method involves a sample preparation step of homogenization by grinding biochar to a coarse powder with a mortar and pestle, although the size of the final powdered sample before analysis is not mentioned in the method. Similarly, the European Biochar Certificate prescribes the determination of specific surface area according to DIN ISO 9277 (International Organization for Standardization 2022), which also involves milling biochar samples to a particle size below 3.15 mm as a sample processing step (EBC 2012–2022). McLaughlin et al. (Reference McLaughlin, Shields, Jagiello and Thiele2012) mentioned that the standard analytical methods for estimation of surface area (like Nitrogen Brunauer–Emmett–Teller surface area analysis (N2 BET) and CO2 Dubinin–Radushkevich analysis (DR)) were developed and optimized for materials (catalysts, rigid solid matrix materials like zeolites) other than biochars, and none of the existing analytical methods were officially validated specifically for biochar. Analyzing the surface area of biochar is a relatively new area of research and continues to evolve. Therefore, we apprehended that though commercial pinewood biochar in bulk contained larger particles compared with commercial sugarcane biochar, the sample processing step involving grinding of biochar before estimation of surface area might have reduced the particle size of pinewood biochar. This might have resulted in similar surface area values for sugarcane and pinewood biochar, although commercial pinewood biochar in its original physical form had larger particles than commercial sugarcane biochar. Therefore, the presence of larger particles coupled with uneven distribution of pinewood biochar particles in soil might have resulted in no negative impact on the herbicides’ efficiency (Graber et al. Reference Graber, Tsechansky, Gerstl and Lew2012).
Furthermore, the inherent chemistry of each herbicide molecule might have played an important role in the adsorption onto biochar. A lower adsorption of atrazine (solubility = 35 mg L−1, K oc = 100 L kg−1) than that of trifluralin (solubility = 0.2 mg L−1, K oc = 8,765 L kg−1) onto wheat straw biochar was reported by Nag et al. (Reference Nag, Kookana, Smith, Krull, Macdonald and Gill2011). Other reports also showed influences of herbicide chemistry on adsorption on different biochars (Loganathan et al. Reference Loganathan, Feng, Sheng and Clement2009; Spokas et al. Reference Spokas, Koskinen, Baker and Reicosky2009; Yavari et al. Reference Yavari, Kamyab, Abd Manan, Chelliapan, Asadpour, Yavari, Sapari, Baloo, Sidik and Kirpichnikova2022). We apprehended that S-metolachlor with lower water solubility (530 mg L−1) and higher K oc (150 to 300 L kg−1) values than metribuzin (water solubility = 1,050 mg L−1, K oc = 40 to 120 L kg−1), might have comparatively higher adsorption onto biochar. Therefore, by combining these facts from the particle size distribution of biochar and the inherent properties of herbicides, it is possible to explain that the adsorption of S-metolachlor in evenly distributed sugarcane biochar-amended soil would have been higher, which might have resulted in poor weed control. Based on the findings of this greenhouse study, field trials would give a realistic understanding about biochar–herbicide dynamics, demonstrating the levels of WCE of different soil-applied herbicides in the presence of biochars with varied physicochemical properties.
Application of biochar has emerged as a promising soil amendment due to its impact on soil improvement, restoration, soil carbon storage, and resilient cropping system strategies. Earlier reports on poor WCE of some preemergence herbicides in biochar-amended soils have gained attention. However, findings of the present study under greenhouse conditions suggest:
-
1. Potential differences among commercially available biochar sources could influence the WEC of preemergence herbicides.
-
2. Application of biochar at a low dose of 2 Mg ha−1 could affect the WCE of preemergence herbicides.
-
3. Biochar–herbicide–weed interactions could be site and soil specific, governing weed management practices.
-
4. Field-scale validation is necessary before making definitive management recommendations.
Acknowledgments
The authors gratefully acknowledge the start-up funds provided by Auburn University to AM for overall functioning of the research program.
Funding statement
Partial financial support for this work was provided by the U.S. Department of Agriculture (USDA)-Agricultural Research Services under a non-assistance cooperative agreement (58-6010-2-005).
Competing interests
The authors declare that they have no known competing financial interests or personal relationships that could have appeared to influence the work reported in this paper.

 Open access

