Implications
Milk yield, conception rate of ewes, litter size and productive lifetime of ewes were identified as the most important traits for dairy sheep breeds in Slovakia. Sensitivity analyses established that the economic values of these traits are sensitive to differences in production circumstances. Consequently, the overall breeding objective should be calculated using the weighted average of the economic values of traits obtained in the most common production strategies of Slovak dairy sheep farms. Periodic adjustment of economic values is required after substantial changes in the trait levels in the population.
Introduction
Economic efficiency of sheep farming is fundamental for sheep industry success. One way to increase income, reduce costs or both of sheep farms is through genetic improvement of populations. Net economic effects of genetic changes of sheep traits on farm profit (known as economic values of traits) have been calculated for different breeds in specific production systems and specific economic circumstances (e.g. Conington et al., Reference Conington, Bishop, Waterhouse and Simm2004; Jones et al., Reference Jones, Amer, Lewis and Emmans2004; Fuerst-Waltl and Baumung, Reference Fuerst-Waltl and Baumung2009). Such economic values can be sensitive to differences in production systems, average trait levels in the population, market prices and feed costs (e.g. Amer et al., Reference Amer, McEwan, Dodds and Davis1999; Kosgey et al., Reference Kosgey, van Arendonk and Baker2003; Conington et al., Reference Conington, Bishop, Waterhouse and Simm2004). When economic values for 14 production and functional traits for the most widespread Slovak sheep breeds, Improved Valachian and Tsigai, were calculated taking the most common production circumstances into account, milk yield, conception rate of ewes, litter size and ewe productive lifetime were identified as the economically most important traits (Krupová et al., Reference Krupová, Wolfová, Wolf, Oravcová, Margetín, Peškovičová, Krupa and Daňo2009). Season of lambing, age and management at weaning, marketing strategies for milk and lambs, animal performance levels and economic conditions vary substantially among dairy sheep farms in Slovakia. Therefore, the objective of this study was to investigate the impact of differences in production strategies and animal performance on the relative economic importance of traits. Because of similarity between the breeds, only results for Improved Valachian are presented here.
Material and methods
Description of the base production system for the Improved Valachian breed
Improved Valachian is the most widespread sheep breed in Slovakia. It is a multi-purpose breed (milk-meat-wool production) kept in a semi-extensive production system. Krupová et al. (Reference Krupová, Wolfová, Wolf, Oravcová, Margetín, Peškovičová, Krupa and Daňo2009) described typical production circumstances (taken as the base system), management and marketing strategies, and production and economic parameters used in the calculation of economic values. Therefore, only some features of the system important for the sensitivity analyses employed herein are emphasised here. The base system is characterised by seasonal lambing in winter and pasture grazing during summer. After customary weaning of lambs before Easter (at an average age of 49 days), surplus lambs are sold for slaughter and ewes are milked twice a day till the end of the breeding season. Farmers produce both milk and cheese. On average, 40% of total milk production is processed to cheese on farms; the rest is delivered to dairies. Female and male lambs are used for the first mating mostly at about 17 to 19 months of age. To improve the value of lambs sold for slaughter, nearly 10% of dams are mated to sires of meat breeds.
Economic values of traits
Economic efficiency of the Improved Valachian population under all investigated production circumstances was expressed as the present value of profit (P) per ewe lambing per year and as profitability ratio (PR):

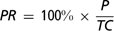
where R′ and C′ are the row vectors of revenues and costs for the individual sheep categories (ewes, rams, weaned lambs, female and male flock replacements) and n is a column vector of the number of animals in the individual sheep categories attributable per ewe and reproductive cycle. Because there is only one lambing season per year, the length of the reproductive cycle is 365 days. S represents the average subsidy per ewe per year, which remained constant in all analyses. TC is the total cost per ewe lambing per year. The PR measures the effectiveness of expended costs, that is, it is the value of P expressed per unit of costs. For details on economic input parameters used for the calculation of revenues, costs and subsidies, see Krupová et al. (Reference Krupová, Wolfová, Wolf, Oravcová, Margetín, Peškovičová, Krupa and Daňo2009).
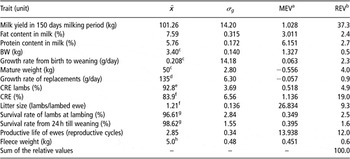
Traits that were expected to influence profit and for which economic values were calculated are shown in Table 1. The first three traits form the complex of milk traits; the next four are growth traits; the next six traits belong to the functional trait category and the last trait is the only wool trait included in the evaluation. The marginal economic value (MEV) of a trait is defined as the partial derivative of the profit function with respect to that trait. Trait definitions and the algorithm for the calculation of MEVs are given in Wolfová et al. (Reference Wolfová, Wolf, Krupová and Kica2009). MEVs were standardised (multiplied by the genetic standard deviations of the traits) and expressed as relative economic values (REVs). The REV of trait i (REVi) is defined as the absolute value of the standardised MEVi of trait i expressed as a percentage of the sum of the absolute values of the standardised MEVs of all evaluated traits:
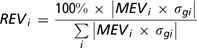
where σgi is the genetic standard deviation of trait i.
Mean values ( ), genetic standard deviations (σg), MEVs and REVs of traits in the base production system

MEVs = marginal economic values; REVs = relative economic values; CRE = conception rate of ewes.
aMEV (in €/unit of the trait, per ewe per year) indicates the change in profit when increasing the mean of the trait.
bREV (in %) calculated according to equation (3).
cFemales.
dFemale replacements from weaning till the first breeding period following their weaning.
eAveraged over all breeding seasons for female replacements.
fAveraged over all reproductive cycles.
gAveraged over all litter sizes and reproductive cycles.
hRams.
Means and genetic standard deviations of all traits and their MEVs and REVs calculated for typical production circumstances (base production conditions) are summarised in Table 1. Genetic standard deviations of the traits were derived from Oravcová et al. (Reference Oravcová, Groeneveld, Kovač, Peškovičová and Margetín2005) and from the Breeding Services of the Slovak Republic, s.e. (not published) when available. When such genetic standard deviations were not available, proxies were estimated from the products of phenotypic standard deviations of the traits and median values of their heritabilities (from the review of Safari and Fogarty, Reference Safari and Fogarty2003). For binomially distributed traits (ewe and ewe lamb conception, lamb survival), genetic standard deviation and heritability on the observed scale depend on the incidence of the particular trait. To obtain the appropriate heritability for different incidence levels of a binomial trait i, the heritability estimated in the literature on the underlying scale ( ) was transformed to the heritability on the observed scale (
 ) according to Dempster and Lerner (Reference Dempster and Lerner1950):

where pi is the probability that one of the two possible outcomes of trait i occurs (incidence of conception or of survival), (1−pi) is the probability that the second possible outcome occurs (failure to conceive, death) and z is the ordinate of the standard normal density function for the given pi. As no estimate of heritability on the underlying scale for the four evaluated traits in dairy sheep were available, the estimates for Merino sheep were used, because fertility and litter size of this breed were very close to the investigated breed Improved Valachian. For conception rates of ewe lambs and ewes, a heritability on the underlying scale of 0.072 was assumed (Olivier et al., Reference Olivier, Snyman, van Wyk and Erasmus1998). For lamb survival rates, only the direct and maternal heritability on the underlying scale were available (Cloete et al., Reference Cloete, Misztal and Olivier2009). Because no significant covariances between direct and maternal effects were estimated by these authors, the total heritability for lamb survival rates at birth and until weaning can be calculated according to Willham (Reference Willham1972) as

where  ,
 and
 are the genetic variances for direct and maternal effects and the phenotypic variance, respectively. For lamb survival rate at lambing and until weaning, the total heritabilities on the underlying scale calculated using the values from Cloete et al. (Reference Cloete, Misztal and Olivier2009) were 0.144 and 0.191, respectively.
The genetic standard deviation (expressed in per cent) of a binomially distributed trait i for the incidence level (pi) in the base production system (see Table 1) and for the incidence levels investigated in the sensitivity analyses (Table 2) were estimated as

The impacts of changes in production strategies and performance levels on the MEVs and REVs of 14 traits were analysed. The relative importance of traits is crucial when ranking animals for selection; therefore, the sensitivity analyses focused mainly on changes in the REVs. If all traits had equal importance, then the REV for each trait would be 7% (100/14). Therefore, the analyses concentrated mainly on the four economically most important traits (150 days milk yield, conception rate of ewes, litter size per lambed ewe and ewe productive lifetime), the REVs of which each exceeded 7% of the total economic importance (see Table 1 for REVs).
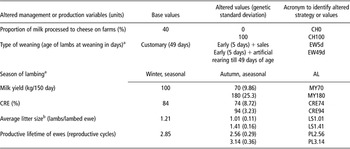
Production strategies and performance levels investigated in sensitivity analyses of REVs of traits

REVs = relative economic values; CRE = conception rate of ewes.
aSee the ‘Material and methods’ section for the description of differences in production strategies.
bNumber of lambs born per lambed ewe.
Production circumstances examined
In accordance with the most common management and marketing practices on Slovak dairy sheep farms, the following deviations from the base production strategy were examined: (i) all milk sold to dairies; (ii) all milk processed to cheese on farm; (iii) early weaning of lambs and immediate sale of all surplus lambs at 5 days of age; (iv) early weaning of lambs at 5 days of age with subsequent artificial rearing of lambs till Easter (selling at an average of 49 days of age); (v) aseasonal lambing in autumn and selling lambs before Christmas to obtain products with higher prices than received from the base system with seasonal winter lambing. The systems with aseasonal and seasonal lambing differed in the following input parameters: lamb price (per kg live weight) of 3.05€ v. 2.72€, milk and cheese price of 0.83 and 6.97 €/kg v. 0.71 and 5.57 €/kg, conception rate of ewes of 74% v. 84% and conception rate of ewe lambs of 88% v. 93%.
The impacts of variation in mean performance levels of the four economically most important traits (150 days milk yield, conception rate of ewes, litter size and ewe productive lifetime) on REVs were also examined. An overview of examined variants and the acronyms by which they are identified in the Results section is given in Table 2. The upper or lower limits of trait values recorded in performance testing (flock performance during 2004 to 2008) were generally applied for the alternative trait means. Proportional changes in the genetic standard deviations were assumed when calculating the standardised and the REVs for different means of traits with continuous distribution. Genetic standard deviations for alternative levels of ewe conception rate were calculated according equation (6). The standard deviations applied for alternative trait levels in the sensitivity analyses are given in Table 2.
The impact of the production circumstances and trait levels on the farm profit and on the relative economic importance of the main groups of traits in dairy sheep, that is, milk traits, growth traits, functional traits and wool traits, were also examined.
The program package ECOWEIGHT (Wolf et al., Reference Wolf, Wolfová, Krupová and Krupa2010) was used for all calculations.
Results
Economic results for production circumstances examined
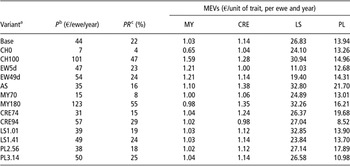
Present values of profit and profitability ratios for typical (base system) production circumstances and for alternative management strategies and performance levels are shown in Table 3. Because of subsidies incorporated in the profit calculation, profit was positive for the base system and all management variants and performance levels examined. The lowest profitability ratios (4% and 8%) were found for farms selling all milk to dairies and for farms with 150 days milk production of 70 kg per ewe, respectively. In contrast, the highest profitability ratios (47% and 55%) were obtained for farms processing all milk to cheese and farms with milk production of 180 kg, respectively. Only in these two cases was positive profit achieved without consideration of subsidies. Increases in the performance level of investigated traits increased profitability ratios by from 2 to 33 percentage points.
Impact of production strategies and performance level on profit, profitability ratio and on MEVs of the four economically most important traits

MEVs = marginal economic values; P = profit; PR = profitability ratio; MY = milk yield in 150 days milking period in kg; CRE = conception rate of ewes in %; LS = litter size in number of lamb born per lambed ewe; PL = ewe productive lifetime in number of reproductive cycles.
aFor abbreviations of management and performance value variants, see Table 2.
bIncluding the average subsidies of 76.94€ per ewe in the flock per year.
cCalculated as 100% × profit/costs.
Impact of production circumstances on MEVs
Impacts of changes in production circumstances on sheep farms on the MEVs of the four most important traits are summarised in Table 3. For the MEV of milk yield, the most influential factor was the marketing strategy for milk. The highest MEV for milk yield was obtained on farms processing all milk to cheese (variant CH100) and the lowest was on farms delivering all milk to dairies (variant CH0). The MEV of milk yield changed non-linearly with the level of that trait. The MEV of milk yield increased when raising the production level from 70 to 100 kg, but decreased with a further increase from 100 to 180 kg.
The MEV of ewe conception rate varied among production strategies and also depended on the level of other investigated traits except ewe productive lifetime and litter size. Ewe conception rate had the highest marginal economic importance on farms with aseasonal lambing and on farms with high milk yield. The MEV of ewe conception rate decreased steadily as ewe conception rate increased. The MEV of ewe productive lifetime decreased with increasing level of ewe productive lifetime or ewe conception rate. When comparing production strategies, the MEV of ewe productive lifetime was highest on farms practising aseasonal lambing. The MEV of litter size was sensitive to production circumstances, being highest on farms with low litter size, farms with aseasonal lambing, farms with high milk production and farms that processed all milk to cheese. The lowest MEV of litter size was obtained on farms selling lambs at 5 days of age (variant TW5d).
Impact of production circumstances on REVs
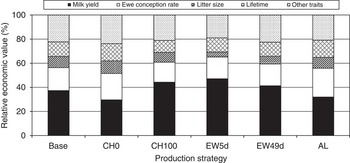
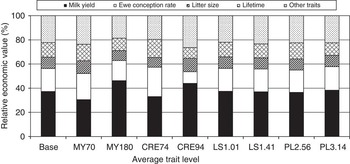
The REVs of the four most important traits are displayed in Figure 1 for different production strategies and in Figure 2 for different trait levels.
Relative economic values of traits for different production strategies. Base: basic situation is described in the ‘Material and methods’ section and in Table 2; CH0, CH100: percentage of milk processed to cheese on farm is 0% or 100%, respectively; EW5d, EW49d: early weaning of lambs at the age of 5 days and immediate sale or sale after artificial rearing at the age of 49 days, respectively. AL = aseasonal lambing in autumn.

Relative economic values of traits for different trait means. Base (first column): the trait means for the base production circumstances take the values as given in Table 2. In the following columns, the mean of one trait at a time is changed. MY = milk yield (kg); CRE = conception rate of ewes (%); LS = litter size (number of lambs born per ewe lambing); PL = ewe productive lifetime (number of reproductive cycles). The value behind the trait abbreviation represents the modified mean of the given trait.

Because REVs are defined differently from MEVs, it is natural that they may react in different ways to changes in production circumstances and trait levels. For example, although the MEV of milk yield deviated substantially from the base situation only when changing the marketing strategy for milk and for weaning strategy for lambs, the REV of milk yield varied among most of the investigated production circumstances (except when varying litter size and productive lifetime of ewes). In the base production circumstances, the REV of milk yield was 37%, but it ranged from 30% to 47% among the investigated management strategies. The REV for milk yield rose to its highest level when early weaning was used, the proportion of cheese production was at its maximum, (Figure 1) and milk yield and ewe conception rate were at a high level. Litter size and productive lifetime of ewes were the least important factors affecting the REV of milk yield (Figure 2).
The REV of ewe conception rate was also quite sensitive to production circumstances, but the changes in its REVs were smaller than those for milk yield. Only the current mean value of ewe conception rate had a high impact on the REV of this trait. An increase in the conception rate of ewes from 84% to 94% nearly halved the REV of the trait (from 19% to 10%), whereas a decrease in ewe conception rate to 74% was accompanied by an increase in REV by only 5 percentage points (Figure 2), which illustrates a non-linear relationship between REV and trait level. A non-linear change in profit and a decrease in the genetic standard deviation of ewe conception rate with increasing level of this trait are responsible for these results.
Weaning management was the most important factor influencing the REV of litter size (Figure 1). The change from customary weaning (49 days after birth) to early weaning (5 days after birth) with immediate sale of lambs nearly halved the REV of litter size (decrease from 9.3% to 4.1%). When the early-weaned lambs were artificially reared until slaughter at Easter (at the age of 49 days), the REV of litter size was about two-thirds as large (6.4%) as the REV of this trait in farms with customary weaning.
The mean value of ewe conception rate was the most important factor affecting the REV of ewe productive lifetime (Figure 2). This REV of ewe productive lifetime decreased in farms with 100% cheese production, high milk yield, high productive lifetime of ewes or high conception rate. A substantial increase in REV of longevity was obtained only for farms selling all milk to dairies, farms with low conception rate and farms with aseasonal lambing.
REVs of the remaining 10 traits (see Table 1) did not exceed 7% of the total economic importance (calculated as the sum of the absolute values of the standardised MEVs over all evaluated traits, see equation (3)) in any of the production circumstances that were examined. Only the REV for ewe lamb conception rate increased to 7.7% in the system with aseasonal lambing. The sum of REVs for those traits generally accounted for less than 25% of the total economic importance (see Figures 1 and 2).
Relative importance of trait complexes
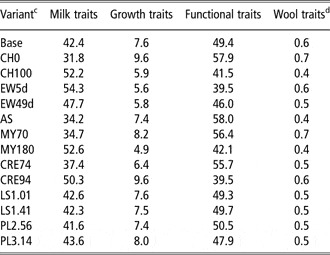
Changes in the REV of individual traits also caused changes in the relative economic importance of the three main trait complexes (milk, growth and functionality) in the dairy sheep-breeding objective in all production circumstances examined (see Table 4). The REV for milk traits (milk yield, fat and protein content) varied among the analysed production circumstances from 32% (all milk sold to dairies) to 54% (early weaning with selling lambs at 5 days of age).
Impact of production strategies and performance level on the relative economic importance of trait complexesFootnote a (in % of the total economic importance of all 14 traitsFootnote b)

a Milk traits include milk yield, fat and protein content. Growth traits include birth and mature weights and growth rates from birth to weaning and in the rearing period of replacements. Functional traits are conception rates of ewes and ewe lambs, lamb survival rates at lambing and till weaning, ewe productive lifetime and litter size.
b Calculated according to equation (3).
c For abbreviations of calculated variants see Table 2.
d Wool traits included fleece weight only.
The REV for the growth rate complex (growth rates, birth and mature weight) generally showed low relative importance and variability (varying from 5% to 10%) among different production circumstances.
The economic importance of the functional trait complex (conception rates of ewes and of ewe lambs, litter size, lamb survival rates and ewe productive lifetime) was highest in farms selling all milk to dairies, in systems with low milk production or low ewe conception rate and in systems with aseasonal lambing (56% to 58%). Functional traits were least important in systems that practiced early weaning and selling lambs at 5 days of age and in farms with high conception rate (40% in both systems).
The relative economic importance of the single wool trait (fleece weight) was very low in all production circumstances (0% to 1%).
Discussion
Impact of production circumstances on economic values
Most papers dealing with the estimation of economic importance (economic values) for traits in livestock breeding also include a sensitivity analysis of the economic values to different production circumstances. These analyses focus mainly on the impact of changes in economic input parameters (product prices and costs) and on the impact of output or input restrictions (milk or meat quotas, restricted feed resources). See, for example, Kosgey et al. (Reference Kosgey, van Arendonk and Baker2003), Haghdoost et al. (Reference Haghdoost, Shadparvar, Nasiri and Fayazi2008) and Byrne et al. (Reference Byrne, Amer, Fennessy, Cromie, Keady, Hanrahan, McHugh and Wickham2010) in meat sheep and Wolfová et al. (Reference Wolfová, Přibyl and Wolf2001) and Vargas et al. (Reference Vargas, Groen, Herrero and van Arendonk2002) in dairy cattle.
Fewer sensitivity analyses have investigated the influence of performance levels of traits or of management practices on MEVs or on REVs. Legarra et al. (Reference Legarra, Ramón, Ugarte and Pérez-Guzmán2007) reported that a farm's marketing strategy for sheep milk (cheese production or selling milk to dairies) strongly influenced the economic importance not only of milk production, but also of reproductive traits and ewe productive lifetime. The MEVs of milk yield, ewe fertility (ability to conceive) and prolificacy (number of lambs born) were significantly higher for cheese sellers than for milk sellers, whereas the MEV of ewe productive lifetime was higher for milk sellers.
Similar results were obtained in our sensitivity analyses for the MEVs of milk yield, ewe conception rate, litter size and ewe productive lifetime. When comparing the REVs of traits for milk and cheese sellers in our analysis, however, only the REV of milk yield had a higher value for cheese sellers than for milk sellers. For the other mentioned traits, the contrary was true. This was caused by the fact that, when changing the marketing strategy from selling milk to selling cheese, the increase in the MEV of milk yield was relatively much higher (2.5 times) than increases in the MEVs of functional traits (1.1 to 1.3 times), as shown in Table 3 and Figures 1 and 2.
Legarra et al. (Reference Legarra, Ramón, Ugarte and Pérez-Guzmán2007) found clear differences in the MEVs between the two Spanish dairy sheep breeds, Latxa and Manchega. These breeds are typically raised in very different environments and also differ in performance level, especially for milk yield, undoubtedly contributing to differences in the MEVs. Although sensitivity analyses only for the Improved Valachian breed are presented in our current report, similar analyses were conducted for the Tsigai breed. Tsigai and Improved Valachian are kept in distinct regions that vary in feed availability and feed costs; however, they do not differ substantially in the performance level. Both MEVs and REVs were found to be similar between the two breeds, and small differences in MEVs and REVs were caused by the diversity in environments.
The sensitivity of MEVs and REVs of different traits to changes in production circumstances also depend, however, on the assumptions made in the model for the calculation of economic values. Legarra et al. (Reference Legarra, Ramón, Ugarte and Pérez-Guzmán2007), for example, accounted only for the cost for replacements in the MEV of ewe productive lifetime. Therefore, the MEV depended more on the economic and production circumstances in individual farms than on the trait mean and was highest in the farms with highest ewe performance and longest ewe productive lifetime. In our model, as well as in some others (e.g. Fuerst-Waltl and Baumung, Reference Fuerst-Waltl and Baumung2009), changes in ewe productive lifetime also influenced total milk production, average conception rate and average litter size because of a change in the age structure of the herd. In contrast, the MEV of ewe productive lifetime was sensitive to the levels of milk production, conception rate and litter size, as well as to management and marketing circumstances. The MEV and the REV of ewe productive lifetime decreased as the trait itself increased in our study.
Impact of trait levels on economic values
Several authors (e.g. Visscher et al., Reference Visscher, Bowman and Goddard1994; Albera et al., Reference Albera, Carnier and Groen2004) reported decreased MEVs for a number of traits as means for those traits increased in a population, thus indicating a non-linear profit function with respect to those traits. For example, a strongly non-linear relationship between profit and trait level has been reported for litter size in sheep. Conington et al. (Reference Conington, Bishop, Waterhouse and Simm2004) reported an increase in the MEV for litter size at weaning up to 1.34 lambs per ewe and a decrease after reaching 1.46 lambs on intensive farms. On extensive farms, however, each increase in the number of weaned lambs above the mean of 0.925 caused a decrease of profit and of the MEV for litter size. For different regions and farm types in New Zealand, Amer et al. (Reference Amer, McEwan, Dodds and Davis1999) observed a steady decrease in the economic value of litter size at birth as the number of lambs born increased above its current mean. Similarly, under Slovakian conditions, the MEV and the REV of litter size at birth decreased when litter size increased above the average level of the trait (1.2 lambs born per ewe lambing).
Phocas et al. (Reference Phocas, Bloch, Chapelle, Bécherel, Renand and Ménissier1998) and Amer et al. (Reference Amer, McEwan, Dodds and Davis1999) showed that the MEV and REV of reproductive traits (cow conception rate, calf survival, litter size and lamb survival) are sensitive to the marketing strategy of progeny intended for slaughter (fattening to constant slaughter weight or to constant slaughter age, slaughtering at different ages). Similarly, in our study the REV of litter size at birth was strongly sensitive to age of lambs at weaning.
From the study of Phocas et al. (Reference Phocas, Bloch, Chapelle, Bécherel, Renand and Ménissier1998), as well as from our results, it is evident that changes in the REVs of traits caused by changes in production circumstances are not always consistent with changes in the MEVs of those same traits. The MEV of a trait is generally calculated by changing the trait mean while keeping the means of all other evaluated traits constant. The REV of a trait, however, depends not only on its MEV, but also on its genetic standard deviation and on the MEVs and genetic standard deviations of simultaneously evaluated traits. In our study, the genetic standard deviations of traits with continuous distribution were assumed to increase proportionally with increased means (constant coefficient of variation of a trait). Therefore, even if the MEV of such a trait decreased with increased trait mean, its REV could increase. However, for the binomially distributed traits (e.g. conception rate), the opposite was true. At higher mean levels, MEVs were lower, and this was further exacerbated by a reduction in genetic standard deviations. Phocas et al. (Reference Phocas, Bloch, Chapelle, Bécherel, Renand and Ménissier1998), for example, showed that calving success had a 12% higher MEV in beef herds with classical fattening of calves than in suckler herds where calves were sold at weaning, whereas the REV for calving success was 3 percentage points lower in herds with fattening of calves than in suckler herds.
It generally is not known how the true genetic standard deviation of a trait changes as the performance level of that trait is changed by genetic or environmental effects. By comparing coefficients of variation of the same continually distributed trait in different populations, however, the assumption of a stable relationship can be inferred. For example, the coefficient of variation for milk yield for Improved Valachian ewes in our study was 14% (mean 101 kg, genetic standard deviation 14.2 kg), which was very similar to the coefficient of variation for Austrian dairy sheep (13.7%), with mean milk production of 476 kg and genetic standard deviation 65 kg (Fuerst-Waltl and Baumung, Reference Fuerst-Waltl and Baumung2009). In addition, the coefficient of variation for litter size calculated for Improved Valachian, 11.6% (for the mean 1.21 lambs and the genetic standard deviation 0.14 lambs), did not differ substantially from coefficients of variation (12.2% to 12.5%) calculated for four meat sheep breeds in the Czech Republic whose litter size means varied from 1.30 to 2.48 lambs (Wolfová et al., Reference Wolfová, Wolf and Milerski2011). Although the calculation of the genetic standard deviation for different trait means using a single coefficient of variation for each trait is an approximation, the bias in REVs would be smaller than when assuming an equal genetic standard deviation for different trait levels.
The phenotypic variance and heritability of a binomial trait estimated on the observed scale change with the mean of the trait as shown by Dempster and Lerner (Reference Dempster and Lerner1950). Therefore, the heritability of the underlying scale, which is assumed to be independent of the trait mean, was used to estimate the heritabilities and the genetic standard deviations of the observed scale for different trait levels. Without the standardisation of the MEVs, the economic importance of traits with different units would not be comparable. However, for deciding which of the economically important traits should be included in a breeding objective, further factors must also be taken into account, for example heritability of traits, genetic correlations among traits, costs for data collection and breeding value estimation for those traits.
As our study and other reports showed (e.g. Legarra et al., Reference Legarra, Ramón, Ugarte and Pérez-Guzmán2007), REVs of traits in livestock are sensitive to differences in production circumstances. Therefore, Phocas et al. (Reference Phocas, Bloch, Chapelle, Bécherel, Renand and Ménissier1998) recommended using REVs of traits calculated separately for different production systems for defining a global breeding objective for beef cattle in France. They calculated the global REV of a trait as the weighted average of the trait REVs in each of the distinct production systems, using the number of cows in each system as the weighting factor. The same principle can be recommended for sheep populations in which different management and marketing strategies occur and substantial differences are obtained in the REVs of traits for each of these strategies.
The overall breeding objective for dairy sheep breeds in Slovakia should be defined using the weighted average of the economic values of traits obtained in farms with the main production strategies (farms selling milk and selling cheese, farms with customary and early weaning of lambs, farms applying aseasonal lambing). Furthermore, individualised sub-indices could be constructed for farms applying a special production strategy. The REVs of some traits varied substantially for different performance levels in our study, and therefore economic values should be recalculated when population means of evaluated traits change substantially. Moreover, the impact of economic circumstances on the relative economic importance of sheep traits needs to be explored for the proper definition of selection indices.
Acknowledgements
The authors thank the Breeding Services of the Slovak Republic, s.e. for making performance test data available and to dairy sheep farmers in Slovakia for providing economic and production data. The authors also thank J. Wolf from the Institute of Animal Science, Prague-Uhřiněves, Czech Republic and two unknown reviewers for their helpful comments. The authors specially acknowledge W.D. Hohenboken (Corvallis, OR, USA) and L. Hanuliaková (Animal Production Research Centre Nitra, Slovakia) for editing the English. The research was supported by the project ‘CEGEZ’ no. 26220120042 (Operational Programme Research and Development funded by the European Regional Development Fund) and RÚ0910503/10/16/1000003 of the Slovak Republic and by the Project MZE 0002701404 of the Czech Republic.