Nomenclature
Vertiminal parameters: nodes and links

Table 1 Long description
The table has 18 rows and 2 columns. Column headers are: Symbol, Description. Row 1: Symbol, N_G; Description, The set of gate nodes. Each physical gate node has an entrance node n_g^en ∈ N_g^en and an exit node n_g^ex ∈ N_g^ex ∀g ∈ N_G. Each gate node has a holding capacity of c_g. Row 2: Symbol, N_R; Description, The set of nodes representing all TLOF pads at the vertiminal. Each TLOF pad has an entrance node n_r^en ∈ N_r^en and an exit node n_r^ex ∈ N_r^ex ∀r ∈ N_R. Row 3: Symbol, N_O^n_r; Description, The set of nodes representing OFV boundary on a TLOF pad n_r ∈ N_R. Row 4: Symbol, N_F^n_r; Description, The set of nodes representing the vertiexit reached from TLOF pad n_r ∈ N_R. Row 5: Symbol, N_O; Description, N_O = U_{n_r ∈ N_R} N_O^n_r. Row 6: Symbol, N_F; Description, N_F = U_{n_r ∈ N_R} N_F^n_r. Row 7: Symbol, N_T; Description, The set of all nodes n on the ground, where a node could be the intersection of two taxiways, an entrance or exit to a taxiway or a TLOF pad. Row 8: Symbol, N; Description, N_G ∪ N_T ∪ N_R ∪ N_O ∪ N_F. Row 9: Symbol, L_G; Description, Set of links connecting gate nodes n_g ∈ N_G and taxiing nodes n_t ∈ N_T. Row 10: Symbol, L_T; Description, Set of links connecting taxing nodes nodes n_t ∈ N_T. Row 11: Symbol, L_R; Description, Set of links connecting taxing nodes n_t ∈ N_T and TLOF pads n_r ∈ N_R. Row 12: Symbol, L_O; Description, Set of links connecting TLOF pads n_r ∈ N_R and OFV boundary n_o ∈ N_O^r. Row 13: Symbol, L_F; Description, Set of links connecting OFV boundary nodes n_o ∈ N_O^n_r and vertiexit nodes n_f ∈ N_F^n_r ∀n_r ∈ N_R. Row 14: Symbol, L; Description, L_T ∪ L_R ∪ L_O ∪ L_F ∪ L_G. Row 15: Symbol, l_{a,b}; Description, ∈ L A link connecting nodes a and b also represented as (a, b). Row 16: Symbol, G; Description, (N, L), The vertiminal network.
VTOL sets and parameters used in optimisation problem

Table 2 Long description
The table has 24 rows and 2 columns. Column headers are: Symbol, Description. Row 1: A, The set of all VTOL. Row 2: A^Dep, The set of all departing VTOL. Row 3: A^Arr, The set of all arriving VTOL. Row 4: A^TAT, A^Dep ∩ A^Arr, the set of VTOL that have to turn around. Row 5: A^n, The set of all VTOL whose route passes through node n ∈ N. Row 6: ARAPPR_i, ∀i ∈ A^Arr the time at which an arriving flight i enters the airspace of vertiminal i.e. enters vertiexit. Row 7: DRGATE_i, ∀i ∈ A the time at which a departing flight i is ready to leave the gate after passenger boarding. Row 8: γ(i), ∀i ∈ A, a gate ∈ N_G assigned to VTOL i. Row 9: γ^en(i), Entrance node n_g^en ∈ N_g^en of gate g ∈ N_G assigned to VTOL i ∈ A^Arr. Row 10: γ^ex(i), Exit node n_g^ex ∈ N_g^ex of gate g ∈ N_G assigned to VTOL i ∈ A^Dep. Row 11: τ(i), ∀i ∈ A, a TLOF pad n_r ∈ N_R assigned to VTOL i. Row 12: τ^Arr(i), is a TLOF pad assigned to i ∈ A^Arr while τ^Dep(i) is assigned to i ∈ A^Dep. Row 13: τ^en(i), Entrance node n_r^en ∈ N_r^en of the TLOF pad n_r ∈ N_R assigned to VTOL i ∈ A^Dep. Row 14: τ^ex(i), Exit node n_r^ex ∈ N_r^ex of the TLOF pad n_r ∈ N_R assigned to VTOL i ∈ A^Arr. Row 15: Λ(i), ∀i ∈ A, a surface direction l_{n_f,_o}^i ∈ L_F, n_f ∈ N_F^{n_r}, n_o ∈ N_O^{n_r} assigned to VTOL i from TLOF pad n_r ∈ N_R. Row 16: Λ^Arr(i), is the surface direction assigned to i ∈ A^Arr while Λ^Dep(i) is assigned to i ∈ A^Dep. Row 17: Λ_F(i), ∀i ∈ A, a vertiexit node n_f ∈ N_F on surface direction Λ(i). Row 18: Λ_O(i), ∀i ∈ A, an OFV boundary node n_o ∈ N_O on surface direction Λ(i). Row 19: TAT_i, Turnaround time of VTOL i ∈ A^TAT. Row 20: TOT_i^Arr, TLOF pad occupancy time of arriving VTOL i. It is the time a VTOL takes to stop its motor and cool down before it can exit the TLOF pad. Row 21: TOT_i^Dep, TLOF pad occupancy time of departing VTOL i. It is the time a VTOL takes to reach the centre of the TLOF pad, start its motor, and prepare for take-off. Row 22: W_{ij}^{tsep}, Required safe separation time at landing or takeoff of VTOL i from its immediate trailing VTOL j, ∀i,j ∈ A,i ≠ j.
1.0 Introduction
Future modes of transportation in domestic mobility are expected to integrate urban air mobility (UAM) with surface transport. This acceleration is due to road congestion caused by an increase in the number of vehicles for personal transport. Frequent traffic rerouting can cause unpredictable delays because of construction work, road accidents or due to ad-hoc events such as public and political demonstrations, etc. UAM is expected to provide cost-effective air travel by deploying fuel-efficient small passenger aircraft with electric mobility, popularly being called ‘air taxi’ or ‘air shuttle’ service [Reference Cohen, Shaheen and Farrar1]. The system is expected to be fully automated and, thus, highly efficient in operational procedures [2].
UAM vehicles, owing to their small size and primarily rotary wing structure, can take off and land vertically, making them ideally suited for widespread operation in congested and space-constrained urban areas. Analogous to the air traffic management (ATM) system that governs traditional aviation, the urban air traffic comprising UAM vehicles, along with other unmanned aerial systems (UAS) such as delivery drones, is governed by the UAS traffic management (UTM) [Reference Aweiss, Owens, Rios, Homola and Mohlenbrink3]. UTM establishes regulatory and operational guidelines requiring UAM vehicles to take off and land only at designated vertiports (vertical spaces) constructed within urban areas. The growing scale of this ecosystem underscores its economic potential, with the global UAM industry projected to exceed $40 b in value [4]. Companies such as Volocopter and Skyroads in Germany and Italy are actively advancing vertical take-off and landing (VTOL) technologies, vertiport infrastructure and automated air traffic management systems [Reference Everett5–7].
Vertiport Terminal – distinct from vertiport on rooftop
A vertiport terminal consists of several touchdown and lift-off (TLOF) pads and gates with taxiways connection, and it occupies a significantly large footprint. Some of the vertiport terminals also consist of staging stands for overnight parking or maintenance of UAM vehicles, compared to a typical rooftop vertiport; a rooftop vertiport occupies a smaller area and would consist of one or two TLOF pads [Reference Rimjha and Trani8]. These vertiports function as individual stops, analogous to bus stops. Vertiport terminals (or vertiminals), on the other hand, serve as central hubs for UAM operations, comparable to bus terminals in ground transportation systems. Designing vertiminals for a city is a nontrivial task as there is a requirement for efficient space usage as well as adhering to regulations. Several international aviation bodies, such as the European Union Aviation Safety Agency (EASA) [9], the Federal Aviation Administration (FAA) [10] and United Arab Emirates General Civil Aviation Authority (UAE GCAA) [11] have recently published design guidelines for the construction of vertiports and vertiminals.
A notable analogy exists between UTM and conventional ATM. Vertiport terminals, akin to airports, are expected to become critical bottlenecks in UTM under high traffic conditions [Reference Watkins, Sarfaraz, Zanlongo, Silbermann, Young and Sleight12, Reference Mueller, Kopardekar and Goodrich13], leading to congestion and associated wastage of resources such as fuel (energy), manpower and time, and thereby leading to uneconomical operation. Hence, optimising vertiminal operations is vital in intelligent transportation research. This work draws upon well-established optimisation methodologies from ATM research [Reference Jiang, Xu, Zhang and Luo14–Reference Deng, Xu, Zhao and Song16] to enhance vertiminal terminal efficiency. While existing studies on vertiports and vertiminals have primarily focused on terminal design [Reference Vázquez17, Reference Zelinski18] and approach operations [Reference Shao, Shao and Lu19, Reference Song and Yeo20], limited attention has been given to ground operations. Efficient ground operations, including taxi route and TLOF pad selection, integrated taxiing and TLOF pad scheduling, and gate assignment (detailed in Section 3), are crucial for minimising resource wastage and improving throughput. We define the throughput of a system as the number of UAM vehicles arriving and/or departing in a time window. For example, arrival throughput on a TLOF pad can be defined as the number of vehicles landed in 15 min.
Unlike traditional aircraft, which face bottlenecks at runways [Reference Furini, Kidd, Persiani and Toth21], VTOL aircraft use TLOF pads for take-off and soon after are free to climb in any direction. While vertiports can face bottlenecks due to high demand and operational reasons, this flexibility of climbing in any direction can be leveraged to design efficient schedules to increase the throughput while adhering to safety constraints such as wake vortex and minimum separation distance requirements. However, these constraints introduce delays across various operations such as gate departure, taxiing, takeoff and climbing. To address these scheduling challenges, we propose a mixed integer linear programme (MILP) formulation that optimally schedules vertiminal operations by minimising the sum of weighted delays. The weight assignments offer operational flexibility, allowing operators to prioritise tasks as needed. A few examples from this formulation include (a) prioritising arrivals over departures and (b) prioritising congestion on taxiways over surface directions.
Unlike traditional aircraft, which are constrained by linear runway dependencies [Reference Furini, Kidd, Persiani and Toth21], VTOL aircraft utilise TLOF pads and possess the unique ability to climb in any direction immediately after lift-off. While vertiports remain structural bottlenecks due to high demand, this omni-directional flexibility can be leveraged to design multi-dimensional schedules. Such optimisation maximises throughput and mitigates terminal-area congestion during peak traffic conditions, all while strictly adhering to safety constraints such as wake vortex and minimum separation distances.
Building on our previous work [Reference Saxena, Joshi, Yashashav, Prabhakar and Kuri22], this paper extends the MILP framework by incorporating arriving flights, modelling gate turnaround operations, and significantly reducing computational complexity. In addition, we derive analytical throughput bounds, offering deeper insights into vertiminal operations and capacity limitations. We further validate our MILP formulation and throughput analysis using the Gimpo Vertiminal case study [Reference Ahn and Hwang23]. The main contributions of this paper are as follows:
-
1. A novel operational procedure is proposed where a UAM flight can use multiple climb and approach surface directions. Using the proposed MILP for scheduling, the delay is reduced up to 50%, increasing the throughput of the vertiminal.
-
2. The MILP model is extended to incorporate arriving flights and turn around at gates. We reduce the number of variables, decreasing the computation time significantly by more than 90%. Comparison with first come first serve (FCFS) scheduling highlights the benefits of our approach.
-
3. We derive equations to compute bounds on the throughput of a vertiminal that considers various sequences of aircraft movements and different flight classes. The calculations using these equations show that the upper bound on throughput obtained from the MILP scheduling is tight.
-
4. As a case study, we adopt one of the most optimised vertiminal topologies proposed in Ref. [Reference Ahn and Hwang23].
The rest of the paper is organised as follows. Section 2 is on related work in literature. Formulation and explanation of the optimisation problem along with its results are presented in Section 3. Section 4 derives the equations required to calculate the throughput of a vertiminal. We have also compared the results of throughout calculation with the MILP formulation. The case study of our work is presented in Section 5. Finally, in Section 6, we summarise our work and discuss the future scope of the study.
2.0 Related work
2.1 Ground operations in conventional airports
Taxiing and runway scheduling are well-researched areas for traditional aircraft and airports. Numerous works [Reference Jiang, Xu, Zhang and Luo14, Reference Gotteland and Durand24, Reference Liu and Guo25] have developed genetic algorithm-based techniques for solving taxiing problems. These works calculated a fit function based on taxiing length, delays, conflicts, etc. While computationally efficient, genetic algorithms often yield suboptimal solutions compared to exact optimisation methods such as MILP. The framework presented in Ref. [Reference Clare and Richards26] describes a MILP method for joint airport-taxiway routing and runway scheduling, using a receding-horizon approach to enhance scalability. Similarly, the work presented in Ref. [Reference Lee and Balakrishnan15] introduced MILP and a sequential approach to solve runway – taxiway scheduling. The thesis work of Simaiakis [Reference Simaiakis27] analyses the departure process at an airport using queuing models and proposes dynamic programming algorithms. For aircraft arrivals, a novel approach described in Ref. [Reference Cheng, Zou and Liu28] selects the appropriate runway exit, which is the outcome of the taxiing scheduling problem that considers uncertain runway exit time and past exit selection patterns. In recent advancements, machine learning techniques have been employed to optimise ground operations. Furthermore, the work in Ref. [Reference Herrema, Curran, Hartjes, Ellejmi, Bancroft and Schultz29] has used machine learning (ML) techniques to determine runway exit, and its inference is utilised in Ref. [Reference Morgan, Ellejmi, Herrema and Curran30] for calculating runway utilisation and validation. Gate assignments have also been explored as critical components of airport scheduling as they affect runways to taxiway routes. Studies such as Refs [Reference Deng, Xu, Zhao and Song16, Reference Behrends and Usher31, Reference Deng, Sun, Zhao, Li and Wang32] have examined gate assignment problems, focusing on passenger-centric metrics. While several such studies in the literature address different aspects of airport ground operations, most treat arrival, turnaround and departure processes separately. Only a few works, such as Refs [Reference Glomb, Liers and Rösel33–Reference Weiszer, Chen and Locatelli35], address these operations through holistic joint optimisation. Among these integrated approaches, notably Ref. [Reference Bosson, Xue and Zelinski34] provides node or waypoint-level scheduling, which aligns closely with the methodology adopted in our work and has therefore been used as a reference for our problem formulation.
2.2 Vertiport and vertiminal design and operations
Recent works on vertiport scheduling and design, such as Ref. [Reference Kleinbekman, Mitici and Wei36], present the methods to determine optimal ‘Required time of arrival’ using MILP by considering energy and flight dynamics, while Ref. [Reference Shao, Shao and Lu19] proposes a multi-ring structure over a multi-vertiport. The multi-ring structure only handles air traffic by constructing control rules of junctions based on the cyclic phase backpressure strategy and an integrated adaptive scheduling model based on traffic structure and operation control rules. However, it does not consider handling ground operations. The thesis work in Ref. [Reference Vázquez17] discusses the software tools for vertiport design simulation and analysis. Since a vertiminal can have multiple gates and TLOF pads, several works such as Refs [Reference Zelinski18, Reference Ahn and Hwang23, Reference Vascik and Hansman37, Reference Preis and Hornung38] have conducted extensive studies on their design, capacity and throughput analysis. The work presented in Ref. [Reference Vascik and Hansman37] reviewed various heliport topologies (linear, satellite, pier and remote apron) for vertiminals and developed an integer programme based on the Bertsimas-Stock multi-commodity [Reference Bertsimas and Stock Patterson39] flow model to analyse vertiminal operations. Their extensive experiments investigated the impact of factors like gate-to-TLOF-pad ratio, operational policies and staging stand availability on throughput and capacity envelope. However, they have not considered the inter-separation distance requirements on taxiways and surface directions among different classes or types of flights. The study in Ref. [Reference Ahn and Hwang23] analysed various topologies for maximising throughput at Gimpo airport vertiminal. These topologies are based on EASA and FAA guidelines. While the authors have used obstacle-free volume, they do not explore the concept of multiple surface directions. The work of Ref. [Reference Preis and Hornung38] proposed a heuristic for vertiminal design focusing on efficient ground operations in UAM. Their work analysed average passenger delay based on vertiminal layout and demand profile throughout the day. In summary, none of these works has considered multiple climb and approach surface directions for vertiminal operations.
2.3 Our contributions
To the best of our knowledge, no work has considered multiple climb and approach directions for take-off and landing, with an integrated approach towards ground operation processes such as taxiing and turnaround at gates at a vertiminal. The impact of arrival and departure operations on vertiminal throughput, particularly across different operational sequences (e.g. Arrival-Arrival, Arrival-Departure) and various classes or types of UAM vehicles, remains largely unexplored. Our work offers fresh insights into these aspects. Our work builds upon the optimisation problem proposed in Ref. [Reference Jacob Tsao, Wei, Pratama and Tsao40]. Unlike the base formulation, which minimises the weighted sum of the gate, taxiing and queuing delays at conventional airports, our work minimises the weighted sum of delays for approach, landing, taxiing, turnaround, gate, take-off and climbing operations at vertiminals.
3.0 Vertiminal operations
The ground operations on a vertiminal are similar to those of an airport; however, the difference lies in their arrival or departure operations. Figure 1(a) shows a conventional airport system where an aircraft occupies the runway, accelerates to the required ground speed, takes off and, after attaining a certain altitude, will deviate in the direction of the approved flight plan. The two-line segments ‘A to B’ and ‘B to C’ depict the common distance occupied by only one flight at a time, thus being a bottleneck to back-to-back departing traffic.
Comparison of flight paths. (a) Aircraft flight path. (b) VTOL vehicle flight path.

Example of OFV with two approach and climb surface directions [9].

A vertiminal handles traffic of UAM VTOL-capable aircraft. Such aircraft are defined as heavier-than-air aircraft, other than an aircraft or helicopter, capable of performing VTOL using more than two lift or thrust units to provide lift during the take-off and landing [9]. A UAM aircraft departs from the gate and travels a defined path on vertiminal called a taxiway, either on the ground or by air, before reaching the TLOF pad. Unlike conventional runways, these pads are compact, and thus, a VTOL vehicle can reach cruising altitude (point C) quickly and start its approved flight plan. Figure 1(b) shows a VTOL vehicle take-off from a TLOF pad. The line segment ‘A to B’ shows the vertical take-off, and the line segment ‘B to C’ is of
 $0$
length.
Figure 2 shows an example of obstacle-free volume (OFV), which is a funnel-shaped area with several climb surface directions (two in Fig. 2) available to the TLOF pad. The OFV guarantees that VTOLs can accomplish take-offs and landings within a sizable vertical segment, designed suitably to remain within environmental and noise limits in urban settings. At the end of the OFV boundary, there can be multiple climb surface directions for VTOL vehicles to reach the vertiexit. We define vertiexit as a point where the UAM VTOL aircraft exits from the vertiminal airspace at the cruising altitude. For safe operations, only one UAM vehicle should occupy OFV. A minimum separation time is required for successive take-offs and landings to overcome wake turbulence on the TLOF pad. Two UAM aircraft climbing or approaching on the same surface direction are required to maintain a minimum separation distance. However, no minimum separation distance is required if the two aircraft fly in different surface directions. Hence, the total delay can be reduced, provided the scheduling algorithm takes advantage of the multiple directions when deciding the take-off/landing sequence. The addition of multiple directions thus effectively reduces the shared path length and increases throughput.
A departure-ready flight can experience delays along its path due to the following:
-
1. Separation requirements on the taxiways;
-
2. TLOF pad availability while the previous VTOL aircraft climbs the OFV boundary;
-
3. Wake turbulence time separation requirements on TLOF pad;
-
4. Separation requirements on the climb surface direction in case multiple consecutive UAM vehicles take the same direction.
Arriving flights will experience similar delays, however, in the reverse order. Our goal is to formulate a scheduling problem to minimise a weighted sum of all such delays that should help improve the throughput of a vertiminal.
3.1 Problem formulation
Given the number of UAM aircraft, their classes, their operation routes and their arrival and desired departure times, we need to design an efficient scheduling algorithm. We use the MILP technique to formulate the scheduling problem. The objective is to minimise the weighted sum of delays a UAM aircraft experiences during its complete operation. The time consumed on constrained resources like TLOF pads would be penalised more than the less constrained resources, such as gates. The constraints for the objective problem are the physical constraints, separation requirements and other ATM regulations. In Section 3.3, we will discuss the effect of multiple surface directions on departure delay experienced by different flight loads and their classes using the formulation presented in this section. We will also compare our formulation with FCFS scheduling. Throughout this work, we use the terms VTOL and flight interchangeably instead of UAM aircraft. We use the term ‘surface direction’ in the optimisation problem to denote both the take-off climb surface direction and the approach surface direction.
3.1.1 Assumptions
As explained below, several simplifying assumptions are made in modelling vertiminal operations.
-
• Vertiminals will provide a standard fixed-width surface direction to ensure VTOL remains within this specified limit.
-
• The approach or climbing speed of a VTOL is assumed to be given and governed by equipment type, environment and regulations.
-
• Given a TLOF pad and a gate, the taxi route of each VTOL is predefined.
-
• Nominal range of taxi speed is assumed to be given. Thus, given the length of the taxiway, the minimum and maximum travel time can be estimated.
-
• The passage times at critical points along taxi routes, OFV and surface direction given by the solution to the optimisation problem can be met by a VTOL. We also assume hovering is not allowed for VTOLs.
-
• For an outgoing flight, a gate acts as a source of the flight and a vertiexit acts as a sink, while for an arriving flight that does not need to turn around, a vertiexit is the source and a gate is the sink.
-
• The number of VTOLs that have to turn around on the gates will not exceed the holding capacity of the gate.
-
• At the gates, for turnaround flights, the flight whose boarding completes first will be ready to leave first.
3.1.2 VTOL operations in a vertiminal
Tables 1 and 2 represent notation for a vertiminal and VTOL on a vertiminal, respectively. Figure 3 shows the nodes and links explained in Table 1. Let
 ${P_i}{\rm{\;\;}}\forall i \in A$
represent the physical taxi route for a VTOL
 $i$
, from its first node to its last node.
 ${P_i}$
is represented by an ordered set of
 ${k_i}$
nodes
 $\left\{ {n_1^i,n_2^i, \ldots ,n_{{k_i}}^i} \right\} \in {N_T}$
starting with the first node
 $n_1^i$
of the route, which is the exit of the assigned TLOF pad for
 $i \in {A^{Arr}}$
and gate exit for
 $i \in {A^{Dep}}$
, progressing through the intermediate nodes and ending at the last node of route
 $n_{{k_i}}^i$
which is the gate entrance for
 $i \in {A^{Arr}}$
or assigned TLOF pad entrance for
 $i \in {A^{Dep}}$
, where
 ${k_i}$
denotes the total number of nodes involved in
 ${P_i}$
.
 $P_i^a$
represents taxiing route
 $\forall i \in {A^{Arr}}$
while
 $P_i^d$
represent taxiing route
 $\forall i \in {A^{dep}}$
.
The nodes and link representation for the optimisation problem that are explained in Table 1. The orange line represents the path of a VTOL from gate to vertiexit.

A VTOL
 $i$
with a stop on the vertiminal will follow the following route:
-
(i) Link
 ${{\rm{\Lambda }}^{Arr}}(i)$
represents the approach direction to the assigned TLOF pad
${\tau ^{Arr}}(i)$
.
-
(ii) Link connecting OFV boundary node
${\rm{\Lambda }}_O^{Arr}(i)$
and TLOF pad
${\tau ^{Arr}}(i)$
. -
(iii) A sequentially ordered set
$P_i^a$
of nodes
$n \in {N_T}$
, from the TLOF pad exit node
${\tau ^{ex}}(i)$
to the entrance of the gate
${\gamma ^{en}}(i)$
. -
(iv) For the turnaround flights
$i \in {A^{TAT}}$
, VTOL would be in the holding space of the gate
$\gamma (i)$
, where boarding and deboarding occur. -
(v) A sequentially ordered set
$P_i^d$
of nodes
$n \in {N_T}$
, from the starting gate node
${\gamma ^{ex}}(i)$
to the entrance of the assigned TLOF pad
${\tau ^{en}}(i)$
. -
(vi) Link connecting OFV boundary
${\rm{\Lambda }}_O^{Dep}(i)$
and TLOF pad
${\tau ^{Dep}}(i)$
. -
(vii) Link
${{\rm{\Lambda }}^{Dep}}(i)$
represents the vclimb direction to the assigned TLOF pad
${\tau ^{Dep}}(i)$
.


3.1.3 Formulation
The objective function shown in Equation (1) minimises the weighted sum of delays incurred during departures, arrivals and turnaround operations for VTOL vehicles. These delays are computed for each operational stage, with the decision variables and weights detailed in Tables 3 and 4, respectively. Below, the delay components for each operation type are outlined:
Decision variables used in optimisation problem

Table 3 Long description
The table has four rows and three columns. Column headers are 'Decision Variables', 'Description', and 'Constraints'. Row 1: Decision Variables, t_i^n; Description, non-negative variable representing the time at which VTOL i reaches node n; Constraints, for all i in A, for all n in N. Row 2: Decision Variables, y_ij^n; Description, Binary variable, indicating if VTOL i reaches node n before VTOL j does; Constraints, for all n in N, for all i, j in A^n, i not equal to j. Row 3: Decision Variables, z_ij; Description, Binary variable used for selecting the minimum exit time for VTOLs in the turnaround time (TAT) set; Constraints, for all i, j in A^TAT, i not equal to j.
Description of weight symbols for different delays used in objective function in Equation (1)

Table 4 Long description
A table describing weight symbols for different delays used in an objective function for VTOL vehicles. The table has 9 rows and 2 columns. The columns are labeled 'Symbol' and 'Description'. Row 1: Symbol, W_g; Description, Weight assigned to a departing VTOL for the time it expends at the gate. 0 ≤ W_g ≤ 1. Row 2: Symbol, W_t^Dep; Description, Weight assigned to a departing VTOL for the taxiing time it expends. The requirement W_g ≤ W_t^Dep ≤ 1 ensures that a VTOL should spend more time on the gate rather than on taxiways so as to avoid congestion and save energy. Also, it is beneficial for a multirotor to fly (in the case of air taxiing) at the maximum optimal speed in order to reduce energy consumption [41]. Row 3: Symbol, W_r^Dep; Description, Weight assigned to a VTOL for the time it spends on the TLOF pad and inside the OFV during take-off. TLOF pad and OFV are highly constrained resources and a bottleneck; hence, this weight value should be kept high. 0 ≤ W_r^Dep ≤ 1. Row 4: Symbol, W_r^Arr; Description, Weight assigned to a VTOL for the time it spends inside the OFV and on the TLOF pad during landing. TLOF pad and OFV are highly constrained resources and a bottleneck; hence, this weight value should be kept high. 0 ≤ W_r^Arr ≤ 1. Row 5: Symbol, W_t^Arr; Description, Weight assigned to an arriving VTOL for the taxiing time it expends. The requirement 0 ≤ W_t^Arr ≤ W_r ensures that the VTOL will leave the TLOF pad at the earliest. Row 6: Symbol, W_c^Dep; Description, Weight assigned to a departing VTOL to the time it expends to reach vertiexit from a OFV boundary. 0 ≤ W_c^Dep ≤ 1. Row 7: Symbol, W_c^Arr; Description, Weight assigned to an arriving VTOL to the time it expends to reach the OFV boundary from a vertiexit. 0 ≤ W_c^Arr ≤ 1. Row 8: Symbol, W_q; Description, Weight assigned to a VTOL for spending time on holding space of a gate after arrival. 0 ≤ W_q ≤ 1.
For departures (
 $i \in {A^{Dep}}$
)
-
• waiting at the departure gate:
$GD_i^D = {W_g}\!\left( {t_i^{{\gamma ^{ex}}(i)} - {\mathtt{DRGATE}}_{i}} \right)$
-
• taxiing from gate exit to TLOF pad entry:
$TD_i^D = W_t^{Dep}\!\left( {t_i^{{\tau ^{en}}(i)} - t_i^{{\gamma ^{ex}}(i)}} \right)$
-
• climbing inside OFV:
$OD_i^D = W_r^{Dep}\!\left( {t_i^{{\rm{\Lambda }}_O^{Dep}(i)} - t_i^{{\tau ^{en}}(i)}} \right)$
-
• climbing to vertiexit from OFV boundary:
$SD_i^D = W_c^{Dep}\!\left( {t_i^{{\rm{\Lambda }}_F^{Dep}(i)} - t_i^{{\rm{\Lambda }}_O^{Dep}(i)}} \right)$


For arrivals (
 $i \in {A^{Arr}}$
)
-
• approach from vertiexit to OFV boundary:
$SD_i^A = W_c^{Arr}\!\left( {t_i^{{\rm{\Lambda }}_O^{Arr}(i)} - {\mathtt{ARAPPR}}_{i}} \right)$
-
• leaving the TLOF pad:
$OD_i^A = W_r^{Arr}\!\left( {t_i^{{\tau ^{ex}}(i)} - t_i^{{\rm{\Lambda }}_O^{Arr}(i)}} \right)$
-
• reaching the gate:
$TD_i^A = W_t^{Arr}\!\left( {t_i^{{\gamma ^{en}}(i)} - t_i^{{\tau ^{ex}}(i)}} \right)$


For turnaround VTOLs (
 $i \in {A^{TAT}}$
)
-
• turnaround time on the gates:
$TT{D_i} = {W_Q}\!\left( {t_i^{{\gamma ^{ex}}(i)} - t_i^{{\gamma ^{en}}(i)}} \right)$
(1)
\begin{align}\mathop \sum \limits_{i \in {A^{De}}} \big[ {GD_i^D + TD_i^D + OD_i^D + SD_i^D\big] { + \mathop \sum \limits_{i \in {A^{TAT}}} TT{D_i} + \mathop \sum \limits_{i \in {A^{Arr}}} } \big[SD_i^A + OD_i^A + TD_i^A} \big]\end{align}


The constraints are as follows:
C1: We impose constraint (2) to ensure that an arriving VTOL starts on the approach surface direction starting from vertiexit.
 \begin{align}t_i^{{\rm{\Lambda }}_F^{Arr}(i)} = {\mathtt{ARAPPR}}_{i}{\rm{\;\;\;\;\;\;\;\;}}\forall i \in {A^{Arr}}\end{align}
C2: A VTOL
 $i \in {A^{Arr}}$
traverses physical nodes
 $p \in \left\{ {{\rm{\Lambda }}_F^{Arr}(i) \cup {\rm{\Lambda }}_O^{Arr}(i) \cup {\tau ^{Arr}}(i) \cup {\rm{\;\;}}P_i^a \cup \gamma (i)} \right\}$
while a VTOL
 $i \in {A^{Dep}}$
traverses physical nodes
 $p \in \left\{ {P_i^d \cup {\tau ^{Dep}}(i) \cup {\rm{\Lambda }}_O^{Dep}(i) \cup {\rm{\Lambda }}_F^{Dep}(i)} \right\}$
. For speed control and smooth travel over all the links, i.e. taxiing ways, OFV and surface direction, constraint (3) is required. The terms
 $T_{il_p^i}^{min}{\rm{\;\;}}and{\rm{\;\;}}T_{il_p^i}^{max}$
are the respective minimum and maximum times taken by VTOL
 $i$
on the link
 $l_{p,p + 1}^i \in L$
.
 \begin{align}t_i^p + T_{il_{p,p + 1}^i}^{min} \le t_i^{p + 1} \le t_i^p + T_{il_{p,p + 1}^i}^{max}\end{align}
C3: A VTOL will spend time on the gate not less than its turnaround time, which is ensured by constraint (4).
 \begin{align}t_i^{{\gamma ^{ex}}(i)} - t_i^{{\gamma ^{en}}(i)} \geq TA{T_i}{\rm{\;\;\;\;\;\;\;\;}}\forall i \in {A^{TAT}}\end{align}
C4: Constraint (5) is the minimum time when the VTOL should leave the gate and start taxiing.
 \begin{align}t_i^{{\gamma ^{ex}}(i)} \geq {\mathtt{DRGATE}}_{i}{\rm{\;\;\;\;\;\;\;\;}}\forall i \in {A^{Dep}}\end{align}
C5: Definition of predecessors
 $y_{ij}^n$
:
 \begin{align}t_j^n \geq t_i^n - \!\left( {1 - y_{ij}^n} \right)\!M{\rm{\;\;\;\;\;\;\;\;}}\forall n \in N,\forall i,j \in {A^n},i \ne j\end{align}
 \begin{align}y_{ij}^n + y_{ji}^n = 1{\rm{\;\;\;\;\;\;\;\;}}\forall n \in N,\forall i,j \in {A^n},i \ne j\end{align}
C6: The following constraint prevents overtaking in terms of
 $y_{ij}^n$
:
 \begin{align}\begin{array}{*{20}{l}}{y_{ij}^n - y_{ij}^m = 0{\rm{\;\;\;\;\;\;\;\;}}}\\[5pt] {\forall i,j \in A,i \ne j,\forall {l_{n,m}} \in ( {{P_i} \cup {\rm{\Lambda }}(i)}) \cap ({{P_j} \cup {\rm{\Lambda }}(j)})}\end{array}\end{align}
C7: For preventing the head-on collision of two VTOLs on a link
 ${l_{n,m}}$
, the following constraint is used:
 \begin{align}\begin{array}{*{20}{l}}{y_{ij}^n - y_{ij}^m = 0{\rm{\;\;\;\;\;\;\;\;}}\forall i,j \in A,i \ne j,}\\[5pt] {\forall {l_{n,m}} \in \!\left( {{P_i} \cup {\rm{\Lambda }}(i) \cup {L_O}} \right){\rm{\;\;}}and{\rm{\;\;}}{l_{m,n}} \in ( {{P_j} \cup {\rm{\Lambda }}(j) \cup {L_O}})}\end{array}\end{align}
C8: This constraint maintains the separation requirement on the taxi and surface direction, where
 $L_{ij}^{sep}$
is the separation requirement between VTOL in units of distance over the edge (or link) of length
 $L({n,m})$
.
 \begin{align}\begin{array}{*{20}{l}}{t_j^n \geq t_i^n + \dfrac{{L_{ij}^{sep}}}{{L({n,m})}}({t_i^m - t_i^n}) - \!\left( {1 - y_{ij}^n} \right)M}\\[9pt] {\forall {l_{n,m}} \in {L_G} \cup {L_T} \cup {L_F}{\rm{\;\;}}\forall i,j \in {A^n},i \ne j}\end{array}\end{align}
C9: The constraint Equation (10) enforces the gate holding capacity of a gate
 $g \in {N^G}$
that should not be exceeded. We have shown for holding capacity of 3. Equations (11a-d) linearise the constraint.
 \begin{align}\begin{array}{*{20}{l}}{t_i^{{g^e}} \gt = min\!\left( {t_j^{{g^{ex}}},t_k^{{g^{ex}}},t_l^{{g^{ex}}}} \right)}\\[5pt] {if{\rm{\;\;}}y_{ji}^g = y_{ki}^g = y_{li}^g = 1}\\[5pt] {g = \gamma (i) = \gamma (j) = \gamma (k) = \gamma (l),}\\[5pt] {\forall i,j,k,l \in {A^{TAT}},i \ne j \ne k \ne l}\end{array}\end{align}
 \begin{align}t_i^{{g^{en}}} \geq t_j^{{g^{ex}}} - \!\left( {1 - y_{ji}^g} \right)M - \!\left( {1 - {z_{ij}}} \right)M\end{align}
 \begin{align}t_i^{{g^{en}}} \geq t_k^{{g^{ex}}} - \!\left( {1 - y_{ki}^g} \right)M - \!\left( {1 - {z_{ik}}} \right)M\end{align}
 \begin{align}t_i^{{g^{en}}} \geq t_l^{{g^{ex}}} - \!\left( {1 - y_{li}^g} \right)M - \!\left( {1 - {z_{il}}} \right)M\end{align}
 \begin{align}{z_{ij}} + {z_{ik}} + {z_{il}} \geq 1\end{align}
C10: Constraint (12) maintains the wake vortex requirement on the TLOF pad when a VTOL
 $i$
lands (or does a take-off) where
 $W_{ij}^{tsep}$
is the minimum time VTOL
 $j$
should wait to either arrive or depart after the arrival (or departure) of VTOL
 $i$
.
 \begin{align}\begin{array}{*{20}{l}}{t_j^r \geq t_i^r + W_{ij}^{tsep} - \!\left( {1 - y_{ij}^r} \right)M}\\[5pt] {\forall i,j \in {A^r},i \ne j,\tau (i) = \tau (j) = r}\end{array}\end{align}
C11: The time taken to reach the TLOF pad exit point upon landing is captured by constraint (13).
 \begin{align}t_i^{{\tau ^{ex}}(i)} \geq t_i^{{\tau ^{Arr}}(i)} + TOT_i^{Arr}{\rm{\;\;\;\;\;\;\;\;}}\forall i \in {A^{Arr}}\end{align}
C12: The time taken to take off after entering the TLOF pad from an entry point is captured by constraint (14). Constraints (14) and (13) along with (3) maintain the time continuity over the VTOL’s route.
 \begin{align}t_i^{{\tau ^{Dep}}(i)} \geq t_i^{{\tau ^{en}}(i)} + TOT_i^{Dep}{\rm{\;\;\;\;\;\;\;\;}}\forall i \in {A^{Dep}}\end{align}
C13: Upon arrival of VTOL
 $i$
, the following VTOL
 $j$
should reach the OFV boundary only after VTOL
 $i$
has left the TLOF pad through its exit point. Constraint (15) satisfies this requirement.
 \begin{align}\begin{array}{*{20}{l}}{t_j^{{\rm{\Lambda }}_O^{Arr}(j)} \geq t_i^{{\tau ^{ex}}(i)} - \!\left( {1 - y_{ij}^r} \right)M}\\[5pt] {\forall i,j \in {A^{Arr}},i \ne j,{\tau ^{Arr}}(i) = {\tau ^{Arr}}(j) = r}\end{array}\end{align}
C14: When a VTOL
 $i$
departs from the assigned TLOF pad, its immediate follower VTOL
 $j$
cannot enter the TLOF pad till VTOL
 $i$
has crossed its OFV boundary. Constraint (16) ensures this.
 \begin{align}\begin{array}{*{20}{l}}{t_j^{{\tau ^{en}}(j)} \geq t_i^{{\rm{\Lambda }}_O^{Dep}(i)} - \!\left( {1 - y_{ij}^r} \right)M}\\[5pt] {\forall i,j \in {A^{Dep}},i \ne j,{\tau ^{Dep}}(i) = {\tau ^{Dep}}(j) = r}\end{array}\end{align}
C15: A departing VTOL must enter a TLOF pad only after the arriving VTOL has left the TLOF pad.
 \begin{align} \begin{array}{*{20}{l}}{t_j^{{\tau ^{en}}(j)} \geq t_i^{{\tau ^{ex}}(i)} - \!\left( {1 - y_{ij}^r} \right)M}\\[5pt] {\forall i \in {A^{Arr}},j \in {A^{Dep}},{\tau ^{Dep}}(j) = {\tau ^{Arr}}(i) = r}\end{array}\end{align}
C16: Binary and non-negativity constraints:
 \begin{align}t_i^n \in {R^ + }{\rm{\;\;\;\;\;\;\;\;}}\forall i \in A,\forall n \in N\end{align}
 \begin{align}y_{ij}^n \in \left\{ {0,1} \right\}{\rm{\;\;\;\;\;\;\;\;}}\forall n \in N,\forall i,j \in A_0^n,i \ne j\end{align}
Comparison of previous formulation opt A and present formulation opt B, in terms of number of constraints, formulation time and solver time. The decrease in the formulation and solver time is more than 90% due to a massive decrease in the number of constraints

Table 5 Long description
The table compares the number of constraints, formulation time, and solver time for two formulations, opt A and opt B, across different numbers of flights and directions. The table has 4 columns and 16 rows. Column headers are Number of flights, Number of directions, Number of constraints: opt A, Number of constraints: opt B, Formulation time (s): opt A, Formulation time (s): opt B, Solver time (s): opt A, Solver time (s): opt B. Row labels are the numbers of flights (5, 10, 15, 20, 40) and directions (1, 2, 3, 4). The values in the table show the number of constraints, formulation time, and solver time for each combination of flights and directions. Notable trends include a significant decrease in the number of constraints and formulation time for opt B compared to opt A, leading to a more than 90% decrease in solver time.
3.2 Comparison to the previous formulation
In our earlier work [Reference Saxena, Joshi, Yashashav, Prabhakar and Kuri22], we formulated the optimisation problem (Opt A) using two binary variables: immediate predecessor
 $x$
and predecessor
 $y$
. Our present optimisation formulation (Opt B) has eliminated the immediate predecessor variable
 $x$
because
 $y$
implicitly incorporates the information conveyed by
 $x$
.
This change eliminated the need for a dummy VTOL and also reduced 10 constraint equations, thus drastically reducing the time to reach the solution. Given the input parameters, the optimisation programme generates all the equations for the solver to solve. Formulation time is the time the programme takes to generate the equations, and solver time is the time the solver takes to solve the equations. Table 5 compares Opt A and Opt B in terms of the total number of constraints, formulation time and solver time when given identical input parameters. As observed, the number of constraints in Opt B is reduced by more than 90%, which in turn decreases both formulation and solver time. Additionally, it is noteworthy that the number of constraints with four directions is consistently lower than with one direction due to a reduction in the number of common nodes and edges among flights.
3.3 Results from formulation: only departures
We used MATLAB version 2022a (9.12) with an optimisation toolbox of version 9.3 on a desktop PC equipped with an i7-11700F processor having 16 cores (8 physical) @ 2.5GHz and 64GB RAM to solve the optimisation problem described in Section 3.1. Our implementation is available on GitHub for reproducibility [42].
Figure 4 shows the topology used in our computational setup. All taxi edges in the network are equal in length, and similarly, all surface direction edges are equal. However, the length of the surface direction edges is greater than that of the taxi edges.
Table 6 mentions the weights used in objective (1) of MILP and other parameters that encompass several edge lengths and speeds. In the simulation initialisation, we uniformly randomise the gate and surface direction for every VTOL. The associated schedule times,
 $DRGAT{E_i}$
and
 $ARAPP{R_i}$
, are uniformly generated within a 600-s window using
 $randi$
function of MATLAB. The large constant
 $M$
is set as
 $(\lceil(|A|/10)\rceil+1) {\rm{*}}2000$
, a heuristic value.
The solution provides the exact schedule of a VTOL movement from gate to vertiexit – the times at which a VTOL: (i) departs from the gate, (ii) crosses each node in its path, (iv) arrives at the TLOF pad, (v) crosses OFV boundary and (vi) exits from the vertiexit.
Sample topology with four gates, three parking slots each and two surface directions.

The
 $MinTravelTime$
for a VTOL is calculated as
 $t_i^{{\rm{\Lambda }}_F^{Dep}(i)} - {\mathtt{DRGATE}}_{i},i \in {A^{Dep}}$
, where
 ${\mathtt{DRGATE}}_{i}$
is the desired time to depart from the gate and
 $t_i^{{\rm{\Lambda }}_F^{Dep}(i)}$
is the time to reach the vertiexit. It is achievable only when no other VTOLs are present in the vertiminal. By comparing the actual time (provided by the MILP solution) with
 $MinTravelTime$
, we determine the ExcessDelay. Our goal is to observe the effect of multiple surface directions on ExcessDelay incurred by departing flights. We consider a total of
 ${\rm{four}}$
surface directions from the OFV boundary (‘X’ in Fig. 4). The total number of runs is 24 (six different sets of flights and four directions). We compare the ExcessDelay obtained from our formulation with that of FCFS scheduling. Our implementation of FCFS uses the same set of constraints described in Section 3.1 with an additional constraint that forces the VTOLs to take off according to the order of their
 ${\mathtt{DRGATE}}_{i}$
. We recall that a route is defined by the following
 ${\rm{four}}$
elements: departing gate, a taxiing path from gate to TLOF pad, TLOF pad and surface direction. For comparison, in each run MILP and FCFS are provided with the same set of flights along with their route and
 ${\mathtt{DRGATE}}_{i}$
.
When two successive VTOLs use different surface directions, since there is no separation requirement, it is sufficient for the follower to take off by adhering only to wake vortex separation, thus reducing its overall delay i.e. ExcessDelay. This delay reduction is observed in Fig. 5 by comparing the delay distribution among flights with an increase in the number of surface directions. From Fig. 5, we see a delay reduction of about 50% as we increase the number of surface directions from 1 to 2. Furthermore, as we increase the number of flights, the delay increases due to congestion on vertiminal. An analysis of the delay distribution for a flight set between our MILP and FCFS scheduling reveals notable differences. The third quartile (75%) of MILP is lower than the third quartile of FCFS (with the exception of single surface direction and 150 flights). The mean and median of MILP are always less than those of FCFS. Our MILP delays tend to skew away from the maximum delay, as evidenced by a higher mean value than the median. In contrast, the FCFS delays are uniformly distributed among flights, with coinciding mean and median values. In the presence of multiple surface directions, our formulation provides a significantly lower mean delay. More than 50% of the flights have a 50% reduction in delay. In summary, our MILP formulation prioritises minimising overall flight delays.
Weights and parameters used in the MILP (* used in Section 4.4)

Table 6 Long description
A table with 10 rows and 3 columns. The columns are labeled as follows: Column 1: Parameter symbols, Column 2: Values, Column 3: Descriptions. Row 1: Parameter symbol, W subscript g, Value, 0.2, Description, Gate taxiway length. Row 2: Parameter symbol, blank, Value, blank, Description, 30 units. Row 3: Parameter symbol, W subscript t Dep, Value, 0.8, Description, Taxiway edge length. Row 4: Parameter symbol, blank, Value, blank, Description, 45 units. Row 5: Parameter symbol, W subscript OFV Dep, Value, 1, Description, OFV length. Row 6: Parameter symbol, blank, Value, blank, Description, 75 units. Row 7: Parameter symbol, W subscript s Dep, Value, 0.7, Description, Surface direction length. Row 8: Parameter symbol, blank, Value, blank, Description, 300 units. Row 9: Parameter symbol, W subscript r Arr star, Value, 1, Description, Max surface direction speed. Row 10: Parameter symbol, blank, Value, blank, Description, 23.73 units per second.
Results from MILP overlapped with FCFS for multiple surface directions. The results are generated for 20, 40, 60, 80, 100 and 150 flights (indicated by different colours). It shows a reduction in ExcessDelay by increasing the number of surface directions. The mean value of each box plot is marked in a small circle for MILP and a big circle for FCFS. Observe that the FCFS mean delay is aligned with its median and is always higher than the mean delay of MILP.

The bar plots shown in Fig. 6 represent the distribution of ExcessDelay components such as gate delay (waiting at the gate), taxiing delay, OFV delay and climb delay for each flight. Taxing delays signify congestion on taxiways, while OFV delay indicates a lack of availability of resources such as the TLOF pad and OFV. Due to congestion on taxiways, a VTOL may not be able to fly or move at the optimal speed, which may result in energy wastage [Reference Saxena, Pal, Iyengar, Chhaglani, Ghosh, Padmanabhan and Venkata41]. Thus, taxi delays are undesirable, and it is more energy-efficient to wait at the gate.
Distribution of delays of 40 flights among gate delay (blue bars), taxing delay (orange bars), OFV delay (green bars) and climb delay on four directions. For MILP the weights used are
 ${W_g} = 0.2,W_t^{Dep} = 0.8,W_r^{Dep} = 1,W_c^{Dep} = 0.7$
. It can be observed that the MILP with equal weights faces taxiing delays while FCFS additionally faces OFV delays, causing delays on other flights. (a) MILF. (b) MILP with equal weights. (c) FCFS.

Figure 6 Long description
Panel A: A bar graph titled MILP 4 direction shows delays for 40 flights. The x-axis represents flights, and the y-axis represents delay in seconds. The graph includes four data series: DepGateDelay (blue bars), DepTaxidelay (orange bars), DepOFVDelay (green bars), and DepFxDelay (red bars). The delays vary significantly across flights, with some flights experiencing high delays in specific categories. Panel B: A bar graph titled MILP equal wts 4 direction shows delays for 40 flights. The x-axis represents flights, and the y-axis represents delay in seconds. The graph includes the same four data series as Panel A. This graph shows a more balanced distribution of delays across the different categories compared to Panel A. Panel C: A bar graph titled FCFS 4 direction shows delays for 40 flights. The x-axis represents flights, and the y-axis represents delay in seconds. The graph includes the same four data series as the previous panels. This graph shows a different pattern of delays, with notable delays in the OFV category.
We used 40 flights with four surface directions and compared the results with FCFS scheduling. Figure 6(a) shows the MILP formulation where all the flights experience only gate delay. Additionally, we analyse the impact of equal weights used in the objective to study the VTOL delay. This effectively changes the objective to minimise the sum of delay, i.e.
 $\mathop \sum \nolimits_{i \in {A^{Dep}}} \!\left( {t_i^{{\rm{\Lambda }}_F^{Dep}(i)} - {\mathtt{DRGATE}}_{i}} \right)$
. Figure 6(b) shows the MILP with equal weights. The delay constitutes gate delay and taxiing delay. The taxiing delay (orange bars) occurs as flights are slowly moving on taxiways instead of waiting at the gate, even though the overall delay is at par with MILP (shown in Fig. 6(a)). Figure 6(c) shows gate delay, taxiing delay and OFV delay (green bars) for FCFS scheduling. The OFV delay component is large compared to the zero OFV delay in MILP. In summary, the delay breakup not only demonstrates the importance of weighted delays in the objective function, but it also shows that FCFS scheduling leads to increased delay incurred by the VTOLs.
4.0 Throughput capacity equations
In the previous section, our objective was to minimise a weighted sum of delays, subject to constraints arising from vertiminal operations. While the weighted sum of delays is optimised, we do not know if the optimal strategy in Section 3.1 ends up affecting the throughput of the vertiminal. To answer this question, we study the maximum throughput that can be achieved – this is what we call ‘throughput capacity’.
The capacity of the system composed of: (a) TLOF pads, (b) taxiways and (c) gates at the apron would determine the maximum throughput capacity of a vertiminal. We analyse each of these elements independently and base our analysis on Ref. [Reference De Neufville43]. Finally, the throughput obtained using the optimal strategy presented in Section 3.1 is compared with the throughput capacity derived from the analysis in this section.
4.1 TLOF pad system
The TLOF pad system consists of a TLOF pad, OFV and surface directions as illustrated in Fig. 7. We analyse the throughput capacity by considering the arrivals and departures of VTOLs to and from the system. While a few factors, such as visibility, precipitation, wind direction, etc., have been ignored, the following factors are considered in the capacity calculations:
-
• Number of TLOF pads
-
• Number of surface directions
-
• Separation requirements between VTOLs imposed by the ATM system
-
• Mix of VTOL classes using the vertiminal
-
• Mix of movements such as arrivals, departures, or mixed on each TLOF pad and their sequencing
TLOF pad system with two surface directions ‘X-N’ and ‘X-E’.

We define the term maximum throughput capacity as the maximum number of movements that can be performed in unit time on a TLOF pad without violating ATM rules. We first calculate for a single TLOF pad and then extend our calculations to multiple TLOF pads. On a TLOF pad, there are four possible sequences of movement pairs: Arrival-Arrival
 $\!\left( {\mathbb{A}\mathbb{A}} \right)$
, Departure-Departure
 $\!\left( {\mathbb{D}\mathbb{D}} \right)$
, Arrival-Departure
 $\!\left( {\mathbb{A}\mathbb{D}} \right)$
and Departure-Arrival
 $\!\left( {\mathbb{D}\mathbb{A}} \right)$
. Recall that ATM regulations require a safe separation distance on surface directions and wake vortex time separation on the TLOF pad. These separation requirement values depend on the classes of the VTOLs involved. Additionally, during departure or arrival operations, only one VTOL can occupy the OFV. The throughput capacity is determined by the time separation enforced by ATM rules for various VTOL classes executing different movements.
The different time parameters we are going to utilise for analysis are:
-
1.
$t_{ij}^{sep}$
: The safe separation distance required on the surface direction between VTOL
$i$
and
$j$
,
$i$
followed by
$j$
, is converted into time separation (constraint (9)). -
2.
$t_{ij}^w$
: Wake vortex separation on TLOF pad between VTOL
$i$
and
$j$
. -
3.
$t_i^{TOT}$
: Occupancy time of a VTOL
$i$
entering a TLOF pad before take-off or after landing on a TLOF pad before exit. -
4.
$t_i^{R - X},t_i^{X - R}$
: OFV travel time by a VTOL during departure or arrival, respectively. -
5.
$t_i^{X - N},t_i^{N - X}$
: Surface direction travel time by a VTOL during departure or arrival, respectively.


The following equations calculate the maximum time
 $T_{ij}^{{\mathbb{M}_1}{\mathbb{M}_2}}$
required in different sequences of movements
 $\!\left( {{\mathbb{M}_1}{\mathbb{M}_2}} \right)\!,\;where{\rm{\;\;}}{\mathbb{M}_1},{\mathbb{M}_2} \in \left\{ {\mathbb{D},\mathbb{A}} \right\}$
, and VTOL
 $i$
is followed by VTOL
 $j$
.
-
• Arrival-Arrival: Two VTOLs are arriving from vertiexit to the TLOF pad. If the VTOLs
$i$
and
$j$
are arriving from different surface directions, then set
$t_{ij}^{sep}$
to 0.(19)
\begin{align}T_{ij}^{\mathbb{A}\mathbb{A}} = max\!\left( {t_{ij}^{sep},t_{ij}^w,t_i^{X - R} + t_i^{TOT}} \right)\end{align}
-
• Departure-Departure: Two VTOLs are departing from the TLOF pad to vertiexit. If the VTOLs
$i$
and
$j$
are departing in different surface directions, then set
$t_{ij}^{sep}$
to 0.(20)
\begin{align}T_{ij}^{\mathbb{D}\mathbb{D}} = max\!\left( {t_{ij}^{sep},t_{ij}^w,t_i^{TOT} + t_i^{R - X}} \right)\end{align}
-
• Arrival-Departure: When an arrival is followed by a departure on a TLOF pad. In case the VTOLs
$i$
and
$j$
are using different surface directions, set
$t_i^{N - X}$
to 0.(21)
\begin{align}T_{ij}^{\mathbb{A}\mathbb{D}} = max\!\left( {t_i^{N - X} + t_i^{X - R} + t_i^{TOT},t_{ij}^w} \right)\end{align}
-
• Departure-Arrival: When a departure is followed by an arrival on a TLOF pad. In case the VTOLs
$i$
and
$j$
are using different surface directions, set
$t_i^{X - N}$
to 0.(22)
\begin{align}T_{ij}^{\mathbb{D}\mathbb{A}} = max\!\left( {t_i^{TOT} + t_i^{R - X} + t_i^{X - N},t_{ij}^w} \right)\end{align}


The maximum throughput of the movement pair
 ${\mathbb{M}_1}{\mathbb{M}_2}$
per unit time is given as
 \begin{align}{\mu ^{{\mathbb{M}_1}{\mathbb{M}_2}}} = \frac{1}{{min\!\left( {T_{ij}^{{\mathbb{M}_1}{\mathbb{M}_2}}} \right)}},{\mathbb{M}_1},{\mathbb{M}_2} \in \left\{ {\mathbb{D},\mathbb{A}} \right\},i,j \in A,i \ne j\end{align}
The work in Ref. [Reference De Neufville43] calculates the expected capacity of a runway by considering all the possible aircraft classes and all possible permissible pairs of movements that have occurred in the past and then using a probability of occurrence for each of these events. Due to a lack of any real-world data on UTM, our calculation is limited to the maximum throughput of any system. The maximum throughput of any movement pair
 $\!\left( {{\mathbb{M}_1}{\mathbb{M}_2}} \right)$
is calculated by evaluating the VTOL classes that have the minimum values of the time parameters. We take the minimum time of all movement pairs to find the bottleneck in the system and define the throughput capacity.
 \begin{align}{T_{ij}} = min\!\left( {T_{ij}^{\mathbb{A}\mathbb{A}},T_{ij}^{\mathbb{D}\mathbb{D}},T_{ij}^{\mathbb{A}\mathbb{D}},T_{ij}^{\mathbb{D}\mathbb{A}}} \right)\end{align}
The maximum throughput capacity of the TLOF pad system, per unit time, is then given as:
 \begin{align}{\mu ^{TLOF}} = \frac{1}{{{T_{ij}}}}\end{align}
A TLOF pad can facilitate both arrival and departure movements, or can also cater to a single type of movement. In the case of a vertiminal equipped with multiple TLOF pads, its capacity is decided according to the configuration, i.e. there can be several combinations of assigning arrivals and departure movements to the TLOF pads. For instance, in a vertiminal with two TLOF pads, one configuration might utilise both pads for both arrival and departure. In contrast, another configuration might designate one TLOF pad exclusively for arrivals and the other for departures. In either case, the overall capacity of the vertiminal is determined by the combined throughput capacity of each individual TLOF pad.
 \begin{align}\mu _c^{TLOF} = \mathop \sum \limits_{r \in {N_R}} {1 \over {T_{ij}^{r,c}}},{\rm{\;\;\;\;\;\;\;\;}}r \in {N_R},c \in C\end{align}
where
 $T_{ij}^{r,c}$
is calculated for each TLOF pad
 $r$
using (25) for a configuration (
 $c$
) from a set of configurations.
4.2 Taxiway system
The traditional airport always has a taxiway running parallel to the runway. These long, well-designed taxiways are not a factor limiting the capacity of an airport. However, the taxiway system of vertiminal would be different as they are shorter, linking TLOF pads’ entry and exit points to the gate exit and entry points, respectively, as shown in Fig. 8. There might be a single taxiway link or multiple taxiways with intersections among them on the vertiminal, each being a half-duplex link. Considering the gates and TLOF pads as sources and sinks, respectively (or even vice versa), the taxiway system can be conceptualised as a flow network problem. By deriving each link’s flow capacity, the flow network’s maximum capacity can be calculated using the max-flow min-cut theorem [Reference Leighton and Rao44].
Taxiway system connecting TLOF pad and gates.

Each taxiway link has a static and dynamic capacity. Static capacity can be defined as the maximum number of stationary vehicles on it, while the dynamic capacity is the maximum number of vehicles passing through it per unit time, which is independent of taxiway length. Assuming uniform taxi velocities for all VTOL classes, the minimum sum of vehicle length and safe separation distance between two vehicles determines the dynamic capacity on any taxiway link and, thus, its flow rate. Given the size of the VTOL vehicle as
 ${d_{len}}$
, the separation distance
 ${d_{sep}}$
and the maximum taxi velocity of the VTOLs as
 ${v_{taxi}}$
, the maximum flow rate of a taxiway link can be calculated as:
 \begin{align}maxFlowRate = \frac{1}{{({{d_{len}} + {d_{sep}}})/{v_{taxi}}}}\end{align}
If the three parameters in Equation (27) remain constant for each taxiway link, the maximum flow rate remains uniform across the entire taxiway network. However, varying
 ${d_{sep}}$
and
 ${v_{taxi}}$
for each link necessitates the use of the max-flow min-cut theorem to calculate the overall maximum flow rate for the network (
 ${\mu ^{taxi}}$
).
Gate system with four gates, each having three slots.

4.3 Gate system
The gate system on a vertiminal can consist of multiple gates, each having multiple parking slots for VTOLs, as shown in Fig. 9. The most basic and standard way to calculate the capacity of a gate system is the total number of VTOLs that can stand on a vertiminal simultaneously, referred to as static capacity (
 ${{\mathbb C}_G} = \mathop \sum \nolimits_{g \in {N_G}} {c_g}$
). However, a better measure of the capacity is the dynamic capacity, defined as the number of VTOLs per unit time that can be accommodated by the gate system, and this is affected by the VTOLs’ turnaround times. For calculating the maximum throughput of the gate system, the class of vehicle having the minimum turnaround time
 $TAT$
should be considered. The maximum throughput is then calculated as:
 \begin{align}{\mu ^G} = \frac{{{\mathbb{C}_G}}}{{TA{T_{small}}}}\end{align}
 ${\mu ^G}$
is an ideal value assuming immediate slot refilling.
4.4 Vertiminal throughput
Till now, we have shown individual throughput calculations for TLOF pad, taxiway and gate systems, considering them independently. The overall vertiminal’s throughput is limited by the minimum of the three systems as shown:
 \begin{align}{\mu ^{vertiminal}} = {\rm{min}}\!\left( {{\mu ^{TLOF}},{\mu ^{taxi}},{\mu ^G}} \right)\end{align}
4.5 Results from throughput capacity
Recall that in the last three subsections, we discussed the capacity equations for the (a) TLOF pad system, (b) taxiway system and (c) gate system. We determine the maximum achievable throughput of the vertiminal using the equations and the parameters shown in Table 6. We had considered the smallest class of VTOLs because they have the shortest turnaround time and minimum separation distance requirements. We will use the same system settings, topology (Fig. 4) and parameters (Table 6) as used in Section 3.3 for computation. Using the time stamp of the VTOLs to reach the TLOF pad, we analyse the throughput achieved by the MILP explained in Section 3.1. We have varied the number of flights and the number of surface directions for all possible combinations of movements. For the computation of the TLOF pad system, we will use only
 ${A^{Arr}}$
(or
 ${A^{Dep}}$
) where the vertiexit is a source (sink), and the gates act as sinks (sources).
The following are the two sets of parameters used in the comparison of throughput analysis using MILP and the equations from Section 4:
-
• Set1: Separation requirement on surface direction is 75 units, turnaround time (TAT) at the gate is 90 s.
-
• Set2: Separation requirement on surface direction is 280 units, TAT at the gate is 120 s.
4.5.1 TLOF pad system
The time parameters described in Section 4.1, (19)–(22), are presented in Table 7. We calculate the maximum time required for all the movement sequence pairs shown in Table 8. For Set1, the movement pair Arrival-Arrival or Departure-Departure gives the maximum achievable throughput (
 ${\mu ^{AA}}{\rm{\;\;}}or{\rm{\;\;}}{\mu ^{DD}}$
) of
 $\!\left( {\frac{{60}}{{6.375}}} \right){\rm{\;\;}}9.41$
VTOLs per minute.
TLOF pad system time parameters

Table 7 Long description
The table presents time parameters for a TLOF pad system. It has six rows and three columns. The columns are labeled Short description, Symbol, and Value. Row 1: Separation requirement in air, t_ij^sep, 4.41 s (Set1), 11.79 s (Set2). Row 2: Wake vortex separation requirement, t_ij^w, 0.833 s. Row 3: Occupancy time on TLOF pad, t_i^TOT, 2 s. Row 4: OFV ascending/descending time, t_i^R - X, t_i^X - R, 4.375 s. Row 5: Surface direction ascending and descending time, t_i^X - N, t_i^N - X, 12.65 s.
TLOF pad system maximum time calculation for each movement pair and each set

Table 8 Long description
The table presents data on TLOF pad system maximum time calculations for each movement pair and each set. It has 2 sets, 4 rows per set, and 3 columns. The columns are labeled Surface directions, Movement pair, and TLOF times (s). The rows detail the surface directions as Single or Multiple, the movement pairs as T_ij^AA or T_ij^DD, T_ij^AD or T_ij^DA, T_i^AD or T_ij^DA, and the corresponding TLOF times in seconds. For Set 1, Single surface directions with movement pair T_ij^AA or T_ij^DD have a TLOF time of 6.375 seconds, while Single surface directions with movement pair T_ij^AD or T_ij^DA have a TLOF time of 19.02 seconds. Multiple surface directions with movement pair T_ij^AA or T_ij^DD have a TLOF time of 6.375 seconds, and Multiple surface directions with movement pair T_i^AD or T_ij^DA also have a TLOF time of 6.375 seconds. For Set 2, Single surface directions with movement pair T_ij^AA or T_ij^DD have a TLOF time of 11.67 seconds, while Single surface directions with movement pair T_ij^AD or T_ij^DA have a TLOF time of 19.02 seconds. Multiple surface directions with movement pair T_ij^AA or T_ij^DD have a TLOF time of 6.375 seconds, and Multiple surface directions with movement pair T_ij^AD or T_ij^DA also have a TLOF time of 6.375 seconds.
Whereas for Set2, the movement pair Arrival-Arrival or Departure-Departure gives the maximum achievable throughput (
 ${\mu ^{AA}}{\rm{\;\;}}or{\rm{\;\;}}{\mu ^{DD}}$
) of
 $\!\left( {\frac{{60}}{{11.67}}} \right){\rm{\;\;}}5.14$
VTOLs per minute for a single surface direction and
 $\!\left( {\frac{{60}}{{6.375}}} \right){\rm{\;\;}}9.41$
VTOLs per minute for multiple surface directions.
If two consecutive VTOLs have different routes, then the separation requirement for the same surface direction,
 $t_{ij}^{sep}$
, is set to 0. In Set1, since the combined TLOF pad occupancy time and OFV travel time (
 $t_i^{TOT} + {t^{R - X}}$
) is greater than
 $t_{ij}^{sep}$
, there is no advantage of multiple surface directions. Conversely, in Set2,
 $t_i^{TOT} + {t^{R - X}} \lt t_{ij}^{sep}$
and thus having multiple surface directions gives a higher throughput. The same can be observed in Figs. 10 and 11, which show the throughput achieved by solving the MILP formulation (1). For the TLOF pad system, about 400 MILP computations were run with various sets of flight numbers and surface directions. Each set of computations involved different random arrival and departure timings. To observe the maximum throughput, the input number of flights needs to be significantly high. The plots of 100 and 150 flights thus validate both our MILP formulation and the throughput calculations, including the advantage of multiple surface directions for Set2, as mentioned earlier.
Set1: Throughput versus the number of directions for varying flight counts. There is no advantage of multiple surface directions since OFV occupancy time exceeds the separation time, i.e.
 $t_i^{TOT} + t_i^{R - X} \gt t_{ij}^{sep}$
(a) Arrival. (b) Departure.

Figure 10 Long description
Panel A: A line graph titled Set1 Arrival shows throughput in vertical takeoff and landing (VTOLs) per minute on the vertical axis and the number of directions on the horizontal axis. The graph includes multiple lines representing different numbers of flights (20, 40, 60, 80, 100, 150). Each line shows the throughput for 1, 2, 3, and 4 directions. A dashed line indicates the maximum throughput of 9.41 VTOLs per minute. Panel B: A line graph titled Set1 Departure shows throughput in VTOLs per minute on the vertical axis and the number of directions on the horizontal axis. Similar to Panel A, it includes multiple lines representing different numbers of flights (20, 40, 60, 80, 100, 150). Each line shows the throughput for 1, 2, 3, and 4 directions. A dashed line indicates the maximum throughput of 9.41 VTOLs per minute.
Set2: Throughput versus the number of directions for varying flight counts. Since the OFV occupancy time is less than the separation time, i.e.
 $t_i^{TOT} + t_i^{R - X} \lt t_{ij}^{sep}$
, the benefit of multiple surface directions becomes evident as the flight count increases. (a) Arrival. (b) Departure.

Gate system throughput versus arrival rate. Figure 12a (Set1) depicts conditions where OFV occupancy time is more than separation time and turnaround time (
 ${T^{TAT}}$
) is 90 s, while in Fig. 12b (Set2), OFV occupancy time is less than separation time and
 ${T^{TAT}}$
is 120 s. The Slope=1 line confirms that gate throughput remains consistently below arrival throughput. Notably, the gate throughput decreases as
 ${T^{TAT}}$
increases, as evidenced by the higher throughput in Set1 compared to Set2. However, the arrival rate is bounded by time parameters, as further illustrated in Fig. 12b for single directions.

4.5.2 Gate system
Recall the topology shown in Fig. 4, which has four gates with three parking slots each, resulting in a static capacity (
 ${\mathbb{C}_G}$
) of 12 VTOLs. The maximum dynamic capacity (throughput,
 ${\mu ^G}$
) depends on the turnaround time (
 ${T^{TAT}}$
):
-
1. For Set1,
${\mu ^G} = \frac{{60 \times 12}}{{90}} = 8$
VTOLs per minute. -
2. For Set2,
${\mu ^G} = \frac{{60 \times 12}}{{120}} = 6$
VTOLs per minute.


Figure 12 illustrates variations in gate throughput with arrival rates, based on approximately 1,000 MILP solutions for each set using turnaround flights (
 ${A^{TAT}}$
). Key observations include:
-
• The gate throughput increases with lower turnaround time (
${T^{TAT}}$
), as in Set1. -
• As discussed in previous Subsection 4.5.1, arrival rate is bounded by time parameters, as can be seen from Fig. 12(b) for a single surface direction where OFV occupancy time is less than separation time.
-
• As expected, the gate throughput is consistently lower than the arrival rate, with all data points falling below the line with slope = 1.

4.5.3 Taxiway system
Using the Equation (27) from Section 4.2, the maximum flow rate of the taxiway link is calculated to be
 $\!\left( {\frac{{60}}{{\!\left( {10/6} \right)}}} \right)36$
VTOLs per minute, which represents the entire taxiway network. This is significantly higher than the maximum throughput of the TLOF pad system and gate system, indicating that taxiway flow rate is not a limiting factor for the vertiminal capacity.
4.5.4 Vertiminal throughput
Finally, we obtain the vertiminal’s maximum throughput using Equation (29). For Set1, it is 8 VTOLs per minute, while for Set2, it is 5.14 VTOLs per minute for single surface direction and 6 VTOLs per minute for multiple surface directions.
Our throughput results also align with other works mentioned in Ref. [Reference Vascik and Hansman37]. The authors consider only consolidated arrival and departure times without any consideration of separation requirements. In contrast, from Section 4.1, for a single VTOL, arrival time =
 $t_i^{N - X} + t_i^{X - R} + t_i^{TOT}$
and departure time =
 $t_i^{TOT} + t_i^{R - X} + t_i^{X - N}$
show in detail the occupancy time of a TLOF pad, OFV and travel time on a surface direction. Furthermore, from Equations (19)–(22), the TLOF pad throughput is affected by the maximum of individual time parameters rather than the consolidated arrival or departure time. By increasing any time parameter, arrival and/or departure time may increase, which decreases the throughput, thus validating the results shown in Ref. [Reference Vascik and Hansman37]. Consequently, the estimation of
 ${\mathbb{C}_G}$
required for a single TLOF pad is shown in Equation (30).
 \begin{align}{\mu ^G} = {\mu ^{TOF}} = \gt {\mathbb{C}_G} = \frac{{TAT}}{{{\rm{min}}\!\left( {T_{ij}^A,T_{ij}^{DD}} \right)}}\end{align}
Unlike Ref. [Reference Vascik and Hansman37], our equations allow a detailed analysis of the throughput of the TLOF pad system (
 ${\mu ^{TLOF}}$
), taxiway system (
 ${\mu ^{taxiway}}$
) and the gate system (
 ${\mu ^G}$
), and thus enables deeper understanding and the significance of the TLOF pad to gate ratio.
5.0 Case study: application to Gimpo vertiminal
This case study aims to validate the effectiveness of our proposed optimisation framework and throughput analysis by applying it to a realistic vertiminal design. We also seek to demonstrate how different operational configurations impact the overall throughput of a vertiminal and to identify the configuration that maximises throughput using our MILP formulation. By analysing the vertiminal design proposed for Gimpo Airport [Reference Ahn and Hwang23], Korea, we aim to provide quantitative insights into UAM infrastructure planning and showcase the practical utility of our framework. Gimpo Airport in Korea is a major hub for domestic flights and has been proposed as a candidate for integrating UAM services, presenting a realistic scenario for applying our framework. Specifically, we selected the pier-type topology featuring four TLOF pads and 20 gates, adhering to EASA guidelines, as shown in Fig. 13. This design aims to maximise TLOF pad and gate utilisation.
Gimpo vertiminal topology given by Ref. [Reference Ahn and Hwang23].

Gimpo vertiminal topology with nodes (four TLOF pads and 20 gates) and directions.

5.1 Setup
We evaluated four different operational configurations of the vertiminal on the Gimpo topology shown in Fig. 14:
-
1. Configuration 1: All four TLOF pads are used for both arrivals and departures for all gates, representing a fully flexible operation with potential for high congestion due to shared usage.
-
2. Configuration 2: TLOF pads T1–T2 serve arrivals and departures for gates G1–G10, while T3–T4 serve gates G11–G20, introducing segmentation to reduce path conflicts between the two parts of the terminal.
-
3. Configuration 3: TLOF pads T1 and T4 are designated for departures, and T2–T3 for arrivals, serving all gates. This segregation aims to minimise interactions between arrivals and departures across all TLOF pads.
-
4. Configuration 4: TLOF pads T1 and T4 are designated for arrivals, and T2–T3 for departures, serving all gates, providing an alternative segregation strategy to reduce congestion.
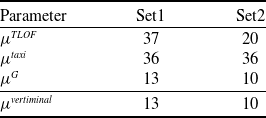
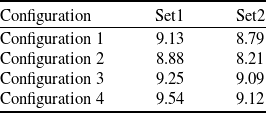
To study throughput bounds, for each configuration, we applied the vertiminal parameters shown in Table 6 and two sets of operational parameters shown in Table 7 from earlier sections. Since we analysed the TLOF pads system, taxiways system and gates system in isolation, for a particular operational parameter set, the theoretical throughput bounds are constant across all configurations within that parameter set. However, these bounds vary between the two operational parameter sets, as shown in Table 9.
We executed approximately 1,000 MILP computations for each configuration and parameter set, varying seed values and the number of scheduled flights.
5.2 Insights
The observed maximum throughput, summarised in Table 10, approached but did not exceed the theoretical bounds as expected. This discrepancy stems from analysing system elements independently and assuming idealised conditions, such as instantaneous vehicle availability at a node and congestion-free paths. Configurations 3 and 4, which segregate arrivals and departures, consistently achieved higher throughput compared to Configurations 1 and 2. The segregation of TLOF pads for arrivals and departures reduces path conflicts and minimises interactions between vehicles, enhancing operational efficiency. Configuration 2 has the lowest throughput as segmentation inadvertently increases the path conflicts within each segment. The use of a single path from multiple gates to the TLOF pads creates bottlenecks, limiting the ability to manage vehicle flow efficiently. These results highlight the importance of operational strategies that reduce path conflicts and congestion of UAM vehicles. By strategically allocating TLOF pads for arrival and departure and optimising vehicle movement paths, vertiport operators can significantly enhance throughput.
Maximum throughput bounds for Set1 and Set2 in terms of vehicles/minute calculated using the bounds shown in Section 4

Table 9 Long description
A table comparing maximum throughput bounds for two sets of operational parameters. The table has four rows and two columns. The column headers are Set1 and Set2. The row labels are mu TLOF, mu taxi, mu G, and mu vertiminal. Row 1: mu TLOF, Set1 37, Set2 20. Row 2: mu taxi, Set1 36, Set2 36. Row 3: mu G, Set1 13, Set2 10. Row 4: mu vertiminal, Set1 13, Set2 10.
Maximum throughput of configurations achieved in vehicles/minute. These maximum values are obtained by solving approximately 1,000 MILP computations for each configuration and parameter set

Table 10 Long description
A table titled 'Table 10' with four rows and three columns. The columns are labeled 'Configuration', 'Set1', and 'Set2'. The row labels are 'Configuration 1', 'Configuration 2', 'Configuration 3', and 'Configuration 4'. The values in the table are as follows: Row 1: Configuration 1, 9.13, 8.79. Row 2: Configuration 2, 8.88, 8.21. Row 3: Configuration 3, 9.25, 9.09. Row 4: Configuration 4, 9.54, 9.12. The table compares the maximum throughput achieved by different configurations in vehicles per minute for two parameter sets, Set1 and Set2.
5.3 Summary
This case study validates the robustness of our optimisation framework and confirms its utility for real-world UAM infrastructure planning. By applying our MILP formulation to different operational configurations, we demonstrated that the choice of configuration has a significant impact on throughput. Specifically, configurations that segregate arrivals and departures (Configurations 3 and 4) outperform those that do not.
Our findings make it explicit that using our MILP formulation, we can choose the best configuration for maximum throughput. By adopting configurations that strategically allocate TLOF pads for arrivals and departures, vertiport operators can enhance capacity and reduce delays, facilitating efficient UAM traffic. This optimisation capability is crucial for meeting the demands of future UAM networks and ensuring the smooth integration of UAM services into existing transportation infrastructure.
6.0 Conclusion
This paper builds upon our prior work [Reference Saxena, Joshi, Yashashav, Prabhakar and Kuri22] by extending the optimisation framework to include arrival flights and turnaround at gates, enabling the generation of optimal schedules for a wider range of vertiport terminal (vertiminal) operations such as Arrival-Departure and Departure-Arrival. Further improvements to the MILP formulation have drastically reduced both the formulation and solver time. Our formulation can achieve up to 50% delay reduction compared to FCFS scheduling. This performance gain stems from efficiently sequencing VTOL classes and utilising multiple surface directions.
Our work delves deeper into vertiminal’s throughput by holistically analysing its three core elements: the TLOF pad system, taxiway network and gate system. In the case of the TLOF pad system, our computation results demonstrate that when flight separation time exceeds OFV occupancy time, the multiple surface directions greatly enhance throughput. On the other hand, gate system throughput is constrained by longer turnaround times, as validated by the MILP formulation. Taxiway network is usually not a bottleneck to the vertiminal throughput. Thus, by deriving precise throughput equations, we provide practitioners with analytical tools to optimise vertiminal design and operations without relying on computationally expensive simulations. Using our framework on one of the most efficient vertiminal designs at Gimpo [Reference Ahn and Hwang23], we demonstrated that the MILP formulation can effectively identify optimal operational configurations.
For future work, we aim to further reduce MILP computation time by incorporating scalable techniques such as rolling horizon methods. We also plan to develop stochastic optimisation and data-driven reinforcement learning models to better handle operational uncertainties and enhance quality of service (QoS) metrics, including equitable delay distribution and position inversion constraints. Future efforts will also involve creating and analysing a capacity envelope for vertiports to better understand their operational limits under various configurations.
Competing interests
The author(s) declare none.
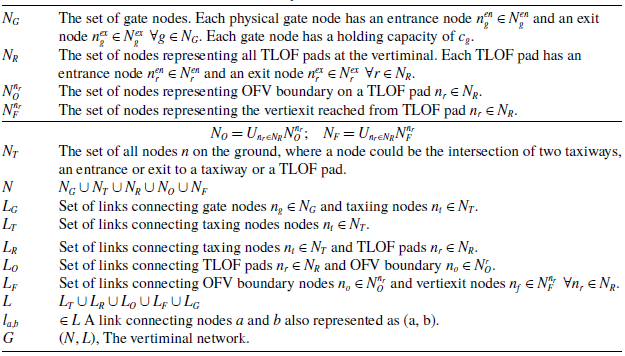
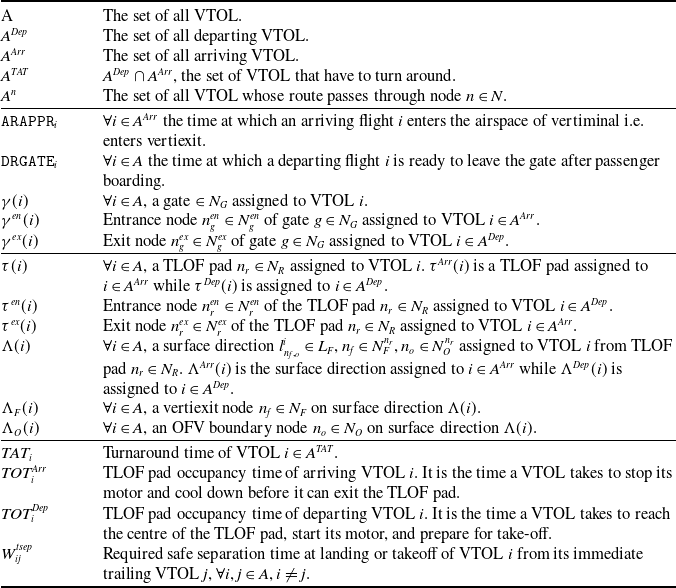


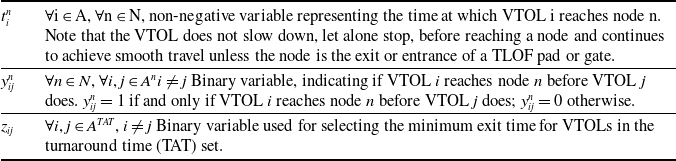
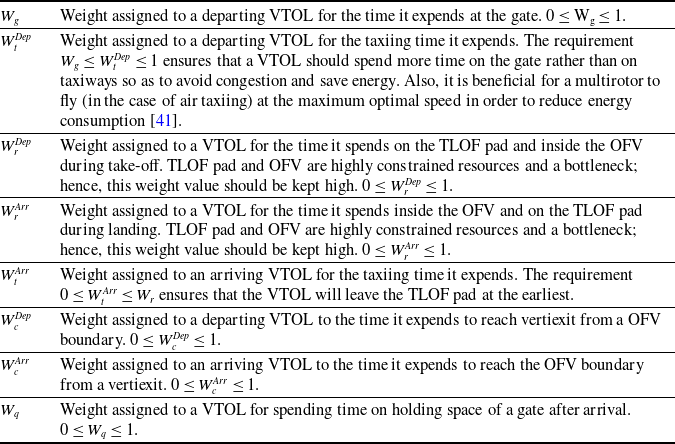
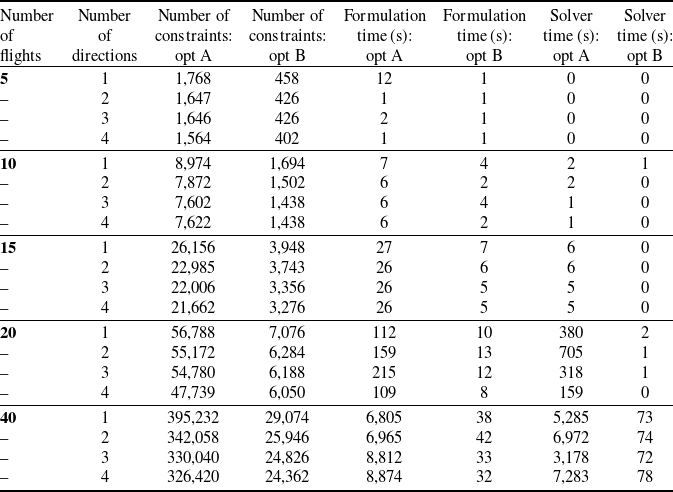
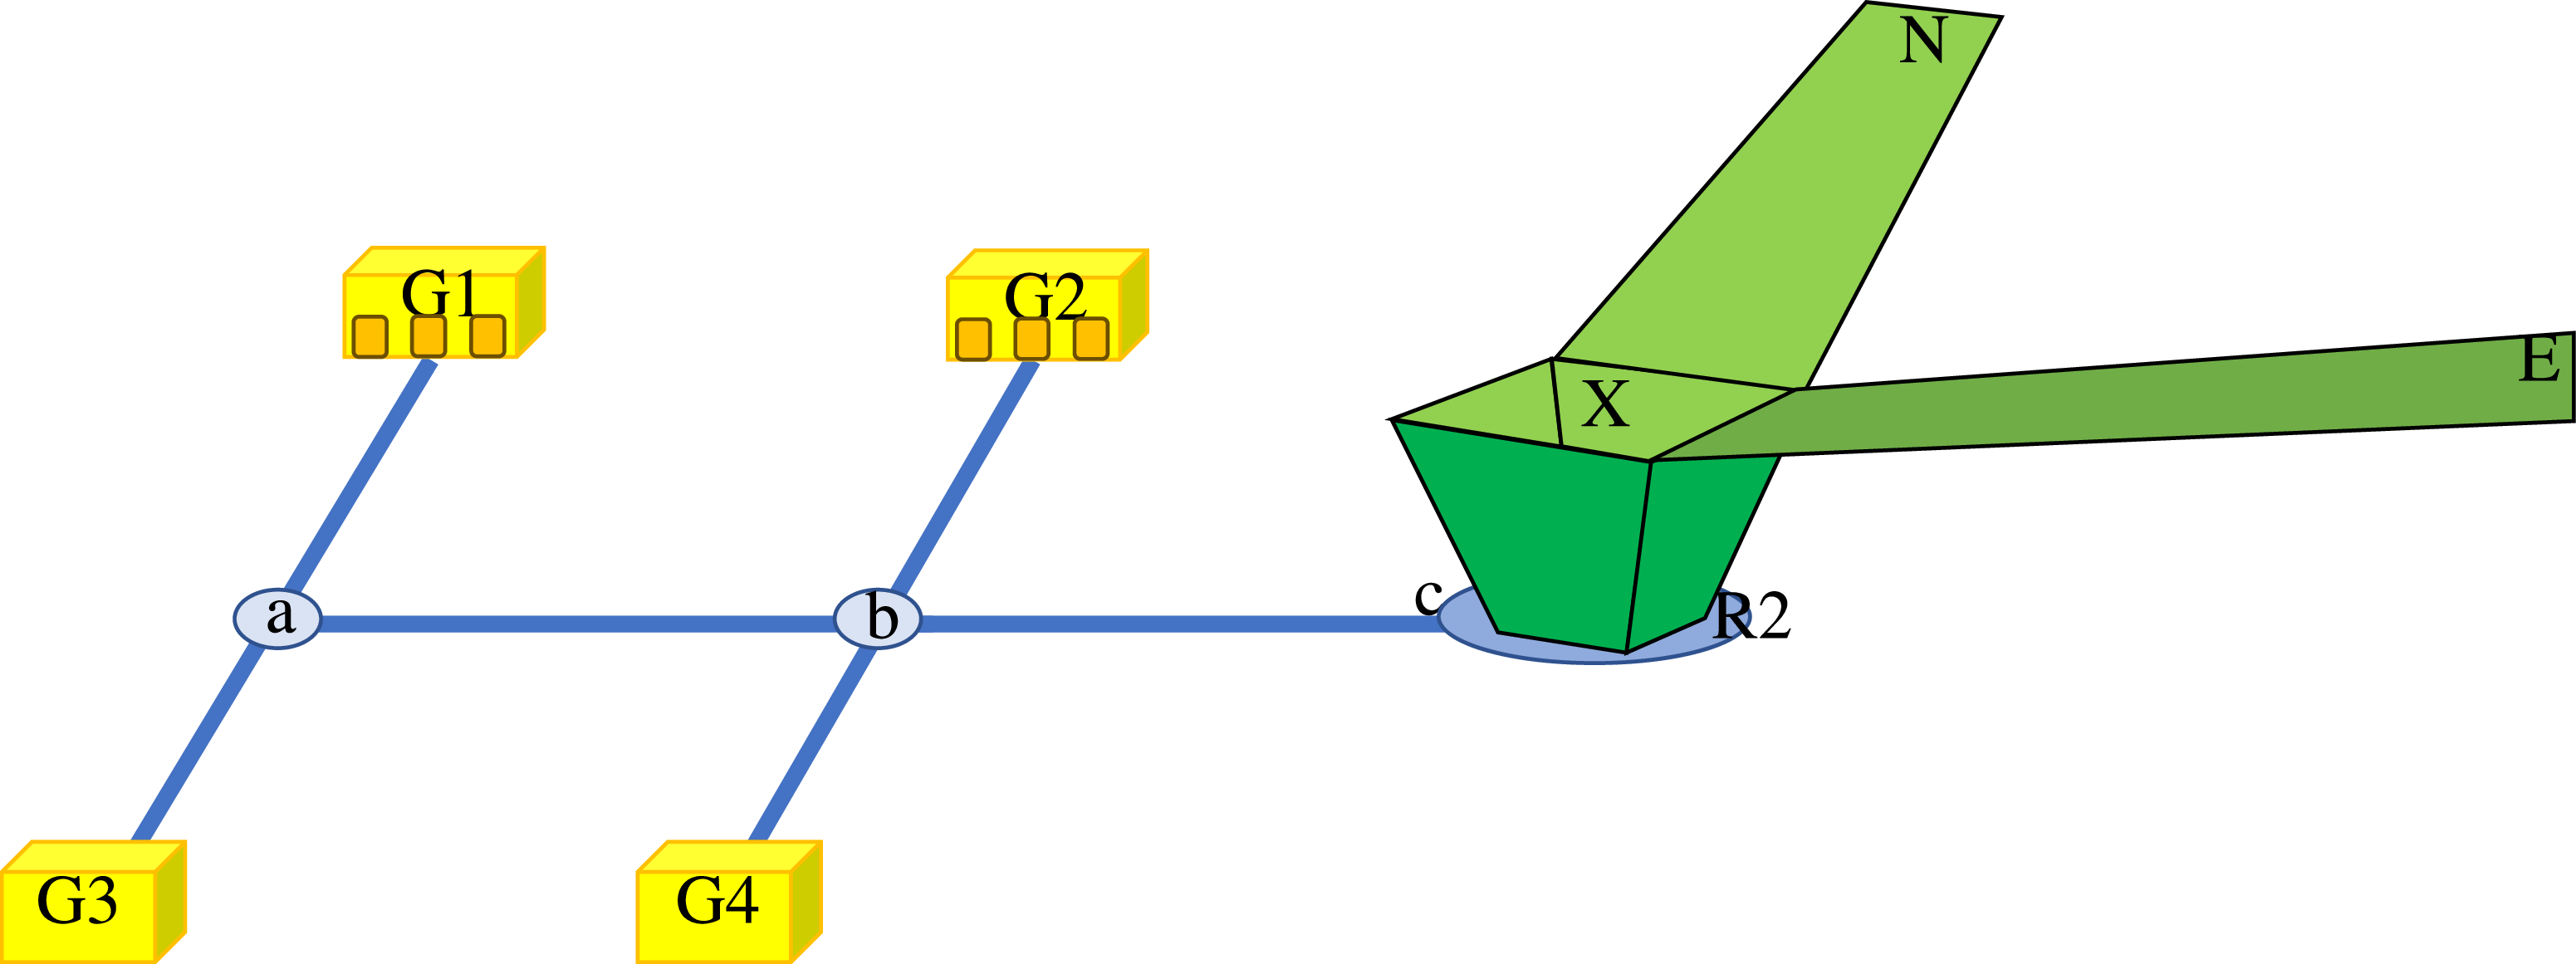
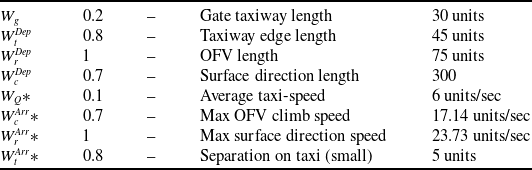

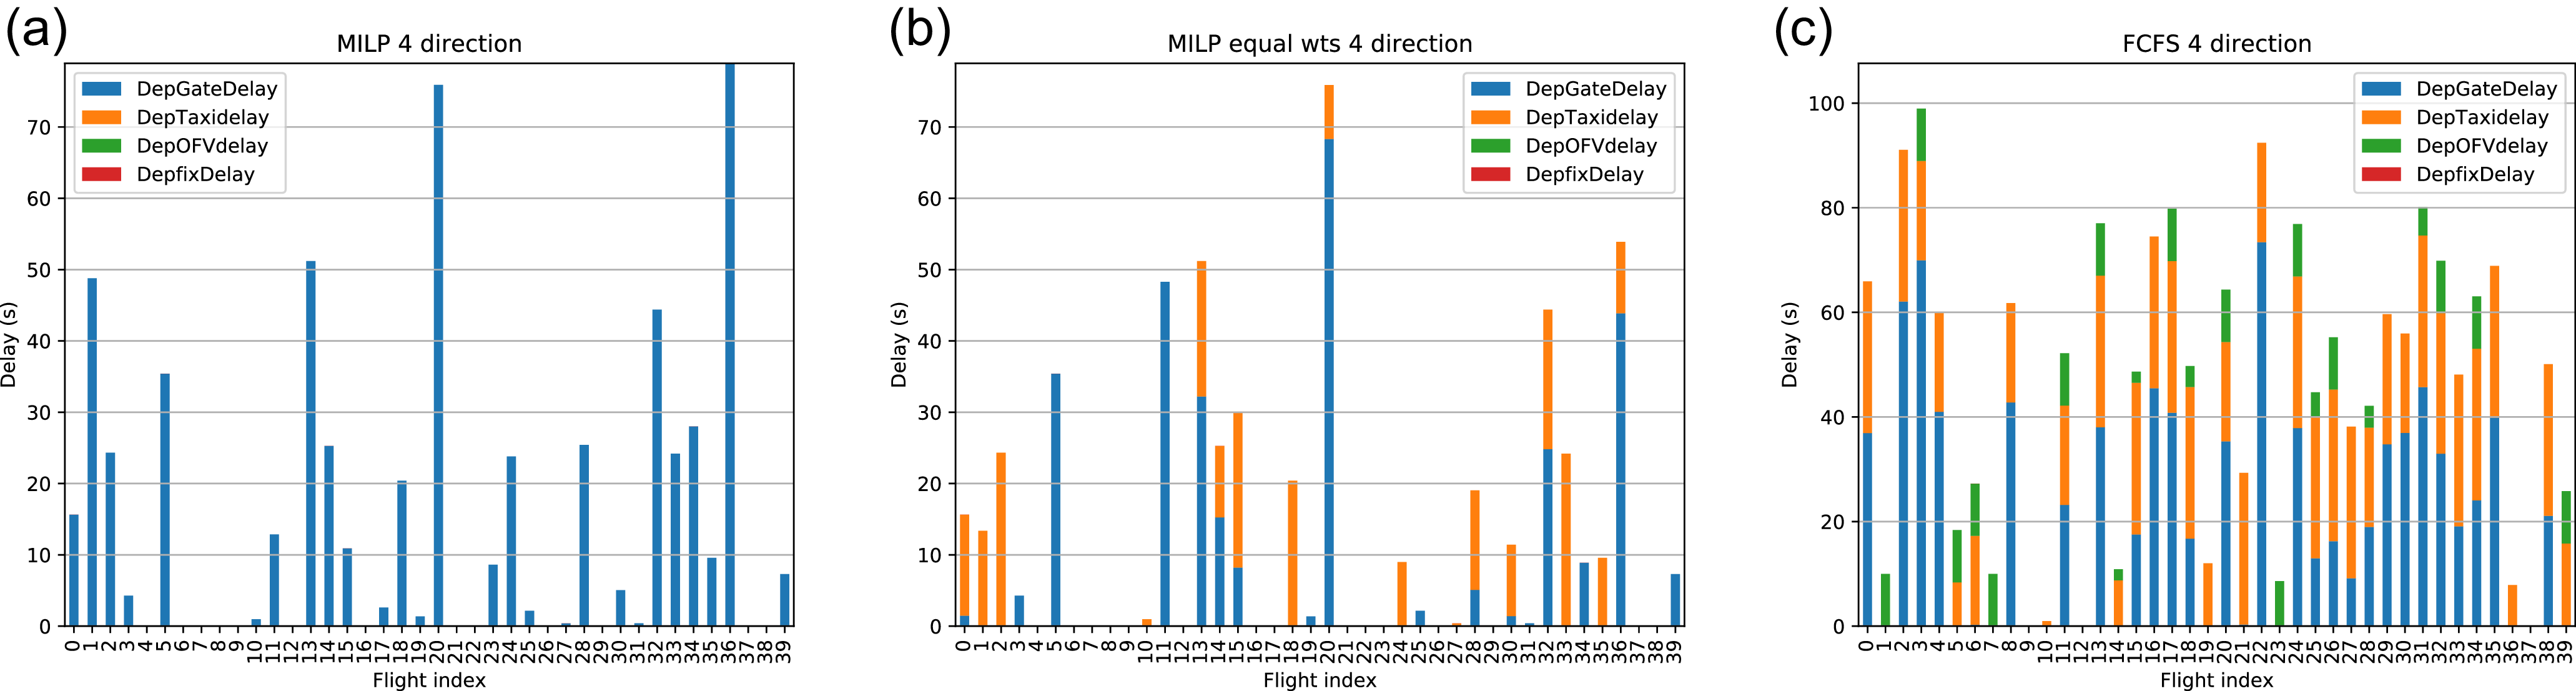
 Wg=0.2,WtDep=0.8,WrDep=1,WcDep=0.7
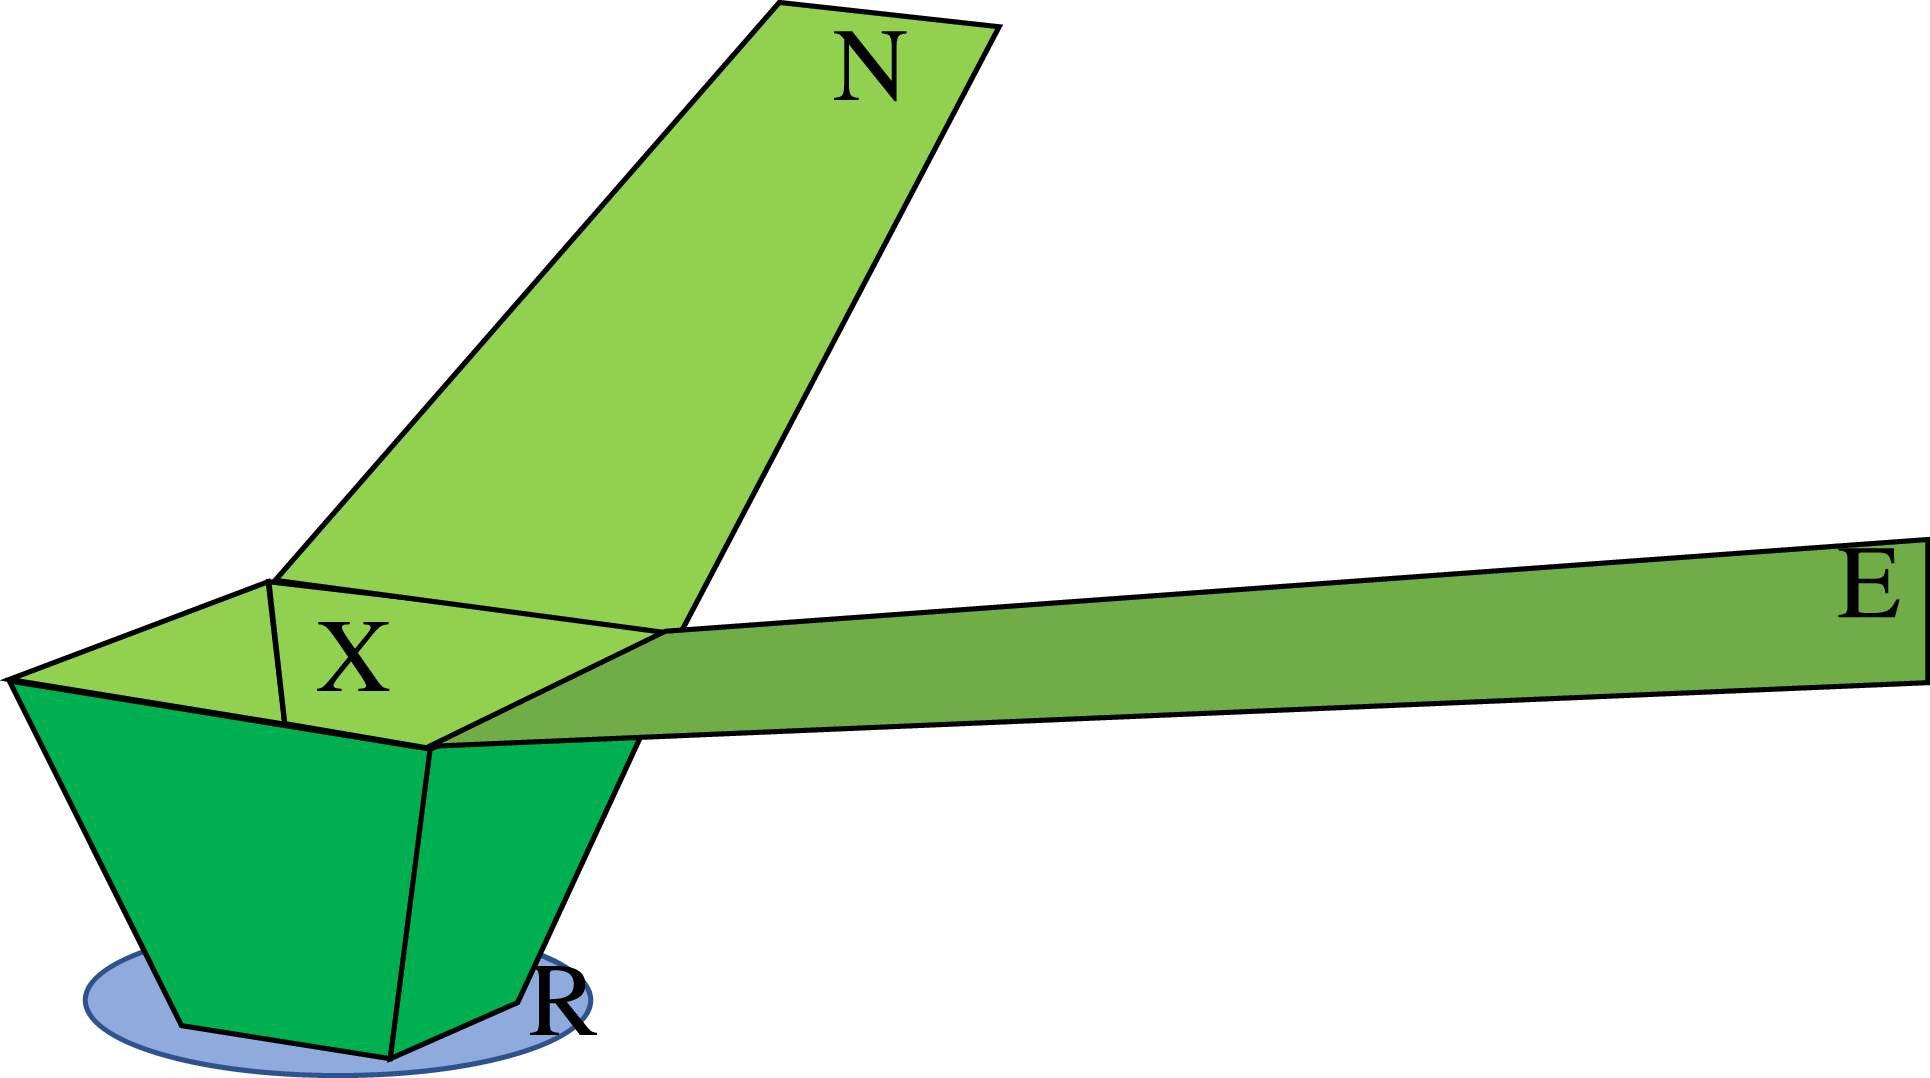
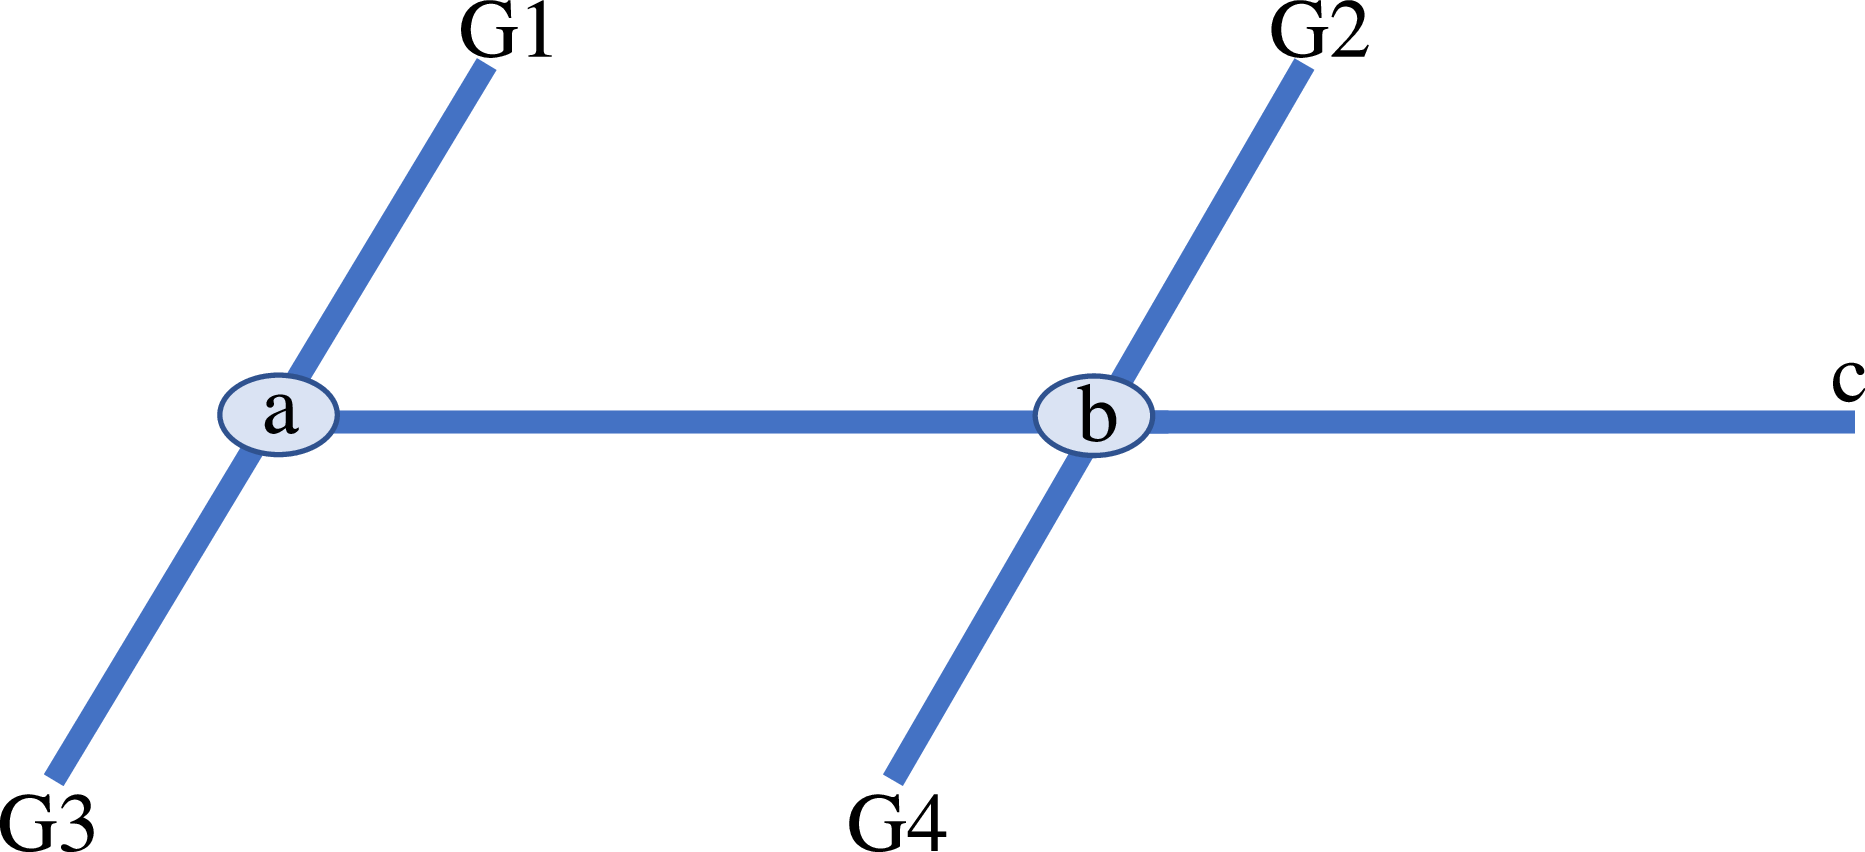
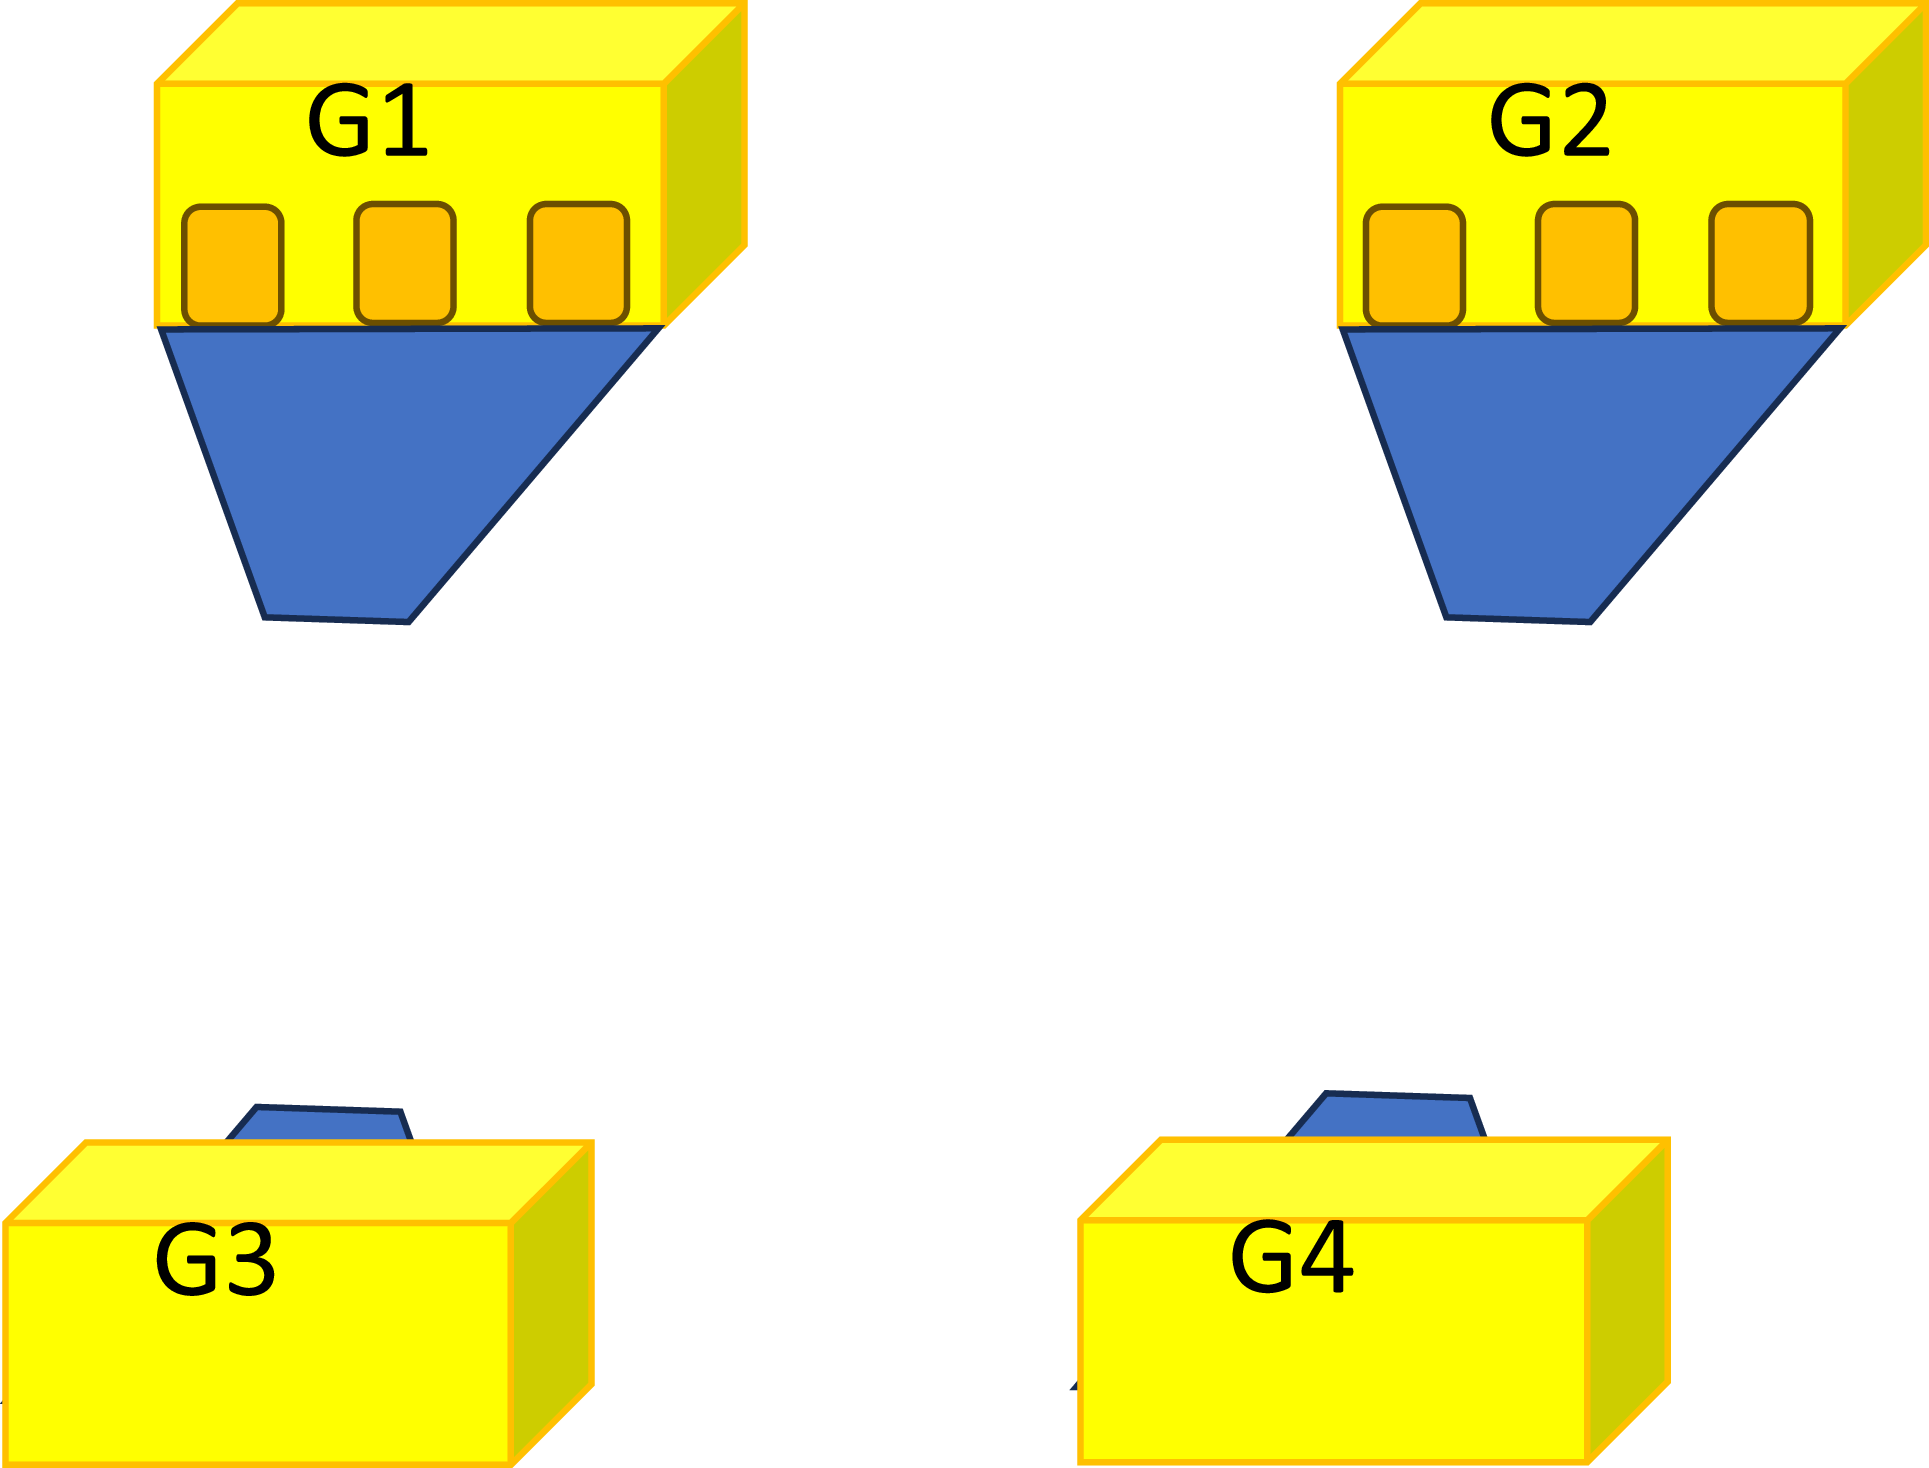
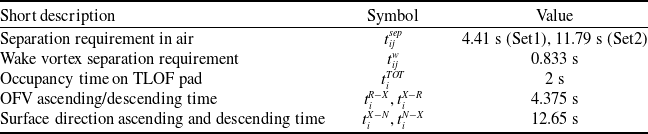
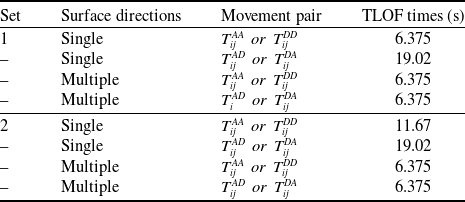

 tiTOT+tiR−X>tijsep

 tiTOT+tiR−X

 TTAT
 TTAT
 TTAT