The onset of industrialization and modern economic growth is perhaps the most important event in modern economic history. It has transformed, and is still transforming, the lives of millions through long-term increase in living standards. In this process, the Habsburg Empire was a latecomer and its success in achieving long-term economic growth was uneven (Gerschenkron 1977; Good and Ma 1999; Schulze 2000). The issue of modern economic growth is particularly relevant for the empire because it has long been connected with its eventual demise at the end of the First World War. We can divide the question of growth and development into three aspects. First, did the empire experience economic growth strong enough to improve the living standards of a large proportion of the population? Second, did growth lead to convergence in living standards within the empire or did it rather increase disparities? Finally, was the growth strong enough so that the Dual Monarchy could hope to catch up with the leaders of the day?
This article tackles these questions by examining newly constructed wage and price series. They provide a homogeneous set of province-specific measures of living standard for each year from 1827 to 1910. They represent the most detailed series for this part of Europe in existence. Overall, the evidence suggests that economic growth, while not spectacular by European standards, began to trickle down to the poorer strata of society in the second half of the nineteenth century when the living standards in the western portion of the empire—but not in the eastern one—increased by about 70 percent between 1850 and 1910.
These new series cover a large part of Europe that had previously been a statistical terra incognita (see the map in Figure 1). Territorially, Austria-Hungary was the second largest country in Europe after Russia and for most of the nineteenth century (until the formation of united Germany) also the second most populous (with 51.4 million inhabitants living on 676.000 km2 in 1910). From Bregenz on the Austrian-Swiss border to Suceava in modern-day Romania, the empire stretched 767 miles, which is equivalent to the aerial distance from the Atlantic coast to St. Louis. Its North-South span of 579 miles is comparable to the distance from St. Louis to New Orleans. It consisted of numerous provinces ranging from the Duchy of Salzburg (with 214.800 inhabitants living on 7,153 km2 in 1910) to Hungary proper (with 13.4 million living on 188.800 km2).Footnote 1 After the First World War, the empire fell apart and a host of new countries emerged. Each had its separate national economy and government statistics. Since many of the new countries’ borders overlapped with provincial borders of the Habsburg era, the nineteenth century data can be linked up to more recent information and provide valuable insights into the long-term development of specific areas as well as the whole region.
CENTRAL EUROPEAN ECONOMIC HISTORY IN A WIDER CONTEXT
The present estimates contribute to a long-standing endeavor in economic history that aims to document the evolution of living standards of workers around the world (Allen 2001; Allen et al. 2011; Lindert and Williamson 1983; Feinstein 1998; Se Yan 2008; Scholliers 1989). Most recently, this effort has been promoted by the Global Price and Income History Project.Footnote 2 The focal point of this research effort is the controversy, raging since the 1840s, over the worker living standards during the Industrial Revolution. Many sources and kinds of evidence have been brought to bear on this question. The evidence for Western-European countries is now extensive, while Central and Eastern European record still has many gaps.
MAP OF THE HABSBURG EMPIRE IN ITS 1914 BORDERS

It is not for lack of trying. At the aggregate level, scholars have assembled statistics on production and employment in agriculture (Sandgruber 1978), estimates of manufacturing and agricultural output (Rudolph 1976; Komlos 1983) and of long-term growth of the Habsburg Empire (Kausel 1979; Schulze 2000). However, the output numbers are not calculated by region/province, beyond the basic split between the two halves of the empire: Cisleithania and Transleithania.Footnote 3 Those works that have produced estimates of GDP by province rarely extend back beyond 1870 because sufficiently detailed data sources are lacking (Good and Ma 1998; Schulze 2007). Moreover, reconstructions of past GDP (and GDP per capita) are fraught with many problems of definition and estimation (especially in the service sector) and are quite demanding in terms of the component data (Guinanne 2009).
For the historical period in question, real wage series are therefore a critical element in measuring the level and growth of welfare. Indeed, they constitute the best available evidence on living standards. Several attempts have been made to assess the price and wage development in the Habsburg Empire. On the price side, Bela von Jankovich's (1923) unweighted index of wholesale prices of various raw materials from 1867 to 1909 was an early but unsatisfactory effort (Good 1974). A. F. Pribram (1938) compiled various prices (up to 1914) and some wages (up to 1800) for Vienna and the Austrian provinces. He did not combine the prices into a price index but his data were later used by Allen (2001) for his Viennese real wage series. Vera Mühlpeck, Roman Sandgruber and Hannelore Woitek (1979) focused on the nineteenth century, constructing a price index for the cities of Vienna, Linz, Graz, and Innsbruck from 1800 to 1914. Only the Viennese price index is a “full index” in that it includes housing, textiles, and other consumption items. For the other cities, the price indices are based solely on foodstuffs. Sandgruber (1982) then used the full Viennese price index to calculate real wages of local masons in the nineteenth century. David Good's (1974) price index runs from 1873 to 1914 but it also pertains only to Vienna and excludes rents. Jiří Matějček (1986) deflated the real wages of Bohemian and Moravian miners with an index that includes only bread and meat. A wealth of nineteenth century price information is available from the Galician cities of Lviv (Lemberg, Lwow) and Krakow (Gorkiewicz 1950; Hoszowski 1934). These data were later used by Allen (2001) for the construction of local welfare ratios.
On the wage side, there has been some effort to look at the cross-sectional pattern in provincial wages reconstructed from the statistics of the government's accident insurance and sickness-insurance administrations (Mesch 1984; Rauchberg 1895).Footnote 4 These data, however, rarely adjust wages for local price variation and they do not produce series of real wages. Matějček (1986) and Jaroslav Purš (1986) strive to capture local variation in prices but they focus exclusively on the Czech lands (Bohemia, Moravia, and Silesia).
The annual province-specific price and wage data presented in this article fill an important gap. In doing so, they circumvent many of the shortcomings of other measures while also extending the data farther back into history.
DATA SOURCES
This section describes the data sources in general terms and assesses their reliability; most of the technical details are relegated to the Appendices. The backbone of the price series consists of two sets of sources. The first of these are the regular annual statistical series published by the Viennese government from 1828 onward and by the Budapest government from 1874 onward. These publications listed the average annual prices (by province in Cisleithania and by county in Transleithania) for grains, legumes, rice, potatoes, beef, wine, beer, hard wood, and soft wood. Most prices were reported consistently through time, although some changes in format and in provincial boundaries did take place. There are also a few cases when the publications change the definition of the reported prices. For example, in the Cisleithanian publications, prices reported after 1881 pertain to provincial capitals as opposed to the provinces generally. Wherever these changes so required, a consistent, continuous price series for each province was reconstructed through interpolation and splicing. Specific details are in the online Appendix 2.
Prices were collected and reported by local authorities who were also entrusted with operating the trading locations in the various towns. The local data were then aggregated into provincial averages by the developing central statistical service which pushed for standardization, regularity and reliability of the collected statistics. Where possible, I cross-checked the quoted prices against other sources, such as newspapers, statistical year books published by certain towns or individual provinces (Prague, Vienna, Budapest, province of Styria, province of Croatia-Slavonia and so on).Footnote 5 The evidence suggests that the local prices within a province were close enough that it makes little difference whether the averages were simple or weighted.Footnote 6 The reported “market average prices” (Markt-Durchschnittspreise) therefore seem to be good indicators of price variation between provinces.
The second crucial source is the work of Mühlpeck, Sandgruber, and Woitek (1979) (henceforth referred to as MSW). Their consumer price indices for four Austrian cities (Vienna, Graz, Linz, and Innsbruck) span 1800–1914 and include 38 different goods. For some of the goods’ prices, they relied on the same official statistics that I use (or a related source) but they also present continuous price series for many staples of household consumption such as sugar, salt, soap, petroleum, and textiles which were not reported (or only very randomly) in the government publications. For five of these items (sugar, salt, soap, petroleum, and textiles), I supplemented my local price indices with the price series from whichever Austrian town was closest to each province. For these items regional variation is thus limited to these four Austrian cities included in MSW's data.Footnote 7 Since all of these five items together represent about 15 percent of the overall budget (see the following section), it is unlikely that this seriously compromises the local nature of the price indices. They were also easy to trade, which further reduces the scope for large price disparities across provinces for these five products.
Apart from these two main sources, I also relied on various local publications. They are listed in Appendix 2. For certain goods in certain periods, prices had to be interpolated. For example, from 1882 to 1893 the statistical publications report wheat, rye, and oat prices only for provincial capitals and not for the province as a whole. One could reasonably expect that the capital would be somewhat more expensive that the countryside and so presuming the capital prices equal to the level in the province in general would overestimate the cost of living in the province. I therefore adjust the capital prices downward, using the average difference between capital and provincial prices in years 1877–1881 and 1894–1898. I used the same method across all provinces and goods.
Of course, shortcomings remain in the series. There is very little information, for example, about the changing quality of goods consumed. This is particularly pressing in case of housing which has always been a very heterogeneous product and which improved considerably during the nineteenth century (in terms of indoor plumbing, construction materials, ventilation and so on). The same applies to clothing whose long-term trend was one of falling prices and—one may surmise—rising quantities and quality. There is very little that can be done about this, beyond assessing various scenarios highlighting how our conclusions depend on changing assumptions about these unobserved influences. Overall, however, the series are both detailed and robust.
CALCULATING THE COST OF LIVING
The consumption basket employed in this article consists of twenty-one items: wheat bread, rye bread, oats, rice, butter, milk, potatoes, peas, beans, lentils, wine, beer, beef, sugar, salt, tobacco, heat (equated with the cheapest source of 1 BTU from among hardwood, softwood, and coal), light (the cheaper of tallow and petroleum), soap, textiles, and rent. This is a basket comparable to that of Charles Feinstein (1998) for British workers, which includes 19 items. It is narrower than the 38 goods included by MSW but nevertheless covers about 80 percent of the expenditures in the MSW basket.Footnote 8 Moreover, many of the additional items in the MSW basket are reasonably close substitutes to some item or other in my basket (for example, pork and beef).
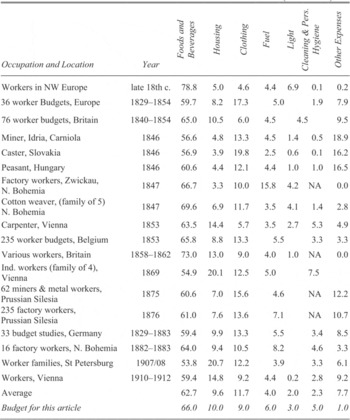
Table 1 provides some information about the changing composition of worker households’ consumption in Europe of the nineteenth century, and thus about the weight each good in the basket should receive.
These are shares of overall expenditures for certain broadly defined consumption categories. Note that some of the reported budgets are based on a sample of one (for example, Le Play's) and their information value, if taken in isolation, is practically zero. But placed in the context of a range of budget studies from the time period, it appears that the budget shares were relatively stable across time and space and even occupation. While the budgets are from around Europe, many of them come from the former Habsburg Empire. They show that the Central-European budgets were similar to those found elsewhere. Food consistently took up over half of worker families’ budgets while textiles and housing hovered around 10 percent (more in large cities, especially St. Petersburg). The unweighted average for the budget shares is shown in the penultimate row. The weights that I use appear at the bottom line of the table.
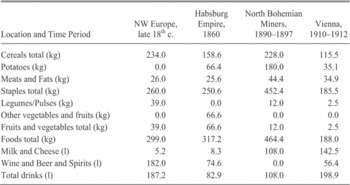
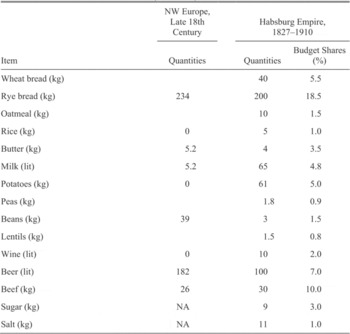
Shares alone are enough to construct a price index for each province but they do not allow us to compare the cost of a given consumption basket across provinces. To do so, I specify the actual absolute quantities of foodstuffs consumed. Such absolute quantities are much harder to come by and they vary more than budget shares both geographically and over time. Table 2 gives a glimpse of this. Clearly, some substitution was taking place across the nineteenth century as new consumption items were introduced and old ones fell out of favor. Moreover, local conditions affected, for example, the consumption of pork vs. beef, wine vs. beer and so on. Practically, I take Allen (2001, 2009) as a point of departure, since my investigation is close in spirit to his. The Allen consumption basket is a good but not a perfect fit for my purposes because it is clearly a premodern one, based on the consumption patterns of North-West European workers in the late 1700s. It does not contain sugar or potatoes or rice (about 10 percent in my budget). But, usefully, underpinning Allen's (2009) consumption values are not only observed consumption patterns but also considerations of necessary caloric and protein intake, which act as a suitable anchor for the values. As can be seen in Table 3, I have enhanced Allen's consumption basket by increasing the cereal consumption and by including sugar and rice. In setting these latter values, I took into consideration the consumption per capita reported in MSW for Viennese workers in 1910–1912. Among beverages, I increased the consumption of milk at the expense of beer and wine. Unfortunately, I do not have any prices for fruits and vegetables other than the pulses reported in Table 3. Although the basket is deficient in this respect, the omission is at most of minor consequence because fruits and vegetables did not usually constitute a large proportion of household budgets. Together, the food quantities in Table 3 represent 66 percent of the budget while the shares of other items are given in the bottom line of Table 1.
BUDGET SHARES OF MAJOR CONSUMPTION GROUPS IN PERCENT (1700s–1912)

Note:
Source for the budgets come (starting from the first line) Allen (2009, tab. 2.1); Gruber (1887); Horrell (1996, tab. 5); Le Play (1879); MGS XVI (1869, p. 55); Purš (1986, p. 86); Feinstein (1998); MSW, tabelle A 9.5; Singer (1885, p. 128); Mironov (2010); MSW.
QUANTITIES OF FOOD CONSUMED

Note:
The 1860 numbers pertain to average per capita consumption calculated from total production and net imports and population. The 1890–1897 numbers came from a study into worker living standards, conducted by the management of a mining company. The 1910–1912 values also come from a survey of working-class households.
Sources:
Allen (2009) for NW Europe, MSW for the Habsburg Empire in 1860 and Vienna, 1910–1912. SAS stands for Severočeská akciová společnost v Mostě (Nordböhmische Kohlen-werks Gesselschaft in Brux), see archival location of the source in References.
Charles Feinstein (1998, p. 634) argues that a “fixed-weight (Laspeyres) index is taken to be the most suitable procedure for measuring long-run changes in workers’ cost of living” and cites Paul David and Peter Solar (1977) in support of this view. His is an arithmetic index which, as Allen (2001, p. 424) and Gregory Clark (2001) point out, implicitly assumes Leontief preferences and allows consumers no room to adjust consumption in reaction to changing prices. A geometric index, i.e., a geometric average of price relatives weighted by fixed consumption shares, implicitly presupposes Cobb-Douglas preferences, which allows the quantity consumed to vary with price. My analysis relies upon a fixed-weight index, following Feinstein (1998), but I calculate it as a geometric average to reflect Allen's and Clark's point. This yields a price index for each province with the years 1898–1902 serving as the base. In order to be able to compare costs of living across provinces, I also calculate cross-sectional price relatives in each province and Vienna in 1898–1902 and I multiply each local provincial index by a geometric average of the cross-sectional price relatives in these five years. In this way, Viennese cost of living in 1898–1902 constitutes the base index value of 100 against which all years and all provinces are compared. Finally, to obtain a “Krone-value” of annual living expenses in each province and year, I multiply the index by the cost of the consumption basket in Vienna in 1898–1902. For example, for Tyrol in 1890, the annual expenditures equal:
![\[
\begin{array}
E_{1890}^{Tyrol} = \left[{\prod\limits_{i = 1}^{21} {\left({\frac{{P_{1890,i}^{Tyrol} }}{{\overline P _{1898 - 1902,i}^{Tyrol} }}} \right)^{w_i } } } \right]\left[{\prod\limits_{i = 1}^{21} {\left({\frac{{\overline P _{1898 - 1902,i}^{Tyrol} }}{{\overline P _{1898 - 1902,i}^{Vienna} }}} \right)^{w_i } } } \right]\left({\sum\limits_{i = 1}^{21} {\overline P _{1898 - 1902,i}^{Vienna} } X_i } \right)
where w_i = \frac{{\overline P _{1898 - 1902,i}^{Vienna} X_i }}{{\sum\limits_{i = 1}^{21} {\overline P _{1898 - 1902,i}^{Vienna} } X_i }}
\end{array}
\](https://static.cambridge.org/binary/version/id/urn:cambridge.org:id:binary-alt:20160715171934-45281-mediumThumb-S0022050713000016_eqnU1.jpg?pub-status=live)
The first term captures the changing price level across time within the province of Tyrol. The second square brackets capture how cheap or expensive Tyrol was relative to Vienna in the base years 1898–1902. The bar above P indicates the prices are averaged across the five years. The last expression is the actual cost in Krone (henceforth K) of the basket of 21 goods (here explicit quantities consumed are specified, Xi) in Vienna in the base years.
CONSUMPTION BASKET (food items)

Notes:
The North-West European basket is based on consumption in Britain and Low Countries. The other two columns represent the food items in the Habsburg basket, used in the cost of living calculations in this article. Together, they represent 66 percent of the total Central-European budget, with the shares of nonfood items cited in the bottom row of Table 1.
Sources:
Allen (2009, p. 36).
To provide a more real life interpretation of the costs of living, the “Krone value” of the consumption basket is calculated for a family of two adults and two children. Following Allen's (2001) practice, I take a child as equivalent to one half of an adult. This is, of course, a simplifying assumption but it happens to be one that was also used by studies in the nineteenth century, thus allowing for ready comparisons with costs of living reported by contemporaries. In a study on the working-class conditions in 1869, the Viennese Chamber of Commerce claimed that miners in Lower Austria (outside Vienna) considered an income between 800 and 1,000 K as necessary for an annual upkeep of a family of four.Footnote 9 Families of Viennese machinery workers required 1,200 K and clockmakers asked for 1,000 to 1,080 K (Handels- und Gewerbekammer Wien 1870, pp. 4, 8, 11). In comparison with these, my calculations put the cost of living for a four-piece family in Vienna at 958 K and in the surrounding province, Lower Austria, at 877 K. A contemporaneous report from the Prague Chamber of Commerce estimated the budget of a four-member family of a machinery worker as somewhere between 900 and 1,000 K with the figure falling to as low as 600 K in the countryside around Prague. My index puts Bohemia's cost of living in 1869 at 854 K. All in all, my calculations are the right order of magnitude.
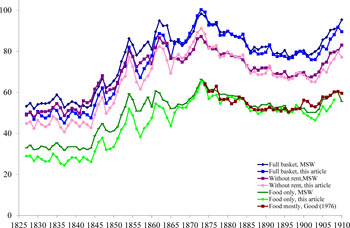
COMPARISON OF PRICE INDICES – VIENNA

Figure 2 compares the new price index with MSW's and David F. Good's for Vienna. Good's (1976) index only spans 1874–1913 and omits housing and clothing (but includes coal, the only nonfood item among the twenty goods in the consumption basket). The series are visibly highly correlated.Footnote 10 Note that leaving out housing or other goods does not much change the overall direction of the price developments (although it obviously changes the total dollar-value of the consumption basket). In the post-1873 period, the three indices never differ by more than a few percentage points. Prior to 1860, the gap is greater for several reasons. First, the geometric average generates lower values for my index in the early part of the period relative to MSW's arithmetic average. Second, MSW use weights from the end of the period, relying on 1910–1912 Viennese workers’ household budgets. These grant disproportionate weight to goods that had considerably declined in price and increased in consumption (such as textiles), making the past price levels relatively higher. My consumption basket is closer to the consumption pattern in the middle of the nineteenth century. Finally, there is the difference in the overall composition of the basket where MSW include 39 goods compared to 21 in my index.
All provinces by and large shared the same trajectory even as actual price levels varied from one province to the next.Footnote 11 In the early 1830s the difference between the cheapest province and the most expensive province amounted to about 300 K. By 1914 this difference was still about 300 K but the prices have more than doubled in the meantime. The general shape of the prices index across time is not very sensitive to changes in individual consumption weights: the index is a weighted average of 21 items, so any one item has only limited impact on the overall value.Footnote 12 For example, it is quite possible that maritime provinces gave a greater weight in their diet to fish as opposed to other meats. But beef (the only meat in my basket) accounts for 11 percent of the present budget, so replacing even half of beef with fish would only affect 5.5 percent of the consumption basket and the impact would be limited to the price differential between beef and fish. So, if fish were, say, 20 percent more expensive than beef, the overall index would be higher by about 1.20.055 ≈ 1 percent. To give another example, Dalmatia is the only province where wine was consistently cheaper than beer—by a factor of two or even three, so one could reasonably expect that Dalmatian drink consumption would be heavily leaning towards wine, relative to other provinces. Still, if the Dalmatian weights on wine and beer were 7 percent and 2 percent instead of the 2 percent and 7 percent in the current baseline basket, the overall index would decline by about 3.4–4.4 percent. Of course, if several changes were made all in the direction of a cheaper substitute, (i.e., replacing wheat bread with rye bread and oatmeal, beer with wine, sugar and tobacco with nothing, and so on), then the overall impact could add up to 15–20 percent lower cost of living. But then we would be dealing with a substantially different consumption basket and the comparability across provinces (if each province had a markedly different consumption mix) would be lost.
The impact of varying the consumption basket would be further limited by the ongoing convergence in prices of many relevant products. As measured by the coefficient of variation (COV), some 41 percent of the consumption bundle consisted of goods which recorded considerable price convergence over the nineteenth century. The COV of wheat, for example, declined from about 0.3 in late 1820s to 0.1 before the First World War. For beef and wood, the decline was from 0.4 to 0.15. Together, these goods exerted a strong influence towards a parallel movement in price levels across provinces. It is not surprising that convergence was characteristic for goods that were easily tradable and also traded. The remaining 59 percent were items whose prices were not necessarily converging but they were not diverging either. They represented nontradables, goods which could spoil, or goods controlled by government monopoly (housing, legumes, tobacco, and so on) The trend was therefore towards convergence in the costs of living, as evidenced by the declining COV of the costs of the full basket from 0.25 in 1827 to 0.08 in 1910. Given that the overall track record of the period is one of rising prices (albeit with some periods of deflation), the convergence consisted mostly of low-cost areas catching up with the higher prices of places such as Vienna, Littoral, Salzburg, and Bohemia.
NOMINAL WAGES
The same administrative chain of command that collected and reported the commodity prices also reported wages. Let us consider in some detail the nature (and the trustworthiness) of these data. The Tafeln zur Statistik der Oesterreichischen Monarchie (TSOM), published from 1828 to 1865, and the Statistisches Jahrbuch der Oesterreichischen Monarchie (SJOM, 1862–1881) called it “Gerinster Taglohn,” the “meagrest day wage,” until 1880 when it switched to calling it just day wage, “Taglohn.” Other sources, such as the Bohemian Gubernial Decree of December 18, 1852 asked for a range (“Day wage of a regular day laborer from—to in Conventional currency”), while the Handbook of Public Administration had the local authorities report “der mittlere Taglohn,” that is, “middle day wage” (presumably middle of the range) which was to be sent to provincial governors and then on to the Statistical Commission (Mayrhofer 1895, p. 317).
Aggravating the confusion was the fact that none of the legal documents specified the sector or occupation to which the day wage was supposed to pertain (beyond the “regular day laborer”—”gewöhnlicher Taglöhner”—in the 1852 decree cited above).Footnote 13 The omission of the sectoral specification may have been deliberate: the stated purpose of the wage collection was to get a pulse on the local labor market, whatever the main local sector may have been. The day laborers had no particular skill and were not bound to any particular sector which made their wage rates well-suited for comparisons across provinces, whatever the sectoral composition of the local labor force (Handels- und Gewerbe-Kammer Wien, 1870, p. 215).Footnote 14 Such motivation was later made explicit in section 7 of the 1888 law on sickness insurance which required each district to consult representatives of local employers and employees to establish the “usual day wage of a regular insured worker.” This was then used to calculate the sickness compensations for forgone wages.Footnote 15 These ambiguities notwithstanding, the preeminence of agriculture in the Austro-Hungarian economy and the fact that most reports came from small towns with strong agricultural hinterlands suggest that the reported wages were primarily those of agricultural laborers. As late as 1880, the only province (excepting Lower Austria which includes Vienna) with more than half of the population working outside agriculture was Bohemia, and even there the agricultural sector employed 47.4 percent (Sandgruber 1978, p. 222). The “regular worker” was therefore most likely a farm hand of some sort. Some statistics even say as much.Footnote 16
COMPARISON OF WAGE RATES IN 1856 IN GULDEN (fl) OF CONVENTIONAL CURRENCY (C.M.) (decimalized)

Needless to say, even as these statistics were published, there was no shortage of critics demanding wage data of better quality and higher precision. They complained, for example, that the local authorities were given too much leeway in calling the local wage rate (Rauchberg 1895; Handels- und Gewerbe-kammer Reichenberg 1891). By late nineteenth century, these criticisms had led to changes in wage reporting and to some specialized detailed wage studies (Inama-Sternegg 1893). These other sources provide independent data and allow us to cross-check the day wages reported in annual publications Specifically, I compare my day wages with three such independent sources: tax data from 1856, Agriculture Ministry's data from late nineteenth century and Chamber of Commerce data from 1851, 1869, and 1888.
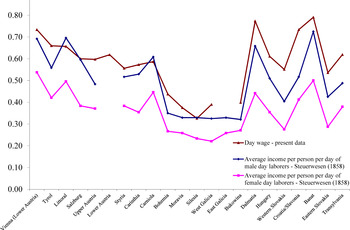
Figure 3 is a cross-section which compares the wage rate from TSOM for the year 1856 with income per capita per day in individual provinces from the Tafeln zur Statistik der Steuerwesens (1858), a government report that evaluated a proposed tax reform. The report depended on tax officials to collect 1856 income data for various groups of population (factory workers, domestics, craftsmen, and, importantly, day laborers). Compared to the reported “Geringster Taglohn” in the 1856 edition of the annual statistical yearbook, the tax data produce a very similar cross-sectional pattern. The higher values of the wage rate relative to the calculated average day income can be explained by local variation in the actual days worked (which the 1858 tax study by and large assumed to be the same across the board).
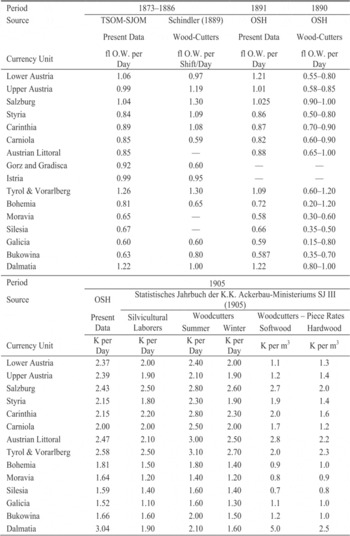
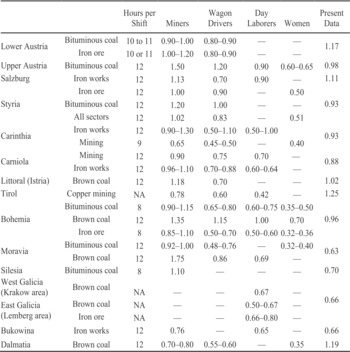
A similar picture emerges from Tables 4 and 5 which report the wage rates in the broader skill and sectoral cross-section. They present provincial level wages from forestry and mining. The mining and forestry wage rates were collected from private and public enterprises by the Agriculture Ministry, an administrative branch separate from the statistical office. Two important features emerge. One is that, just like with the tax study data, the cross-sections seem to be in broad agreement: the Austrian provinces reported high nominal wages with Bohemia, Moravia and Silesia falling somewhat below and Galicia and Bukowina at the very low end. Dalmatia shows high nominal wages in forestry but low ones in mining. At the same time, the comparison of wages across occupations in mining shows that the wages reported in the annual yearbooks are closest to those of plain laborers in mining (after adjusting for the duration of a shift). In forestry, they are closest to the shift rates.
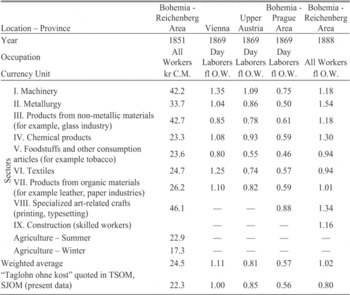
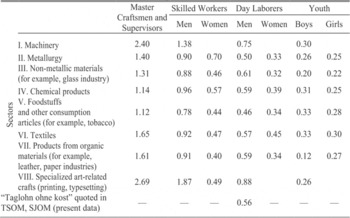
Tables 6 and 7 depict more detailed differences between industrial sectors. These wages come from Chambers of Commerce reports. The chambers occasionally collected their own data, usually through questionnaires sent to factory owners or to craft organizations. Such was the case, for example, in 1869 when the Trade Ministry asked the various Chambers of Commerce to carry out a survey of industrial wages in their jurisdiction. The results of several of these studies, primarily from Lower Austria and from Bohemia are in Table 6. Here the “Taglohn ohne Kost” (day wage without meal) reported in the official statistics that underlie the present analysis are fairly close to the overall average, weighted by number of observations, across sectors. Perhaps the only exception in Table 6 is the 1888 average from the area serviced by the Reichenberg (Liberec) Chamber of Commerce whose report combined all workers in its calculations, without any skill or age differentiation, and therefore introduced an upward bias to the averages. For the area of the Prague Chamber of Commerce, Table 7 provides an overview of 1869 wage rates both across sectors and across skills and gender. Again, the “Taglohn ohne Kost” reported in the annual statistics for Bohemia in 1869 (shown in the bottom line of the table) best corresponds to the wage rate of male day laborers.
WORKERS IN FORESTRY AND THEIR WAGES

Note:
TSOM stands for Tafeln zur Statistik der Oesterreichischen Monarchie, SJOM stands for Statitisches Jahrbuch der Oesterreichischen Monarchie, OSH stands for Oesterreichische Statistisches Handbuch. The day workers in forestry were often seasonal (October to March). fl. O.W. stands for gulden of Austrian currency.
Each of these comparisons is, of course, piecemeal. None of these alternative sources, be it the Agriculture Ministry, the tax administration or the Chambers of Commerce, provided wage data on a regular annual basis for each province (unlike the statistical publications). For this reason, they could not be used as a backbone for the provincial wage series. But in those years and those sectors where such independent data are available, the confrontation of independent sources suggests a record of fairly high degree of internal consistency. While the official publications, TSOM and SJOM, provided insufficient description of the wage rates they were reporting, the corroboration of these data with the other sources shows that these were consistently closest to wage rates of male day laborers. The sector of employment may differ from province to province depending on the local economic structure—but for day laborers who are not tied to any particular sector by their skills this does not make much difference.
WAGES AND ECONOMIC DEVELOPMENT IN THE HABSBURG EMPIRE
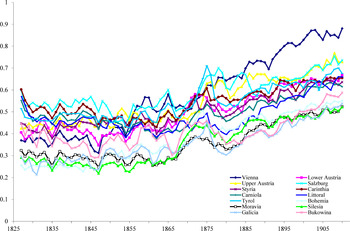
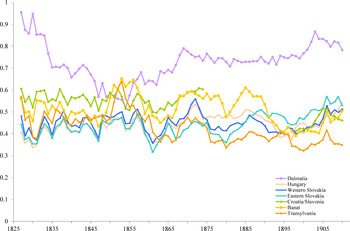
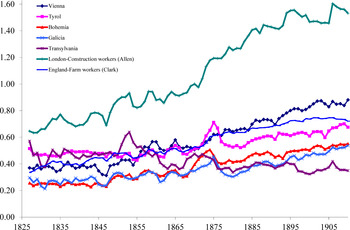
Prices and nominal wages are the building blocks for the analysis of real wages and living standards. Figures 4A and 4B show changes in standards of living (as measured by welfare ratios) throughout the relevant period in the eastern and western parts of the empire. It is immediately obvious the two halves of the monarchy had very different growth records. The western regions enjoyed from the 1850s a slow but continuous growth; in contrast, the eastern and south-eastern provinces were at best stagnant (some even saw a mild decline) in standards of living.
Let us consider Cisleithania first. In the late 1820s one could perhaps discern three blocs. One consisted of the South-Western provinces of Carniola, Carinthia, Littoral, and Tyrol. Their welfare ratios initially stood between 0.5 and 0.6, but starting with a recession in 1827–1830, they set on a path of slow decline which was not reversed until the 1850s. Then there were the Alpine provinces of Upper and Lower Austria, Salzburg, and Styria. Their standards of living stagnated during the first three decades, with welfare ratios in the 0.35–0.45 range. Finally, there were the northern Slavic provinces of Bohemia, Moravia, Silesia, and Galicia which were also stagnant but their welfare ratios were a cut below the Alpine values, at 0.25–0.33. Clearly, this was a very meager existence.Footnote 17 Prior to about 1855, all of these western provinces experienced the same business cycle, as evidenced by the downturns of 1835 and 1847, but overall showed no progress in living standards for the day laborer. From the mid-1850s on, however, they all shared in a slow but continuous growth so that by 1910, living standards had grown by 70 percent on average and almost doubled in some areas (such as Bohemia).
WAGE RATES PER SHIFT IN MINING AND METALLURGY IN 1874 IN FL. O.W.

Source:
Der Bergwerks-Betrieb Oesterreichs (1874), Galician mining wages were not specified by occupation.
AVERAGE DAY WAGE RATES BY SECTOR

Note:
“kr. C.M.” stands for kreuzers of Conventional currency (in circulation before 1857), “fl. O.W.” means gulden of Austrian currency (in circulation in 1858–1899).
Source:
Die Arbeits- und Lohnverhaltnisse (1870); Bericht uber die materielle Lage (1852); SOA Praha archive – OZK Praha.
AVERAGE DAY WAGES REPORTED IN INDUSTRIAL SECTORS OF THE PRAGUE CHAMBER OF COMMERCE IN 1869 (fl per day)

Note:
Archival data; the last row is from the present sample for comparison's sake – Bohemian Taglohn for 1869.
Meanwhile, the Transleithanian provinces went through periodic upswings such as in the mid-to-late 1860s and again in early 1880s but never launched on a path of sustained growth in living standards. Note that early in the period, their welfare ratios actually stood at relatively high values, between 0.4 and 0.6.Footnote 18 The eastern provinces at first offered better living standards to the day laborers than many of the lands in the west. This was largely due to the relatively low prices of foodstuffs in the east. By late nineteenth century, however, the eastern provinces were almost all overtaken by the growth in the west.
All this bears directly on a long-standing problem in the research on Habsburg economic history, that of the long-term economic performance of the empire. The opinion has varied in historiography from Alexander Gerschenkron's (1977) relatively pessimistic assessment of an economy, which never quite took off, to a more optimistic view by Good (1983) who argued that modern economic growth had been present already in the 1820s to Schulze's (2000, p. 328) view that, at least as far as late nineteenth-century economic growth was concerned, it was nothing spectacular, with the western provinces growing slower than the eastern ones whose growth, in turn, “ranked about mid-range in the European growth comparison.” Anton Kausel (1979, Table 11), on the other hand, argued that in 1870–1913 the whole Habsburg monarchy was growing faster than any other European country bar Germany, Sweden, and Denmark. Our wage data offer a new point of entry into this important question.
WELFARE RATIOS – CISLEITHANIA, 1827–1910

WELFARE RATIOS – TRANSLEITHANIA AND DALMATIA

COMPARING REAL WAGES AND GDP PER CAPITA

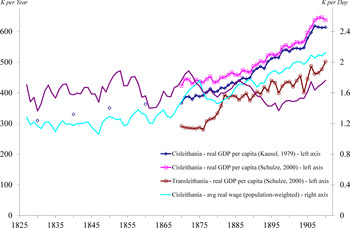
Figure 5 juxtaposes Schulze's and Kausel's estimates against my population-weighted average real wage in Cisleithania and Transleithania. There is no strong a priori theoretical reason why GDP per capita should always correlate with the wages of day laborers. Indeed, day laborers earn few returns from skills, and none from capital or land. Their wages will reflect the evolution of aggregate income only if payment shares to factors (land, labor, and capital) are constant and the wage distribution is stable. Nevertheless, if economic growth is driven by productivity-enhancing technological change, it can be expected to increase the marginal product (and hence the price) of labor and to trickle down to improve the living standards of the population at large. The comparison between real wages and the real GDP per capita shows that they were highly correlated for the Cisleithanian provinces from 1870 onward but not for the Transleithanian ones. Prior to 1870 Kausel's (1979) scattered GDP estimates in 1830, 1840, 1850, and 1860 suggest a divergence between wages and GDP per capita even in the West, with an upward trend in income per capita unfolding alongside stagnant real wages.
While it is beyond the scope of this work to do more than speculate on the causes of the diverging records of real wage growth and GDP growth, a natural step would be to look at distributional issues. In the west, it seems that the economic growth eventually did trickle down all the way to common laborers and all social strata saw their fortunes improve. The eastern situation was somewhat different. Economic historians, from Oszkar Jaszi (1929) through Ivan Berend and György Ranki (1974) to Good (1983), report that the second half of the nineteenth century was a time of increased concentration of land ownership in Hungary, to the point that a bimodal distribution emerged with large-scale aristocratic estates at the top and small subsistence-size plots at the bottom (Brusatti et al. 1973, p. 490). Such a shift could reconcile the Transleithanian real wage and GDP records if consolidation of land ownership among aristocrats led to economies of scale and productivity growth through the introduction of new machinery as a substitute for farm labor. In this case, output could have grown while agricultural wages fell.
At any rate, there was a small-scale “reversal of fortunes” taking place within the Habsburg Empire during the nineteenth century. Those provinces, such as Bohemia, Moravia, Silesia Galicia, and Bukowina, which had started from very modest beginnings, pulled themselves up considerably by 1910, overtaking the bucolic farming regions of Hungary, Banat, and Transylvania. Part of the reversal was likely due to the ongoing industrialization in the west, especially in the Czech lands. Already in 1841, Bohemia was home to 59 percent of all of the empire's cotton weaving and 73 percent of calico printing, while Moravia contained 53 percent of all woolen textiles (Good 1984). Bohemia and Silesia were also rich in coal and close to German markets. Prior to, say, 1850, these fledgling industrial sectors were still relatively young and small to make much difference but their importance grew and with it also their impact on the labor market, including the agricultural labor market (through migration and urbanization). Still, the industry cannot be the whole story because rising real wage was also observed in Galicia and Bukowina, provinces as agricultural as any in the east.
The East-West dichotomy produced also different records in terms of convergence (σ-convergence, more specifically) of living standards. The empire saw no convergence in living standards after 1850 as a whole. Cisleithania, however, clearly saw a decline in the coefficient of variation among its provinces especially after 1880. In Transleithania, however, the initial disparities between provinces persisted throughout the period. The contrast confirms that the Dual Monarchy had been dual economically long before it became so officially (in 1867).
This brings us to another issue in Habsburg economic history and another candidate explanation for the east-west split: institutional divergence. Scholars have argued that the 1848 revolution and the divergent institutional reforms that followed set the two regions on different paths. Note that the growth record in the two parts was not that different in the first half of the nineteenth century. Prior to the work of John Komlos (1983), the prevailing view was that the year 1848 was a watershed: it led to the final abolition of corveé (or robota in local parlance) throughout the empire and it ushered in a set of reforms over the next decade. These included abolition of all internal tariffs (1850), privatization of railroads (1854), currency reform (1857), new Commercial Code (1859), and redrawing of the empire's administrative divisions (1852–1856). Komlos (1983) argued forcefully that the 1848 fallout was overrated because he found no break in the trends of the available output series around 1848. The real wage series in Figures 4A and 4B bring new evidence to the question: as mentioned before, while we do not see a clear break in trend in 1849, there clearly emerges an upward trend in the west by 1860 at the latest.
Could the post-1848 reforms have been the cause of the onset of growth from mid-1850s on? Clearly, we would not expect an immediate change in aggregate output. The initial 1848 law that did away with the corvee and the last vestiges of feudal land ownership was not properly implemented until 1853. If there were productivity gains to be reaped from such a change, one would expect that they would not materialize in 1849 but rather after 1853. As it happens, the western provinces, where wage growth most clearly begins after 1853, are also those where serfdom had been most entrenched: Bohemia, Moravia, Silesia, and Galicia. In the Transleithanian provinces, the absence of any response in level or growth rate of real wages likely stems from the fact that some reforms had already been enacted by the Hungarian diet some time before as part of the Reform era (1825–1848), so the empire-wide abolition probably had only a limited impact.
The institutional aspect of land ownership and agricultural labor market may affect wages in more subtle ways as is amply illustrated by the odd outlier in Figure 4B, Dalmatia. By any benchmark, Dalmatia was a poor, underdeveloped province. The first steam engine only arrived there in 1863.Footnote 19 The census of 1890 found only 3.4 percent of its workforce employed in industry. Labor productivity was considered low (Petter 1857). Literacy among population above 6 years of age stood at 23.1 percent for men and 9.3 percent for women (compared to the Cisleithanian values of 68.5 percent and 62.6 percent). Given all this, contemporary opinion explained the high Dalmatian wage rates as a result of underdeveloped, fractured labor market. Heinrich Rauchberg (1895, p. 128) argued, for example, that the reported nominal wages were misleading in Dalmatia and Istria, two areas of low development, because most of the local population were paid in kind and the data on market wages were generated in the tiny sliver of the labor market that was monetized and that pertained to specialized and/or seasonal workers. Carl Theodor Inama-Sternegg (1895) showed that day laborers in Dalmatia and Istria made up generally less than 1 percent of agricultural labor market.Footnote 20 Most of the agricultural labor force around the Adriatic consisted of either smallholders or sharecroppers (“mezzadros” in local parlance). This suggests a fairly static, immobile agricultural labor force and a correspondingly shallow labor market. One may have then observed next to no day wage quotations for most of the year as all labor was tied in long-term contracts or sharecropping arrangements and then a sudden flurry of high wage rates during short, labor-intensive periods, such as during harvests, as local labor demand ran into highly constrained local labor supply. Such features would also explain the frequent remarks about the local shortage of labor (Schmidle 1842; Petter 1857; Rauchberg 1895).
It is possible that, early on in the period, similar institutional features inhibited labor market mobility in some of the eastern provinces, for example, Croatia, Hungary, Banat, or Transylvania, producing relatively high wages for agricultural laborers there. Then gradually, as the economy monetized, as institutional obstacles to mobility weakened and as the pressure of consolidation of land ownership mentioned earlier turned some farmers into day laborers, the agricultural market grew ever deeper and also more abundant in the supply of agricultural laborers. An explanation of this kind would actually imply that the stagnant real wages of eastern day laborers may in fact hide a much bigger decline for at least some of the peasants who saw their situation deteriorate as the unfolding economic forces pushed them down the social ladder from smallholders to day laborers.
WELFARE RATIOS – FULL BASKET

A final important issue is whether the Habsburg Empire was catching up or falling behind the rest of Europe during its last decades of existence. Figure 6 offers a comparison of real wages in a selection of Habsburg provinces with England.Footnote 21 The graph depicts the ratio between a worker's estimated annual earnings and the cost of a full basket of goods (as defined in Tables 1–3) in the Habsburg Empire and in England.Footnote 22 Prices come from Clark (2010). Two wage series from England are used: Clark's (2001) for farm workers and Allen's (2001) for construction laborers in London. Annual earnings are estimated as day wage multiplied by 250 work days per year.Footnote 23 The total cost of living is estimated, following Allen (2001), as the sum total (in local currency) that would be necessary to feed a family of two adults and two children (see note under Figures 4A and 4B).
Not surprisingly, the English farm workers were, by and large, better off than those in the Habsburg Empire for most of the period. The exceptions are the 1830s and 1840s when relatively high costs of living produced low welfare ratios for the English farm workers. But even then the English countryside offered real wages comparable to those paid in Vienna and not too far from those paid in Tyrol. After 1850 only the highest-paying Habsburg provinces could keep pace with the situation in England and from the late 1870s, only Viennese workers were getting a better deal than English farm workers. Provinces such as Bohemia and Galicia fall consistently behind England by about 50 percent and this gap, if anything, widens with time.
The urban labor market of Vienna should, however, more appropriately be compared with the urban construction wages in London. The welfare ratios, computed from Allen's (2001) construction laborers’ wages, are consistently higher than in any Habsburg province and by a considerable margin which is a result to be expected: Britain was the leading economic power through most of the nineteenth century while the Habsburg Empire was decidedly a laggard. The graph shows that the gap between London and Vienna was quite sizeable: in 1845 Viennese wage rates were less than half of what London was paying and even as late as 1895, the gap was still 100 percent. Expressed another way, the Viennese workers were always at least 40 years behind their London counterparts in terms of their real wage.
Overall, the real wage series produce four main findings. First, living standards in the Habsburg Empire did not begin to rise until the second half of the nineteenth century. Second, growth in wages led to only limited convergence in living standards and may have in fact increased the gap between the two halves of the Dual Monarchy. Third, wage growth was insufficient to close the gap with the economic leader of the times, Great Britain. Fourth, the farther east one goes, the trickier the interpretation of real wages is because of the potentially complex issues of labor market institutions. The last point is most amply illustrated by the Dalmatian case but is not limited to it.
CONCLUSIONS
The economic development of the Habsburg Empire has been a subject of intense debate ever since its demise. Oszkar Jaszi (1929) argued that the economy had the potential to be a strong integrating force. Conversely Alan J. P. Taylor (1948) saw the union of all these lands and kingdoms under one scepter as an historical accident without any common economic interests. Good (1984) was quite optimistic about the realm's economic record, speaking of its “economic rise,” while Schulze (2000) is much more skeptical.
The present series of prices and wages are an important addition to the existing data on the nineteenth-century economic development in this corner of Europe. They reveal a record of stagnation in the first half of the nineteenth century, followed by a more consistent growth in living standards in the second half. The evidence suggests, however, that the growth was uneven and mostly limited to the western, Cisleithanian provinces. In fact, some parts of the monarchy, especially in the South-East, saw their living standards decline in absolute terms over the course of the period. It is tempting to speculate that this economic development in the Balkans contributed to the intractable ethnic strife which dogged the Habsburg Empire in its last years and which eventually served as the powder keg for the First World War. Apart from failing to produce convergence internally, the growth record also suggests little convergence onto the rising West European living standard, in particular that in Great Britain. It confirms the long-standing depiction of the Danubian Monarchy as a relatively backward state that, unlike Germany, could not close the gap.
One of the important avenues for future research will be looking into the institutional underpinnings of local labor markets and supplanting the simple day laborer wage with more information about the extent of income inequality in various provinces. The institutional aspect will be particularly important in explaining not only the stagnation in Transleithania but also in addressing some of the conspicuous surprises in the record. Perhaps the most intriguing ones are the relatively low real wages of the early industrializers, like Bohemia and Moravia, and the rather high real wages observed—at least at the beginning of the period—in many Southern provinces, like Dalmatia and Croatia. It remains to be seen whether future research will corroborate or correct these findings.
This article was written with the support of the Economic History Association's Arthur H. Cole Grant-In-Aid awarded in Spring 2010. Outstanding research assistance was provided by Jacob Burgdorf, Jan Andre Graumann, Mila Kashcheeva, Alexander Klein, Michael Feng, Ondřej Flanderka, and Shyam Menon. I also thank Robert Allen, Jeremy Atack, Jorg Baten, Howard Bodenhorn, Greg Clark, Ulrich Pfister, Matthias Morys, Max-Stephan Schulze, Paul Hohenberg, three anonymous referees, and many others for their aid and helpful suggestions. I also thank Lawrence Page and Sergey Brin for kindly granting me access, through their website, to many rare and valuable historical documents. All errors are mine.
Appendix 1 Geography and Sources and Their Abbreviations
Spatial Definitions: “Western” and “Cisleithanian” denote provinces ruled from Vienna after 1867; similarly, “eastern” and “Transleithanian” denote all regions and territories ruled from Budapest.
Spatial Consistency: Provincial borders did change somewhat overtime. In 1849 Salzburg province was carved out of Upper Austria. Moravia separated from Silesia, Carinthia split from Carniola, and Galicia from Bukowina. Until then, official statistics quote only one average provincial price (for each good) in each merged entity. To solve this problem, I assume that the prices reported reflect the price in the larger of the two entities. Namely, given that Upper Austria was five times larger than Salzburg in terms of population, I take the price quote to reflect, by and large, the Upper Austrian price levels. After 1849 Salzburg province had its own statistics and the prices turn out to be about 10 to 20 percent higher than in Upper Austria. I therefore estimate the pre-1849 Salzburg prices by marking up the pre-1849 Upper Austrian prices by whatever was the price differential for each good in 1849–1854. Vorarlberg, a tiny province at the far-western end of the monarchy, is always subsumed under Tyrol in the statistics, so no separate price or wage series are available for this province. Fortunately, even though the layout of statistical reporting changed through time, the borders of individual component provinces did not change and so the various provincial names consistently refer to the same territories throughout the period.
In the East, the situation was geographically more complicated but statistically simple. To begin with, the three basic units were the Kingdom of Hungary, Transylvania (Siebenbürgen, Erdély), and Croatia-Slavonia. In 1849 the Habsburgs also created a new province, Serbian Voivodina and Temeser Banat (or Banat for short), in the south of Hungary (around the city of Timisoara in modern-day Romania). Soon after the Hungarians gained autonomy in 1867, they abolished the province again (as they did with Transylvania) but since their published statistics provide ample geographic detail for most of the period, it is still possible to reconstruct local prices in what used to be Banat and Transylvania. At the same time, the southern border of the monarchy was guarded by a long, centerless, amorphous strip of land called the Military frontier (Militärgrenze), an anachronistic outgrowth of Austro-Turkish Wars of seventeenth and eighteenth centuries, which was ruled directly from Vienna and which was demilitarized and incorporated into Croatia and Banat in the 1870s and early the 1880s. This clearly constitutes a change in provincial borders. The disadvantage is that the definition of Croatia and Banat changed through time but on the plus side, the tight grip of Vienna on the Military frontier ensured that a full slate of statistics from this area was regularly published even in times when the Transleithanian price record grew thin due to revolution, war, or civil disobedience on the part of the Hungarians (as it did in late 1840s and throughout the 1860s). I therefore use the Military frontier prices to interpolate Croatian and Banat prices in times when those are missing.
Moreover, modern-day Slovakia never constituted a separate province within the Kingdom of Hungary (even though the current Slovak-Hungarian borders do largely follow the sometime borders of smaller administrative units, the Comitats/Varmegye) and so no province-level prices appear in any of the statistics for the regions I call Eastern Slovakia and Western Slovakia. Overall, the region I denote Eastern Slovakia includes Comitats Abauj-Torna, Gömör-Kishont, Szépes, Saros, Zemplén, and the City of Kosice/Kassa. Western Slovakia includes Comitats Pozsóny, Nyitra, Trencsén, Arva, Turocz, Liptó, Zolyom, Nograd, Hont and Bars. For those areas, the data consist of prices quoted for “Hungary” prior to 1874 and of prices primarily in Nitra (Neutra, Nyitra) and Banska Bystrica (Neusohl, Beszterczebánya) (with a little help from prices from Bratislava-Pressburg-Pozsóny) in the Western Slovakia and in Košice (Kaschau, Kassa) in Eastern Slovakia after 1874.
Official Statistical Publications: Regular annual statistical series were published in Vienna starting in 1828 and in Budapest after 1874. Most of the prices were reported consistently through time, although some changes in format did take place. Occasionally, some prices, such as those of legumes, rice, beverages, and wood were missing and had to be interpolated from neighboring provinces and years. New items, such as flour, butter, sugar, petroleum, and others appeared only after 1900. There are also a few cases when the publications changed the definition of the reported prices. For example, in the Cisleithanian publications, from 1881 onward the prices are reported as pertaining to provincial capitals as opposed to the provinces generally. Similarly, the statistics published in Budapest switched from reporting the prices in each county to just reporting prices in the eleven most important cities (later extended to nineteen cities). Wherever these changes so required, the consistent, continuous price series for each province were reconstructed through interpolation and splicing (see the online Appendix 2).
Prices were reported as annual averages of prevailing market prices. The data were collected by local authorities who were also entrusted with operating the trading locations in the various towns. This practice had already become well-established by early nineteenth century, so that the occasionally published statistical retrospectives (such as those that appeared in connection with the proposed tax reforms in 1858 and 1859) could, for example, carry standardized and continuous provincial prices for cereals going back to the 1770s. Price collection was also subject to continuous legislative attention.Footnote 24 An important role was played by the developing central statistical service (in existence since 1829 but formally established into a separate government agency in 1863) which pushed for standardization, regularity, and reliability of the collected statistics. Since the local authorities were the original source of the price data, the province-level values for individual goods were averages of these local values which numbered in the tens or even hundreds.Footnote 25 For the four main cereals, quantities sold at each price were also collected and the regulations instructed the responsible officials to calculate quantity-weighted average prices.Footnote 26 For other goods, only prices (not quantities) were recorded, implying that the provincial data were simple, unweighted averages. Such was also the case with nominal day wage.Footnote 27