I. INTRODUCTION
Aluminum (Al) and its alloys have excellent properties, such as good processability, high strength, and low density and ductility, however, their applications in corrosive environments and some extreme operating conditions are still greatly restricted. Reference Qafsaoui, Kendig, Perrot and Takenouti1 In particular, aluminum alloys are easily deformed and undergo serious wear under harsh tribological conditions, which may severely impede the normal operation of the mechanical equipment in which they are used. Reference Su, Nelson and Sterling2,Reference Fu, Han and Song3 Hence, it is essential to develop new composite materials that combine excellent antiwear and anticorrosion properties as alternatives for Al alloys in engineering applications, such as in architecture, aeronautics, automotive components, and the petroleum and chemical industry. Reference Zhong, Xie, Sui and Yang4,Reference Suresha, Chandramohan, Samapthkumaran and Seetharamu5
Polymer matrix composites, which have shown outstanding properties of easy processing, corrosion resistance, self-lubricating, and high wear resistance, Reference Jacobs, Xu, Schädel and Wu6,Reference Mohan, Natarajan and KumareshBabu7 are ideal candidates for tribo-materials used in engineering fields. Reference Greco, Erck, Ajayi and Fenske8 As an important thermosetting matrix of polymer materials, epoxy (EP) resin has been widely used in engineering applications because of its excellent features, such as high mechanical properties, low curing shrinkage, and excellent chemical and corrosion resistance. Reference Montazeri, Javadpour, Khavandi, Tcharkhtchi and Mohajeri9 However, the application of EP is somewhat limited by its inherent brittleness, which results in inferior wear resistance. Reference Barrena, de Salazar, Soria and Cañas10 The integration of appropriate reinforcing materials into the EP matrix is a promising and widely accepted method of improving the wear resistance of EP to make it suitable for more demanding applications.
At present, carbon fiber (CF) is widely used as a load-bearing or corrosion-resistant structure to reinforce polymer composites, owing to its high strength and modulus, low thermal expansion, good creep resistance, and anticorrosion properties. Reference Okabe and Takeda11−Reference Ahsan, Lin, Munawar and Mohamad16 Jia et al. Reference Jia, Chen, Zhou, Hu and Chen17 comparatively studied the wear and transfer behaviors of polymer composites reinforced with CF under dry sliding and water lubrication. They found that, due to the cooling effect of water and the boundary lubrication of the sample in water, the tribological properties of the CF reinforced polymer composites under water lubrication were better than those of the composites under dry sliding. Pei et al. Reference Pei and Friedrich18 fabricated unidirectional CF reinforced polyetheretherketone (PEEK) composites and reported a mixture of ductile and brittle behaviors under corrosive wear conditions, regardless of the CF orientation. Tewari et al. Reference Tewari, Harsha, Häger and Friedrich19 studied the solid particle erosion of unidirectional CF/EP composites at various impingement angles and fiber orientations. They concluded that the fiber orientation had a significant influence on the solid particle corrosive wear of composites.
Several investigations on the wear behavior of EP composites reinforced by CF have been carried out; however, these have mainly concentrated on dry or water conditions. Reference Suresha, Seetharamu and Kumaran20,Reference Wan, Luo, Wang, Huang, Li and Zhou21 Reports on the tribological performance of CF/EP composites after corrosion in acid solutions are scarce. Corrosive wear is known to be one of the prominent problems in the petroleum and chemical industry, and chemical degradation of CF/EP composites after immersion in acid solutions is inevitable. However, the wear behaviors of corroded CF/EP composites and the synergetic effects between wear and corrosion are not yet fully understood. Further, the impact of the CF orientation on the tribological properties of CF/EP composites after corrosion is not clearly comprehended.
Based on the above facts, the corrosion resistance of CF/EP composites was examined after immersion in 10 wt% sulfuric acid solution for different numbers of days. The effects of the CF orientation and immersion period on the tribological properties of the corroded CF/EP composites were also investigated. At the same time, the wear behavior of Al alloy was comparatively studied under the same frictional condition. Moreover, the microstructures of the worn surfaces and corresponding counterpart surfaces were observed by scanning electron microscopy (SEM), and the wear mechanisms were analyzed based on the SEM images. This research is expected to provide helpful insights toward the application of EP composites in harsh conditions.
II. EXPERIMENT
A. Materials
Diglycidyl ether of bisphenol A (DGEBA)-based EP resin (Huntsman Advanced Materials Ltd.) was used as the matrix for the composites. Unidirectional CFs (T300J, Toray Carbon Fibers America, Inc.) were applied to reinforce the EP matrix. The vacuum bag was provided by Beijing Inova Technology Co., Ltd (China), and anhydrous ethanol was purchased from Huadong Reagent Factory (China). Distilled water was obtained by an artificial process.
B. Preparation of CF/EP composites
CF/EP composite laminates with a high fiber volume fraction of 64% were fabricated by vacuum assisted resin transfer molding (VARTM). A vacuum of 0.1 MPa and a temperature of 100 °C were maintained in a sealed vacuum bag during the vacuum assisted resin infusion (VARI) process. The vacuum bag with the resin-infiltrated CF was then moved onto a hot press to produce composite laminates. Meanwhile, it should be ensured that the cured laminate panels were planar. Finally, the laminates were cured in the hot press at a pressure of 0.4 MPa and a temperature of 120 °C for 16 h.
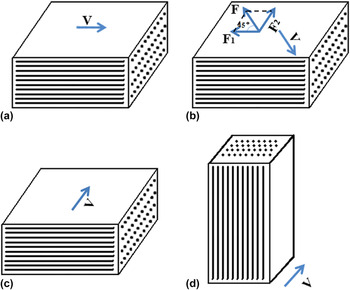
The samples used in all the experiments were cuboid, with dimensions of 5 × 4 × 3 mm. They were cleaned by using distilled water under ultrasonic for 5 min and then kept in an oven at 100 °C for 120 min. After drying, the samples were immersed in the 10 wt% sulfuric acid. Four groups of samples were prepared, which were immersed for 7, 15, 30, and 60 days, respectively. The hardness of the composites after corrosion was measured by using a Shore LX-D hardness tester (Haibao Instrument Co. Ltd., Wenzhou, China), and the average value from five tests was adopted as the final result. The wear tests were then carried out with different fiber orientations, as shown in Fig. 1.
Carbon fiber orientations and sliding directions: (a) parallel orientation (0°), (b) sliding direction at 45° fiber orientation, (c) antiparallel orientation (90°), (d) normal orientation.

C. Corrosion tests
Corrosion tests on the CF/EP composites were carried out according to the Chinese National Standard GB11547-89. The concentration of the sulfuric acid solution was 10 wt%. The reported values were the averages of three measurements. To determine the corrosion resistance of the composites, the corrosion mass loss percentage (Δm) was calculated by the following equation:
 $$\Delta m = {{{m_0} - {m_1}} \over {{m_0}}} \times 100\%$$
where m is the measured mass of the specimen, and the subscripts 1 and 0 denote the final (after corrosion) and initial values, respectively.
The corrosion resistance of the composites after different corrosion periods (0, 15, and 60 days) was also investigated by applying the Tafel polarization test in 3.5 wt% NaCl solution. The tests were done at room temperature by using an LK2010 electrochemical workstation equipped with a three-electrode cell system. A platinum electrode was used as the counter electrode, the composites as the working electrode, and a saturated calomel electrode as the reference electrode.
D. Friction and wear tests
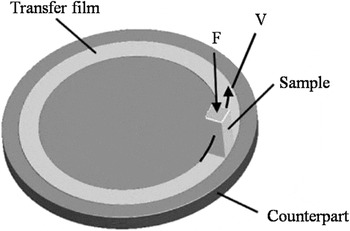
Friction and wear tests were conducted on an MPX-2000 friction and wear tester (Xuanhua Testing Factory, Hebei, China). Figure 2 shows the contact schematic diagram of the frictional couple. The directional requirements of the experiment were met by changing the directions of the samples (Fig. 1). The friction tests were performed with an applied load of 5.0 MPa and a sliding velocity of 0.69 m/s in the normal environment (temperature of 25 °C and humidity of 50% ± 5%). And the frictional time was 120 min. Before the test, the surface of the stainless steel counterpart plate was polished with 1000 grit paper to an average roughness of 0.15–0.3 μm, cleaned ultrasonically in anhydrous ethanol, and then thoroughly dried. The samples were weighed accurately before and after each experiment by using an FA2004N high-precision electronic balance (0.1 mg; Shanghai Precision Scientific Instrument Co. Ltd., Shanghai, China). The temperature of the worn surface was measured with an infrared thermometer during the test.
Contact schematic diagram of the frictional couple.

A computer recorded the frictional torque data once per second. The friction coefficient was calculated by using the following equation:
 $$\mu = {M \over {r \times {F_{\rm{N}}}}}$$
where M is the frictional torque (N m), r is the rotary radius of the pin (m), and F N is the vertical load (N).
The specific wear rate [Wr (mm3/N m)] was calculated as:
 $${\rm{Wr}} = {W \over {L \cdot \rho \cdot {F_{\rm{N}}}}}$$
where W is the mass loss (g), L is the sliding distance (m), ρ is the density of the sample (g/cm3), and F N is the normal load (N).
In this work, the friction and wear tests were replicated thrice for each sample and the average value from three tests was reported. The microstructures of the worn and counterpart surfaces were examined by SEM (Carl Zeiss Co. Ltd., Jena, Germany).
Moreover, the tribological performance of 7075 aluminum alloy was investigated, and compared with that of the composites under the same frictional condition.
III. RESULTS AND DISCUSSION
A. Corrosion properties of the composites
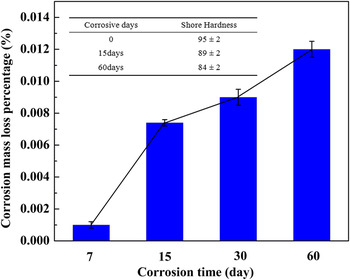
Figure 3 shows the corrosion mass loss percentage of the CF/EP composites, which clearly increased with the length of the corrosion period. In particular, when the corrosion period increased from 7 to 15 days, the mass loss percentage increased rapidly, after which, the corrosion extent decreased. Although the degradation and failure of the CF reinforced EP composites were inevitable after their immersion in corrosive media, the corrosion mass loss percentage stabilized at 0.001–0.012%. The main reason for this was that the CF was tightly stacked in the composites and was sufficiently wrapped by the EP matrix, only the naked surface of the CF exposed to the corrosive media caused the corrosion of the composites. Moreover, the measured hardness of the CF/EP composites for different corrosion periods, as shown in the inset, indicated a decrease of about 10% after 60 days compared with the original sample. And there was no obvious change when the corrosion period increased from 15 to 60 days. The above results suggest that unidirectional CF reinforced EP composites have favorable anticorrosion properties.
Corrosion mass loss percentage and hardness (inset) of the CF/EP composites for different corrosion periods.

B. Microstructure of the corroded specimen
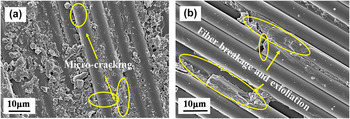
Figure 4 displays the surface morphology of the composites after immersion in 10 wt% sulfuric acid. The SEM investigations indicate that the corrosion of CF/EP composites is a complex process that includes matrix microcracking, fiber breakage, and fiber–matrix debonding due to the action of chemical degradation in the acid environment. The corrosion surface of the composites after 15 days of immersion [Fig. 4(a)] showed several minor damages, whereas fiber breakage and fiber–matrix debonding were not observed. After 60 days of immersion [Fig. 4(b)], matrix stripping, fiber breakage, and exfoliation were observed, while delamination between layers was not found. This result differed from some studies, which concluded that water and a corrosive medium could lead to matrix expansion and pit formation and that the blisters would continue to swell until finally collapsing after long-time immersion. Reference Hammami and Al-Ghuilani22,Reference Jones, Cintora, White and Sottos23 The results confirm that CF/EP composites have slow chemical degradation behaviors caused by the corrosion of sulfuric acid.
SEM images of the composite surfaces after the corrosion tests: (a) 15 and (b) 60 days of immersion.

C. Tafel polarization curve
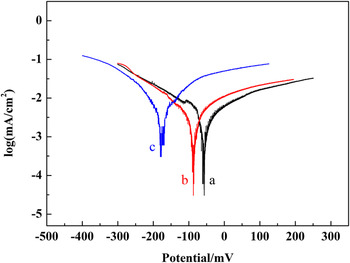
The corrosion resistance of the CF/EP composites for different immersion periods was evaluated by the Tafel polarization curves. As shown in Fig. 5, the corrosion potentials of the CF/EP composites after 0, 15, and 60 days of immersion were −56.7 mV, −87 mV, and −177.3 mV, respectively. Corrosion potential (E corr) is a measure of the tendency of composites to corrode, with a higher corrosion potential indicating better corrosion resistance. The negative shift in the corrosion potential suggested that the corrosion resistance of the composites after sulfuric acid immersion decreased compared with the original composites. However, the corrosion potential of the composites after 60 days of immersion was much higher than that of Al alloy (−600 to −1200 mV Reference Birbilis, Cavanaugh and Buchheit24,Reference Pardo, Merino, Coy, Arrabal, Viejo and Matykina25 ). The corrosion current density (I corr) was obtained by the extrapolation of the anodic and cathodic branches of the Tafel polarization curve. The corrosion current density of the composites after 15 days of immersion showed little change compared with the original composites [10−2.32 mA/cm2]. This was mainly due to the tightly woven structure of CF, which could effectively prevent the acid solution from permeating into the composites over a period of time. The above analysis reveals that the prepared CF/EP composites have certain potential for application in the field of corrosion.
Tafel curves of the CF/EP composites for different immersion periods: (a) 0, (b) 15, and (c) 60 days.

D. Tribological properties of the corroded CF/EP composites
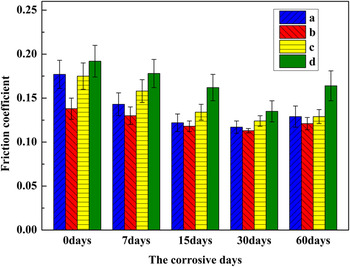
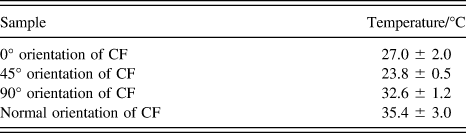
Figure 6 displays the friction coefficients of the CF/EP composites after the corrosion tests for different fiber orientations and immersion periods. For the same immersion period, the composites with 45° fiber orientation had the lowest friction coefficient and those with normal fiber orientation had the highest value. This could be ascribed to the CF orientation, which has an important effect on the temperature of the worn surface, as given in Table I. In general, a higher frictional temperature is associated with a larger friction coefficient. Reference Zhang, Yu, Zhang, Liao and Coddet26,Reference Cui, Geng, Wang, Chen and Gao27 The worn surface of the composites with 45° fiber orientation had the lowest temperature due to the decomposition of the friction force [Fig. 1(b)], thus resulting in the lowest friction coefficient. When the CF is oriented perpendicularly to its counterpart [Fig. 1(d)], the high repeated compression-tension stresses at the fiber–matrix interface can lead to fiber bending and breakage after acid corrosion. This is the main reason why the highest friction coefficient was obtained for the EP composites filled normally oriented CF.
Friction coefficients of the composites with various fiber orientations under different corrosion periods: (a) 0°, (b) 45°, (c) 90°, and (d) normal orientation.

Temperature of the worn surface after 30 days of immersion.

For the same fiber orientation, the friction coefficients of the corroded CF/EP composites first reduced and then increased with increasing corrosion period, and the composites under 30 days of immersion displayed the lowest value. This may be ascribed to the small amount of residual acid liquor extruded by the applied load during the sliding process. The acid liquor could act as a coolant to appropriately decrease the temperature on the sliding surface, which is benefit to the decrease of the friction coefficient. However, after 60 days of immersion, some fibers damaged by the chemical degradation may peel off from the matrix during the friction process, making the worn surface rough and thus leading to a higher friction coefficient.
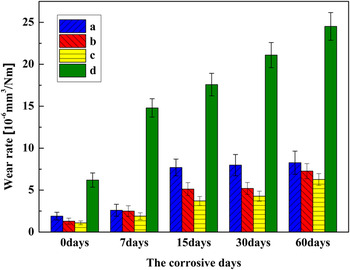
Figure 7 shows the variation in the specific wear rates of the corroded composites for the different fiber orientations and corrosion periods under an applied load of 5.0 MPa and a sliding velocity of 0.69 m/s. The wear rates of the composites after immersion in the sulfuric acid solution were clearly observed to remain at 10−6 mm3/N m, and the fiber orientations were found to have an evident influence on the wear resistance. For the same corrosion period, the wear rate of the composites decreased with the increasing fiber orientation angle with regard to the sliding direction from 0 to 90° orientation. However, the wear rate of the composites with normal fiber orientation increased sharply. A comparatively low specific wear rate (4.2 × 10⁻⁶ mm3/N m) was observed for the composites with 90° fiber orientation after 30 days of immersion, which was 6 times lower than that of composites with normal fiber orientation. The specific effects of the fiber orientation on the wear behavior are discussed in the subsequent section.
Wear rates of the composites with various CF orientations under different corrosion periods: (a) 0°, (b) 45°, (c) 90° orientation, and (d) normal orientation.

For the same fiber orientation, the wear rate of CF/EP composites was proportional to the immersion period. After 60 days of immersion, the wear rate of the composites with normal fiber orientation was 24.5 × 10⁻⁶ mm3/N m, which was approximately 5 times higher than that of the original composites without corrosion (6.2 × 10⁻⁶ mm3/N m). This was due to the chemical degradation behavior of the CF/EP composites after immersion in the sulfuric acid solution. As analyzed in Fig. 4, the degradation degree increased with the corrosion period. Fiber breakage and exfoliation would easily give rise to a large amount of wear debris during the sliding process, resulting in a high mass loss for the composites after 60 days of immersion.
E. SEM analysis of the worn surfaces and their counterparts
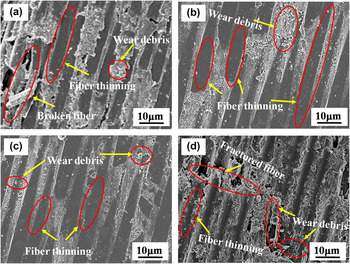
To further understand the effects of the fiber orientation on the friction and wear behaviors after acid corrosion, SEM images of the worn surfaces of CF/EP composites are shown in Fig. 8. Wear debris and abrasion of fiber layers could be observed on the wear tracks of all the examined composites, however, these differed across the samples. There were some broken and peeled fibers on the worn surface of the composites with 0° fiber orientation [Fig. 8(a)], whereas there was a mass of wear debris without broken fibers on that of the composites with 45° fiber orientation [Fig. 8(b)]. As shown in Fig. 8(c), the worn surface of the composites with 90° fiber orientation had a relatively smooth morphology and no obvious fiber debonding. On the contrary, the worn surface of composites in normal fiber orientation [Fig. 8(d)] was rather rough with apparent fractured fibers and a large amount of wear debris. The fractured and stripped fibers scratched the worn surface, leading to further fiber failure. Reference Zhang, Rasheva and Schlarb28 These observations are consistent with the results on wear behaviors.
SEM micrographs of the worn surfaces of the composites with different fiber orientations: (a) 0°, (b) 45°, (c) 90°, and (d) normal orientation.

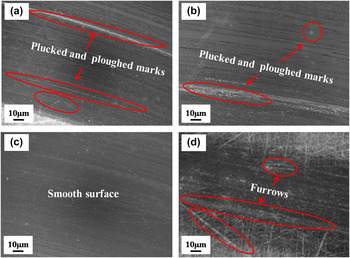
Figure 9 presents the SEM images of the counterpart surfaces of the composites with different fiber orientations. There were a few plucked and ploughed marks on the counterpart surfaces of the composites with 0° and 45° fiber orientations [Figs. 9(a) and 9(b)]. However, few scratches were found, the sliding traces on which exhibited a consistent direction. This can be mainly attributed to the formation of a transfer film, which prevented the direct contact between the worn and counterpart surfaces, Reference Shen, Top, Pei and De Hosson29 but this film was not continuous. In contrast, the counterpart surface of the composites with 90° fiber orientation [Fig. 9(c)] was much smoother due to the formation of a uniform and continuous transfer film, which could effectively protect the counterpart surface from further abrasion. Reference Bahadur30 For the composites with normal fiber orientation, a large amount of disordered scratches and some furrows could be seen on the counterpart surface [Fig. 9(d)]. This is due to the fact that the fractured and peeled fibers on the worn surface could scratch the counterpart surface and no transfer film was formed to protect it.
SEM images of the counterpart surfaces of the composites with different fiber orientations: (a) 0°, (b) 45°, (c) 90°, and (d) normal orientation.

F. Wear mechanisms
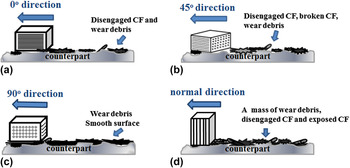
Based on the above analysis, it can be concluded that the transfer film plays an important role in wear resistance and surface morphology. Figure 10 illustrates the formation process of the transfer film and the related wear mechanisms of the composites with different fiber orientations. For the composites with 0° and 45° fiber orientations [Figs. 10(a) and 10(b)], matrix shear failure would take place, especially in the zone near the fiber–matrix interface, resulting in the debonding of fibers from the matrix. Reference Tewari, Harsha, Häger and Friedrich31 The fiber–matrix debonding would weaken the load carrying capacity of composites. Moreover, although the disengaged fibers could gradually form a solid transfer film under the mechanical load during the friction process, the film was heterogeneous and not continuous because of the exfoliated fibers in the form of thin pieces or layers. When the fiber is in 90° orientation [Fig. 10(c)], the degree of fiber debonding decreased considerably due to the reduced matrix shear stress, Reference Tewari, Harsha, Häger and Friedrich19,Reference Rasheva, Zhang and Burkhart32 and peeled-off tiny wear debris were found on the counterpart surface instead of disengaged fibers. The tiny wear debris can fill up the microvoids and defects on the counterpart surface to form a homogeneous transfer film that protected the specimen from further abrasion, which greatly promoted the wear resistance of the composites with 90° fiber orientation. The degradation degree of fibers with normal orientation was more prone to deterioration due to the high repeated compression-tension stresses at the fiber–matrix interface. The stripped fibers can not only scratch the matrix but also collide other fibers, leading to further fiber failure. Thus the counterpart surface had plenty of wear debris and disengaged fibers, as shown in Fig. 10(d). In this case, the transfer film could not be developed during the sliding process. This led to the poor wear behavior of the CF/EP composites with normal fiber orientation.
Schematic drawings of the wear mechanisms of the composites with different fiber orientations: (a) 0°, (b) 45°, (c) 90°, and (d) normal orientation.

G. Comparable tribological performance of Al alloy and original CF/EP composites
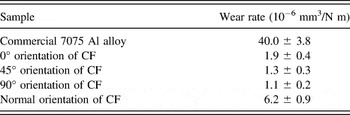
7075 Al alloy is one of the highest strength aluminum alloys. In this work, the tribological properties of 7075 Al alloy and original CF/EP composites with the different fiber orientations under the same frictional condition were comparatively investigated. The results shown in Table II indicated that the wear rates of the CF/EP composites were all one order of magnitude lower than that of Al alloy. That is, the wear resistance of CF/EP composites showed a significant improvement over that of the Al alloy. In particular, the wear resistance of the composites with 90° fiber orientation was 36 times higher than that of Al alloy. Therefore, CF/EP composites could be a potential substitute for alloy materials in the field of tribology under rigorous conditions.
Wear rates of the Al alloy and original CF/EP composites for different fiber orientations (applied load: 5.0 MPa, sliding velocity: 0.69 m/s).

IV. CONCLUSION
In this study, the corrosion resistance of CF/EP composites was evaluated by electrochemical corrosion tests carried out after immersion of the composites in 10 wt% sulfuric acid for different numbers of days. The friction and wear behaviors of the corroded CF/EP composites were investigated considering the different fiber orientations and immersion periods. Some insights into the friction and wear mechanisms were obtained, and the following conclusions could be drawn:
-
(1) The CF/EP composites exhibited good anticorrosion property. Although the corrosion mass loss percentage of the CF/EP composites increased with increasing immersion period in corrosive media, it was as low as 0.012% after 60 days of immersion. The hardness of the composites showed no obvious change after 15–60 days of corrosion.
-
(2) The CF/EP composites still showed excellent friction and wear behaviors even after corrosion by 10 wt% sulfuric acid solution. In particular, a low wear rate (6.3 × 10⁻⁶ mm3/N m) was obtained for the composites with 90° fiber orientation after 60 days of immersion.
-
(3) The CF orientation had important effects on the tribological performances of CF/EP composites. For the same immersion period, the composites with 45° fiber orientation showed the lowest friction coefficient, and the greatest improvement in wear resistance was obtained for the composites with 90° fiber orientation.
-
(4) SEM analysis indicated that the formation of a transfer film during the sliding process played an important role in the wear behavior of CF/EP composites. The higher wear resistance and smoother worn surface of composites with 90° fiber orientation were mainly due to the formation of a uniform and continuous transfer film, which could effectively prevent the direct contact between the worn and counterpart surfaces.
ACKNOWLEDGMENTS
The authors acknowledge the National Young Top Talents Plan of China (2013042), the National Science Foundation of China (Grant No. 51175066), the Science Foundation for Distinguished Young Scholars of Heilongjiang Province (JC201403), and the Natural Science Foundation of Heilongjiang Province (E2015034) for supporting this research.