1. Introduction
The sandstone detrital modes obtained by point counting on thin-section are usually used to define the petrofacies relations controlled by provenance from growing orogenic terranes and palaeogeography of the foreland basins. In the Southern Italy orogenic system, the sandstone detrital mode evolution has been connected to Cenozoic geodynamics utilizing as provenance indicators their petrographic characters (e.g. Critelli et al. Reference Critelli, Muto, Perri and Tripodi2017). The tectonic evolution from thick-skinned Alpine Chain (Late Palaeogene – Middle Miocene) to thin-skinned Southern Apennines thrusting (from Early to Middle Miocene) is recorded by Palaeogene and Miocene sandstone composition of widespread turbidite deposits. The complex geodynamic history of growing orogen in Southern Apennines can be depicted applying different methods.
A new and complementary approach to provenance sandstone studies consists in the efficient and reliable technical capability of laser ablation – inductively coupled plasma mass spectrometry (LA-ICP-MS) on detrital zircons, extremely useful to recognize the potential source areas of detritus (Thomas, Reference Thomas2011; Gehrels, Reference Gehrels, Busby and Azor2014). The U–Pb ages on detrital zircons are related to a high-temperature metamorphic event involving the source rock and/or to thermal system closure in magmatic rocks. Therefore, detrital zircon ages are linked to the rocks supplying the sedimentation basin and can lead to identification of the source area for a better understanding of the palaeogeography during the sedimentation (e.g. Campbell et al. Reference Campbell, Reiners, Allen, Nicolescu and Upadhyay2005; Morton & Hallsworth, Reference Morton, Hallsworth, Mange and Wright2007; Gehrels et al. Reference Gehrels, Blakey, Karlstrom, Timmons, Dickinson and Pecha2011; Thomas, Reference Thomas2011). Detrital zircons are involved in erosion and transport processes before sedimentation in the basin; during this course they can be crushed and rounded, losing the labile rim domains, so caution in the age interpretation is necessary, mostly if younger ages are missing (Malusà & Garzanti, Reference Garzanti2019).
The dating of detrital zircons in siliciclastic deposits forming the Southern Apennine Chain was performed on quartz-rich sandstones of Bifurto and Numidian Flysch formations deposed during the Burdigalian – Early Langhian in foreland basins located on the Campania–Lucania platform (Bifurto) and between western internal units and the Adria platform (Numidian Flysch). In both cases, detrital zircon ages evidenced an exclusive source area located on Africa Craton, being in the range 3047 ± 13 Ma to 425 ± 9 Ma (Fornelli et al. Reference Fornelli, Micheletti, Langone and Perrone2015, Reference Fornelli, Gallicchio and Micheletti2019). The relevant geological contribution has been the deduction that in the Burdigalian – Early Langhian time during the sedimentation in foreland basins forming the future Apennine belt, the Alpine chain made up of structural elements derived from European and African plates did not supply the foreland basins of Bifurto and Numidian sandstones. The study of U–Pb detrital zircon ages in sediments deposited successively (Langhian p.p. – Tortonian) in thrust-top basins on the inner Numidian palaeogeographic domains could reveal the geological evolution of the Alpine and Apennine orogenic system monitoring the change of detritus source area. The dating of detrital zircons in sandstones of Gorgoglione Flysch (GF) deposed during the Middle Miocene, overlying the Sicilide Unit and representing a filling of a wedge-top basin, has been performed with the aim of verifying the possible changes of source area during the Apennine Chain formation. The petrographic features of 21 samples of sandstones have been revealed along three studied sections, and the chemical composition was determined on 18 samples. Petrographic and chemical study is preliminary to a suitable selection of datable samples. Six samples distributed along the successions emerging in the Gorgoglione area were chosen for U–Pb detrital zircon dating.
2. Geological setting of Gorgoglione Flysch in the Mediterranean area
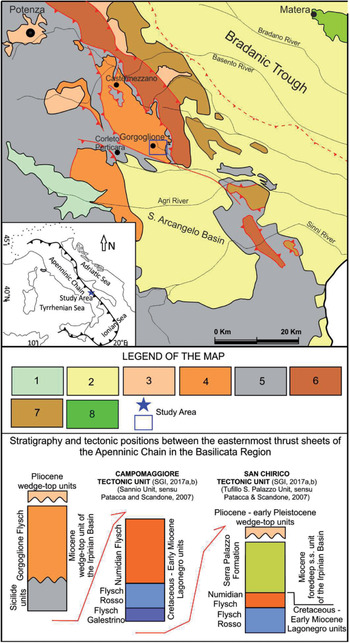
The Gorgoglione Flysch (e.g. Selli, Reference Selli1962; Ogniben, Reference Ogniben1969) is a deep-marine turbidite succession deposited in the Miocene wedge-top basin system of the Southern Apennines, classically referred to the Irpinian Basin (e.g. Pescatore & Senatore, Reference Pescatore, Senatore, Allen and Homewood1986; Pescatore et al. Reference Pescatore, Renda, Schiattarella and Tramutoli1999 and references therein). This basin is part of the more extensive Maghrebian–Apennine thrust-belt – foreland system sensu DeCelles & Giles (1996) developed in the central Mediterranean area (Fig. 1) after the closure of the Maghrebian and Lucanian flysch basins sensu Guerrera & Martín-Martín (Reference Guerrera, Martín-Martín, Raffaelli and Tramontana2014). The wedge-top domains of this foreland basin system are mainly represented by Middle–Late Miocene deep marine turbidite deposits unconformably lying on the top of allochthonous Mesozoic – Early Miocene inner Maghrebian and Lucanian flysch successions overthrusted on the subducting north African and west Adriatic continental margins (e.g. De Capoa et al. Reference De Capoa, Di Staso, Guerrera, Perrone and Tramontana2004). The eastern domains of this system are represented by external deep marine sedimentary basins known from south to north as Massylian sub-domain, Imerese–Sicano Basin, Lagonegro–Molise Basin and Umbria–Marche Basin (e.g. Patacca & Scandone, Reference Patacca and Scandone2007; Lentini & Carbone, Reference Lentini and Carbone2014; Guerrera et al. Reference Guerrera, Martín-Martín, Raffaelli and Tramontana2015). The source area of the wedge-top basins was located in the hinterland and represented by the Meso-Mediterranean Microplate (e.g. Guerrera et al. Reference Guerrera, Martín-Martín and Tramontana2019), consisting of Hercynian basement and Alpine terrains, and by the Hercynian Sardinia–Corsica block; on these domains, during the Late Oligocene – Early Miocene, a magmatic activity producing syn-orogenic volcanoclastic deposits took place (e.g. Martìn-Martìn et al. 2019). The deposits of the wedge-top basins comprising Gorgoglione Flysch were incorporated in the eastern Southern Apennine chain towards the Apulia foreland (Figs 1 and 2), due to an anticlockwise rotation of several tens of degrees (e.g. Speranza et al. Reference Speranza, Adamoli, Maniscalco and Florindo2003 a, b).
Palaeogeographic and palaeotectonic sketch of the Maghrebian and Apennine wedge-top basin system in the central Mediterranean area at Middle Miocene (modified from Carminati et al. Reference Carminati, Lustrino and Doglioni2012; Guerrera et al. Reference Guerrera, Martín-Martín and Tramontana2019).

Geologic framework of the Southern Apennines front in the Basilicata Region and main easternmost thrust sheets of the Apennine Chain. Legend of map: (1) Quaternary alluvial deposits; (2) Pliocene–Pleistocene deposits of S. Arcangelo Basin and Bradanic Trough; (3) Pliocene wedge top basin; (4) Gorgoglione Flysch; (5) undifferentiated Meso-Cenozoic Apenninic Units (Sicilide Units); (6) Campomaggiore Tectonic Unit; (7) San Chirico Tectonic Unit; (8) Cretaceous Units of the Apulia Platform.

The remnants of Gorgoglione Flysch (GF) outcrop along the eastern margin of the Southern Apennine Chain overlapping allochthonous units belonging to the Sicilide Complex (Fig. 2), as Argille Variegate, Tufiti di Tusa and Arenarie di Corleto (e.g. Lentini, Reference Lentini1979; Fornelli et al. Reference Fornelli, Gallicchio, Mongelli, Salvemini, Summa, Ventrella and Zaza1992; Fornelli & Piccarreta, Reference Fornelli and Piccarreta1997; Perri et al. Reference Perri, Critelli, Cavalcante, Mongelli, Sonnino, Dominici and De Rosa2012; Carbone, Reference Carbone2013; Cerone et al. Reference Cerone, Gallicchio, Moretti and Tinterri2017; Critelli et al. Reference Critelli, Muto, Perri and Tripodi2017). The regional geologic setting of the GF is shown in Figure 2 where, together with its substratum, it overthrusts the easternmost tectonic units of the chain consisting mainly of Miocene siliciclastic turbidite successions of the Numidian Flysch and the Serra Palazzo Formation (e.g. Selli, Reference Selli1962; Ogniben, Reference Ogniben1969; Gallicchio & Maiorano, Reference Gallicchio and Maiorano1999; Fornelli et al. Reference Fornelli, Micheletti, Langone and Perrone2015, Reference Fornelli, Gallicchio and Micheletti2019). These tectonic units are known, from west to east (Fig. 2), as the Campomaggiore or Sannio tectonic unit and the San Chirico or Tufillo Serra–Palazzo tectonic unit (e.g. Patacca & Scandone, Reference Patacca and Scandone2007; Boenzi et al. Reference Boenzi, Capolongo, Gallicchio and Di Pinto2014; Pieri et al. Reference Pieri, Gallicchio, Sabato, Tropeano, Boenzi, Lazzari, Marino and Vitale2017; SGI, 2017a, b).
The stratigraphic and depositional features of the GF have been studied by many authors (e.g. Loiacono, Reference Loiacono1974, Reference Loiacono1993; Boiano, Reference Boiano1997; Giannandrea et al. Reference Giannandrea, Loiacono, Maiorano, Lirer and Puglisi2016; Casciano et al. Reference Casciano, Patacci, Longhitano, Tropeano, McCaffrey and Di Celma2019 and references therein). According to Boiano (Reference Boiano1997), the sedimentary succession of the GF has been subdivided into two turbidite complexes initially separated by a substratum structural high: the northern turbidite complex is exposed in the Castelmezzano area, whereas the southern turbidite complex outcrops in the Gorgoglione area (Fig. 2). Both these turbidite complexes show roughly the same thickness (of c. 1800 m) and in each complex, lower, middle and upper turbidite systems have been recognized on the basis of depositional features: each turbidite system is characterized in the lower part by coarse-grained and canalized deposits and shows upwards an overall thinning and fining depositional trend (Boiano, Reference Boiano1997). The Gorgoglione succession is mainly represented by channel-fill and channel–lobe transition facies associations, deposed in a narrow and NNW–SSE stretched wedge-top basin (Fig. 1), fed by axial turbidite currents flowing towards the SSE (e.g. Loiacono, Reference Loiacono1974, Reference Loiacono1993; Colella, Reference Colella1979; Boiano, Reference Boiano1997; Casciano et al. Reference Casciano, Patacci, Longhitano, Tropeano, McCaffrey and Di Celma2019). The age of the Gorgoglione deposits is considered Langhian–Tortonian by some authors (e.g. Boenzi & Ciaranfi, Reference Boenzi and Ciaranfi1970; SGI, 2005, 2014), whereas others suppose a Serravallian–Tortonian age (Pescatore et al. Reference Pescatore, Renda, Schiattarella and Tramutoli1999; Patacca & Scandone, Reference Patacca and Scandone2007, Critelli, Reference Critelli2018). The inaccurate age is probably due to typical reworked fossils in the flysch deposits.
The arenaceous deposits of GF are represented mainly by feldspatho-quartzose and litho-feldspatho-quartzose arenites (Garzanti, Reference Garzanti2019) mainly derived from an inner active growing front of the chain (Fig. 1) connected to a crystalline basement generally identifiable in the Calabria terrains by many authors (e.g. Critelli & Loiacono, Reference Critelli and Loiacono1988; Critelli, Reference Critelli1999; Critelli et al. Reference Critelli, Muto, Perri and Tripodi2017).
3. Stratigraphic characters and sampling of Gorgoglione Flysch
The studied sandstones derive from three sedimentary sections (Log1, Log2 and Log3) outcropping east of Gorgoglione Village (Figs 2 and 3a). All these sections (Fig. 3b) belong to the middle system of the southern turbidite complex of GF having an overall thickness of c. 600 m (e.g. Boiano, Reference Boiano1997). The middle system is arenaceous–microconglomeratic in the lower portion (c. 100 m thick), arenaceous in the intermediate portion (c. 300 m thick) and mainly pelitic in the upper portion having a thickness of c. 200 m (Fig. 3b).
(a) Geologic map of the Gorgoglione area with location of the studied Logs. The numbers indicate the altitude. Black polygons indicate the population centres. (b) Schematic lithostratigraphic succession of the middle system of Gorgoglione Flysch and stratigraphic thickness of Log1, Log2 and Log3.

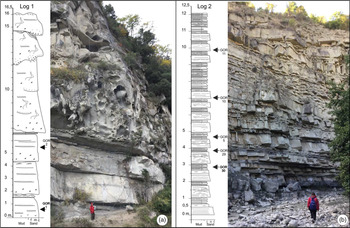
The first studied section (Log1 (40° 23′ 18.13 N, 16° 09′ 57.49 E) in Fig. 4a) is c. 20 m thick and belongs to the lower portion of the middle system (Fig. 3b). It consists mainly of thick bedded coarse-grained sandstones and micro-conglomerates having roughly lenticular or tabular geometries and basal erosional surfaces. The beds are generally massive and characterized by abundant mud clast (referable to rip-up processes) and fluidified structures; moreover, crude planar, wavy or oblique tractive laminations may characterize the upper part of the beds (e.g. facies F5, F6, F7 sensu Mutti, Reference Mutti1992). These bed types form multiple amalgamated coarse-grained facies packages (10–15 m thick), with thin and discontinuous pelitic interbeds. These packages, referable to channel-fill deposits (e.g. Mutti & Normark, Reference Mutti, Normark, Leggett and Zuffa1987), are separated by thinner intervals of medium- to fine-grained arenaceous–pelitic alternations (e.g. facies F9, Mutti, Reference Mutti1992) or by very thick tabular beds of coarse- to medium-grained sandstones showing crude planar laminations (facies F7), massive intervals (facies F5, F8), wavy parallel laminations, cross-laminated structures (facies F6) and planar to wavy scours referable to high-density turbidity currents (e.g. Lowe, Reference Lowe1982) linked to channel–lobe transition facies associations. These facies interpretations are in accordance with the literature (e.g. Loiacono, Reference Loiacono1974, Reference Loiacono1993; Boiano, Reference Boiano1997). GOR1 and GOR2 samples derive from this portion.
Lithostratigraphy and sedimentary characters of Log1 (a) and Log2 (b) with photographs of study sections and location of taken samples. In bold the samples with dated zircons.

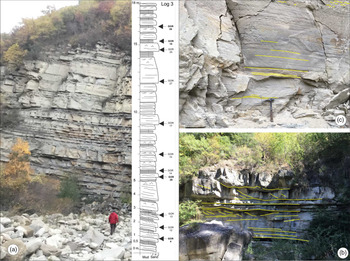
Log2 (40° 23′ 18.13 N, 16° 09′ 14.60 E) and Log3 (40° 24′ 11.68 N, 16° 09′ 11.12 E) are representative of the intermediate portion of the studied system (Fig. 3b). The two logs are mainly represented by sand-rich turbidites characterized by medium- to fine-grained tabular beds (Figs 4b and 5a). The sandstone beds have thickness ranging from a few centimetres to more than 1.5 m, and show flat and slightly erosive basal surfaces and internal sedimentary structures referable from the bottom to the top to a massive interval (facies F8); however, parallel lamination passing upward to ripples or convolute textures can be frequently present (Tabc Bouma sequence, facies F9 sensu Mutti, Reference Mutti1992). Cyclic thickening- and thinning-upward sequences having a thickness of a few metres occur in Log2 and Log3 (Figs 4b and 5a, b). All these sedimentary features suggest that the described Logs in accordance with literature (Loiacono, Reference Loiacono1974, Reference Loiacono1993; Boiano, Reference Boiano1997) may be referred mainly to depositional lobes sensu Mutti & Normark (Reference Mutti, Normark, Leggett and Zuffa1987). Locally, slightly concave-upward scours are covered by mud or cross-laminated sands (facies F6; Fig. 5c) indicating channel–lobe transition deposits (Mutti & Normark, Reference Mutti, Normark, Leggett and Zuffa1987). In Figures 4b and 5a the locations of studied samples along Log2 and Log3 are reported.
(a) Lithostratigraphy and sedimentary characters of Log3 with photographs of outcrop; (b) typical lobe sandstone beds; (c) details of typical channel–lobe transition sandstone beds. In bold the samples with dated zircons.

4. Analytical methods
Modal analyses were performed under an optical microscope on 21 samples of sandstones. Point counting was performed according to the Gazzi–Dickinson method (Ingersoll et al. Reference Ingersoll, Bullard, Ford, Grimm, Pickle and Sares1984; Dickinson, 1985); 600 points were counted on each thin-section. The proportion of quartz, feldspar and labile lithic grains for a quartz–feldspar–lithics (QFL) diagram was obtained by recalculation to 100 % of collected data.
Whole rock analyses have been performed on 18 samples by X-ray fluorescence utilizing a Panalytical (Axios advanced) automatic spectrometer (Earth Science and Geo-environmental Department, Bari University, Italy).
Zircon crystals were extracted from six rock samples having an initial weight of c. 3 kg. They were selected from two different grain-size fractions (45 to 125 μm and 125–350 μm) with the aim of controlling the age dependence on grain size (Malusà et al. Reference Malusà, Carter, Limoncelli, Villa and Garzanti2013). Carpco and Frantz magnetic separators and high-density solutions (with sodium polytungstate) were used for zircon concentration. The most limpid crack- and inclusion-free zircon grains were hand-picked under the stereomicroscope and mounted in epoxy resin. Turbid zircons with likely metamict domains due to radiation damage have been excluded in order to reduce the possible occurrence of discordant data (Malusà et al. Reference Malusà, Carter, Limoncelli, Villa and Garzanti2013).
The study of zircon morphology and internal zoning was performed by scanning electron microscope using a Zeiss EVO50XVP (Earth Science and Geo-environmental Department at Bari University). The BSED (Back-Scattered Electron Detector) images were collected to examine morphologic features of zircon and possible occurrences of fractures and inclusions. The high-resolution images of the internal zoning patterns were acquired using a Variable Pressure Secondary Electron (VPSE) detector. Operating conditions were an accelerating voltage of 15 kV with a beam current of 100 nA in high-vacuum conditions. The most suitable location of the analytical spot for U–Pb analyses was selected on the acquired images on the basis of recognized textures (Corfu et al. Reference Corfu, Hanchar, Hoskin, Kinny, Hanchar and Hoskin2003).
After the isotopic analyses, the zircon grains were inspected again by VPSE detector in order to check the precise spot location with respect to the different micro-textural domains.
U–Pb zircon ages were performed at IGG-CNR in Pavia (Italy) by LA-ICP-MS. The U–Pb analyses were carried out in single spot mode, c. 10 µm for small crystals and 25 µm for large grains. For details of the analytical setting, refer to Horstwood et al. (Reference Horstwood, Košler, Gehrels, Jackson, McLean, Paton and Bowring2016) and Fornelli et al. (Reference Fornelli, Micheletti, Langone and Perrone2015).
Data reduction was carried out with the software package GLITTER® (Van Achterbergh et al. Reference Van Achterbergh, Ryan, Jackson, Griffin and Sylvester2001). Detrital zircon U–Pb data with discordance probability >±10 % were discarded. Reported ages were calculated on the basis of 206Pb/238U ratios for grains younger than 1.4 Ga and of 206Pb/207Pb for older grains (Gehrels et al. Reference Gehrels, Blakey, Karlstrom, Timmons, Dickinson and Pecha2011, Reference Gehrels, Busby and Azor2014; Spencer et al. Reference Spencer, Kirkland and Taylor2016). Detrital zircon age distributions were represented as probability density plots (PDPs) using the Density Plotter 8.1 software following the model of Kernel Density Estimator (Vermeesch, Reference Vermeesch2012).
5. Petrographic signatures
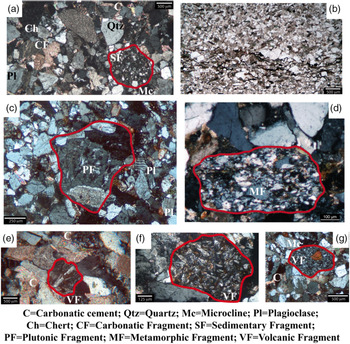
Twenty-one poorly cemented samples of coarse- to fine-grained sandstones along Log1, Log2 and Log3 (Figs 4a, b and 5a) show immature mineralogical and textural features. Despite the different grain sizes (Figs 6a, b), all samples show similar detrital fragment types. The monocrystalline grains consist of quartz, K-feldspar, plagioclase and micas; the phaneritic and aphanitic lithic fragments include granites (Fig. 6c), microgranites, phyllites (Fig. 6d), gneisses, micaschists, acidic and intermediate volcanic grains (Figs 6e–g), extra-basinal carbonate fragments and cherts (Fig. 6a). The plutonic and coarse-grained metamorphic lithic fragments prevail with respect to volcanic ones in coarse-grained sandstones, whereas sedimentary lithics and phyllites are more abundant in the fine-grained sandstones.
Microscope photos of studied sandstones: (a) coarse-grained sandstone with sedimentary lithic fragments; (b) fine-grained sandstone with clayey-carbonaceous levels; (c) granitic coarse-grained lithic fragment; (d) low-grade metamorphic lithic; (e–g) volcanic lithic fragments. Cross-polarized light (a, c–g), plane-polarized light (b).

The principal composition (on average Qt57 F30 L13) for both sandstone types ranges between feldspatho-quartzose and litho-feldspatho-quartzose arenites (Fig. 7). The matrix is prevalently siliciclastic (15 % on average) similar to the framework; locally carbonate matrix is also present up to 2 %. The carbonate cement varies from 3 % to 36 %. The accessory minerals are epidote, zircon, apatite, tourmaline and monazite. A substantial difference separates out the fine- and coarse-grained sandstones: prevalent micaceous, calcitic and carbonaceous components with laminated texture characterize the fine-grained sandstones with higher contents of matrix, whereas quartz, feldspars and massive textures with random arrangement of grains prevail in the coarse-grained sandstones (Figs 6a, b).
QFL diagram (Garzanti, Reference Garzanti2019) showing the principal composition of coarse- and fine- grained sandstones ranging from feldspatho-quartzose to litho-feldspatho-quartzose arenites.

6. Chemical features
The major and trace element composition of 7 samples of fine-grained sandstones and 11 samples of coarse-grained arenites is given in Table 1.
Chemical analysis of fine (F)- and coarse (C)-grained sandstones. The order of samples follows the stratigraphic levels from Log1, Log2 to Log3. In bold the Zr contents in the dated samples.

The most abundant elements are SiO2 (57.58 wt % on average), CaO (13.85 wt % on average) and Al2O3 (9.63 wt % on average) controlled by modal contents of quartz, feldspar, micas and calcite; in fact, from Figure 8a, a negative correlation is evident between CaO vs SiO2 and Al2O3. The SiO2, Al2O3, K2O and Ba contents decrease from Log1 to Log3 while the CaO content increases, indicating higher amounts of quartz and feldspars and a lower content of calcite in the Log1 sandstones (cf. Figs 4a, b and 5a and Table 1). FeO, MgO, Cr, Ni and V contents are, on average, higher in the fine fraction with respect to the coarse one, being linked to abundance of alteration products such as Fe-oxide or Fe-hydroxides at the expense of Fe–Mg silicate phases (Table 1). In Herron’s (Reference Herron1988) diagram, the fine-grained sandstones can be classified as wackes and litharenites with higher contents of Fe2O3, whereas the coarse-grained arenites fall in the arkose field with lower Fe2O3 contents and higher SiO2 values (Fig. 8b). The chemical composition of sandstones shows a substantial ‘granitic’ or acidic origin of detritus as evidenced by Ni and MgO contents shown in Figure 8c, where it is evident that the mafic contribution was minor at 5 %. The prevalent acidic nature of the supply material promotes the geochronological study of detrital zircons (particularly abundant in acidic rocks), being containers of the geological history of the source area. The Zr content is discriminant in the selection of suitable samples for the zircon separation; the higher Zr content in the fine-grained sandstones (189 ppm on average) with respect to coarse- grained ones (128 ppm on average) suggests a more fertile production of separable zircons in the first sandstones. However, all samples have Zr concentrations high enough to extract sufficient amounts of zircon grains (Table 1). Three samples of fine-grained sandstones (GOR18, GOR26, GOR30) with 197 ppm of Zr on average and three samples having on average 139 ppm of Zr from coarse-grained arenites (GOR1, GOR4, GOR 28) were selected for the geochronological study, appropriately distributed along the study sections.
(a) The negative correlation between the CaO, SiO2 and Al2O3 contents in coarse- and fine-grained sandstones. (b) Coarse- and fine-grained sandstones classify in the Herron’s (Reference Herron1988) diagram as arkoses and wackes–litharenites, respectively. (c) Ni vs MgO contents (van de Kamp and Leake, Reference Van de Kamp and Leake1995); the sandstones show composition of typical ‘granitic’ or acidic sands.

7. Zircon textures and U–Pb ages
The sizes of separated zircon grains range from 350 μm to 45 μm in the six samples. As expected, more datable zircon grains with different sizes were obtained from fine-grained sandstones (Fig. 9), as there are more sand grains per volume in fine-grained sediment despite the comparable content of Zr. The size and shape parameters of each dated zircon were measured calculating the equivalent spherical diameter (ESD) with the aim of investigating age–size relationships (Malusà et al. Reference Malusà, Carter, Limoncelli, Villa and Garzanti2013). Figure 9 shows that the age distribution is not dependent on ESD, indicating that the recorded zircon ages are representative of the whole zircon population both in fine- and coarse-grained sandstones.
Equivalent spherical diameter (ESD) of zircon grains vs detrital zircon ages in coarse- and fine-grained sandstones. ESD is the cube root of the product of lengths of the three axes of zircon grain; in thin-section the intermediate axis was approximated to the short one (Malusà & Garzanti, Reference Garzanti2019). The distribution of ages is independent of the grain size of zircons.

Fifty-eight zircon crystals were accurately chosen from six samples of sandstones on which 69 valid 206Pb/238U ages with percentage of discordance <±10 %, and 20 data with percentage of discordance ≥10 % were collected (Table X in the Supplementary Material available online at https://doi.org/10.1017/S0016756820000886). One age in the GOR 28 sample results was older than 1.4 Ga, so the 207Pb/206Pb age was considered (Table X in the Supplementary Material available online at https://doi.org/10.1017/S0016756820000886). In the following, the detrital zircon ages in each sample are described from the bottom (Log1) upwards (Log2 and Log3). The best zircon ages (Spencer et al. Reference Spencer, Kirkland and Taylor2016) in each sample are listed in Table 2.
U–Pb zircon concordant ages in million years (Ma) measured in each sample.

The GOR1 sample comes from Log1 (Fig. 4a), contains 75 ppm of Zr and has coarse-grained size, resulting in the least production of zircon. Only two crystals were suitable for dating; they produced four valid ages at 1036 ± 20 Ma, 1039 ± 20 Ma (zrn 7 in Fig. 10), 290 ± 5 Ma and 294 ± 5 Ma (zrn 8 in Fig. 10). These zircons show residual idiomorphic shapes and homogeneous luminescence without evident internal textures. Undated zircons (with many inclusions or fractures) of this sample show regular idiomorphic habitus and an oscillatory sector zoning (Fig. 10) typical of magmatic growth (Corfu et al. Reference Corfu, Hanchar, Hoskin, Kinny, Hanchar and Hoskin2003).
VPSE zircon images in GOR1 sample. Red and dark circles on zircon images indicated the spot location of 206Pb/238U ages with probability of discordant <±10 % and ≥±10 %, respectively; small red circle indicates spot of 10 µm, large red circle states spot of 20 µm. The numbers represent the U–Pb ages in million years (Ma). The notches under the label of the crystals measure 20 µm.

The GOR30 sample derives from Log2 (c. 15 m above GOR1 Fig. 4b) which is characterized by thin arenite strata interbedded with recurrent pelitic levels. It was the most zircon-productive sample (Fig. 11). Eighteen crystals produced seventeen discordant data (Table X in the Supplementary Material available online at https://doi.org/10.1017/S0016756820000886) and twenty concordant 206Pb/238U ages (Table 2). The valid ages can be subdivided into three distinct groups (Fig. 11): (1) four ages ranging from 669 ± 14 Ma to 445 ± 8 Ma (Table 2) were determined on sub-euhedral or rounded grains showing homogeneous luminescence (zrn 1 and zrn 34 in Fig. 11) or ghost oscillatory zoning (zrn 30 in Fig. 11); (2) twelve ages from 319 ± 7 Ma to 223 ± 6 Ma were measured on euhedral crystals showing both a rhythmic oscillatory zoning growth in continuity from core to rim (zrn 5, zrn 2, zrn 8, zrn 17 in Fig. 11) and sector zoning due to rapid change in kinetic factors during their crystallization (e.g. zrn 3 in Fig. 11); two ages of this cluster (265 ± 7 Ma and 268 ± 7 Ma) were determined on a low-luminescence crystal without evident internal structures (zrn 21 in Fig. 11), and two ages (244 ± 6 Ma and 223 ± 6 Ma) on two zoned crystals with inclusions (zrn 10 and zrn 17 in Fig. 11); (3) four very young ages ranging from 25 ± 1 Ma to 23 ± 1 Ma were obtained on two large euhedral zircon crystals showing a clear magmatic zoning (zrn 16 and zrn 20 in Fig. 11). These ages could indicate that the sediment was deposed after c. 24 ± 1 Ma.
VPSE zircon images in GOR 30 sample. Symbols as Fig. 10.

The GOR4 sample comes from the lower part of Log3 c. 10 m above GOR30 (Figs 4b and 5a). This sample gives six datable zircon grains producing eight concordant ages ranging from 697 ± 12 Ma to 295 ± 5 Ma (Fig. 12). The ages ranging from 697 ± 12 Ma to 460 ± 8 Ma correspond to relict cores of rounded and crushed zircons (e.g. zrn 1bis and zrn 5 in Fig. 12); one Permian age at 295 ± 5 Ma was measured on a broken and homogeneous luminescent grain (zrn 3 in Fig. 12).
VPSE zircon images coming from GOR 4 sample. Symbols as Fig. 10.

Three metres above, the GOR28 sample (Fig. 5a) provided thirteen zircon grains on which fifteen concordant ages and two ages with U–Pb discordance ≥10 % (Table X in the Supplementary Material available online at https://doi.org/10.1017/S0016756820000886) were measured. One age >1.4 Ga (zrn 9 in Fig. 13) was derived from the 207Pb/206Pb ratio and corresponds to 2594 ± 65 Ma (Table X in the Supplementary Material available online at https://doi.org/10.1017/S0016756820000886). Eight ages ranging from 1105 ± 19 to 457 ± 8 Ma are relative to relict portions of homogeneous luminescent crystals, and six ages ranging from 332 ± 6 Ma to 303 ± 6 Ma have been detected on grains showing a ghost sector zoning (zrn 7, zrn 5, zrn 22 in Fig. 13).
VPSE zircon images in GOR 28 sample. The age 2594 ± 65 Ma on zrn 9 derived from 207Pb/206Pb ratio being >1.4 Ga (Gehrels et al. Reference Gehrels, Blakey, Karlstrom, Timmons, Dickinson and Pecha2011). Symbols as Fig. 10.

In the upper part of Log3 (Fig. 5a), two samples have been considered. In the GOR18 sample six zircon grains provide ten concordant ages (Fig. 14). Oldest ages at 776 ± 8 Ma, 678 ± 8 Ma and 576 ± 8 Ma were detected on a rounded crystal having a very complex and convoluted zoning (zrn 1 in Fig. 14), similar to zrn 23b with age 709 ± 13 Ma. Three ages at 464 ± 9 Ma, 453 ± 9 Ma and 420 ± 8 Ma are relative to homogeneous luminescent domains (zrn 21 and zrn 23a in Fig. 14), and three ages at 331 ± 6 Ma, 283 ± 5 Ma and 274 ± 5 Ma were measured on euhedral crystals showing a cloudy oscillatory zoning (zrn 22 in Fig. 14).
VPSE zircon images in GOR 18 sample. Symbols as Fig. 10.

Immediately overlying (Fig. 5a), the GOR26 sample was productive, with thirteen datable zircon crystals (Table X in the Supplementary Material available online at https://doi.org/10.1017/S0016756820000886) producing thirteen concordant ages (Table 2; Fig. 15). Five of these, ranging from 478 ± 9 Ma to 406 ± 7 Ma, were measured on five grains without evident internal textures (zrn 4 and zrn 5 in Fig. 15) or with apparent oscillatory zoning domains (zrn 3 and zrn 13 in Fig. 15). Eight concordant ages varying from 332 ± 6 Ma to 293 ± 5 Ma (Fig. 15) are relative to seven prismatic and euhedral zircons (zrn 12 in Fig. 15) displaying homogeneous luminescence (zrn 10 in Fig. 15) or ghost magmatic zoning (zrn 14, zrn 7, zrn 1 in Fig. 15).
VPSE zircon images in GOR 26 sample. Symbols as Fig. 10.

8. Discussion
The petrographic and chemical characters of sandstones indicate the provenance of detritus but sometimes the deductions can be ambiguous, so the records deriving from U–Pb detrital zircon ages add further constraints. In the following a discussion about the origin of GF sandstones is illustrated.
8.a Composition of detritus source
The quartz–feldspathic composition of the sandstones and the presence of abundant lithics as granitoids, phyllites, micaschists, gneisses and sporadic volcanic fragments can be connected with the break-up of metamorphic basement formed by low- to medium-grade metamorphic rocks intruded by granitoids on which a sedimentary cover with volcanic activity was laid down. On the other hand, the presence of carbonate-rock fragments (limestones and micritic clasts) and rearranged fossils suggests that even carbonate marine deposits are a candidate for the basin filling. The small compositional difference between the fine- and coarse-grained sandstones depends on depositional mechanism; in fact, in the fine-grained laminated levels there are more abundant micas and carbon residues, whereas in the coarse-grained strata with massive texture, quartz and feldspars prevail. The petrographic and chemical composition of sandstones indicates that the sources are to be found in an area where a crystalline basement formed by prevalent granitoids and metamorphic rocks covered by carbonate and siliciclastic rocks was present. The Alpine chain constituting the Calabria–Peloritan Arc in which widespread portions of Variscan basement are stored may have been a feeding area, although without the volcanic component (Critelli et al. Reference Critelli, Muto, Perri and Tripodi2017;Critelli, Reference Critelli2018); even if, according to Guerrera et al. (Reference Guerrera, Martín-Martín and Tramontana2019), volcanic centres may also have been settled on the Meso-Mediterranean Microplate, essentially formed by a fold–thrust Alpine belt. Even the Sardinia–Corsica (pro-part) block formed by Variscan basement without alpine tectonism, but characterized by Cenozoic volcanic activity, could be a suitable source area (Fig. 1).
8.b Ages of detritus source
Among the concordant ages measured on detrital zircons, collected along the three study sections, 48 % of grains are represented by old ages on inherited zircon cores showing complex and perturbed zoning (Figs 10–15 and 16a; Table 2). One Neo-Archaean age (2594 ± 65 Ma from 207Pb/206Pb ratio) was measured on a relict grain. Five ages from 1039 ± 19 Ma to 776 ± 8 Ma are relative to Tonian signatures, eight ages clustering at 672 ± 28 Ma (Fig. 16a) correspond to the Cryogenian period and only two ages (576 ± 8 Ma and 591 ± 11 Ma) are Ediacaran (Fig. 16a; Table 2). Eighteen ages vary from Ordovician to Silurian except one Lower Devonian age (406 ± 7 Ma) and produce a cluster at 458 ± 9 Ma (Fig. 16a; Table 2). The Variscan basements actually dispersed in the Mediterranean area with records of Neo-Proterozoic and Ordovician–Silurian geological events are the Sardinia–Corsica (pro-part) block and the Calabria–Peloritan Arc, the last involved in the Alpine orogenesis.
Histograms with Kernel density estimates (Vermeesch, Reference Vermeesch2012) of the U–Pb zircon ages in coarse- and fine-grained sandstones distinguishing the older ages (a) by the Chattian ages around 24 Ma from the GOR 30 sample (b).

The maximum frequencies of Ordovician–Silurian ages were detected in orthogneisses and amphibolites derived from acidic plutonic and basic volcanic rocks in Sardinia (Franceschelli et al. Reference Franceschelli, Puxeddu and Cruciani2005 and references therein; Helbing & Tiepolo, Reference Helbing and Tiepolo2005), whereas the magmatic protoliths of Variscan orthogneisses and metabasites from the Calabria–Peloritan Arc show an Ediacaran age peak (562–526 Ma) more like African plate terranes than European ones (Micheletti et al. Reference Micheletti, Barbey, Fornelli, Piccarreta and Deloule2007; Fornelli et al. Reference Fornelli, Langone, Micheletti and Piccarreta2011, Reference Fornelli, Piccarreta, Micheletti and Mörner2014; Williams et al. Reference Williams, Fiannacca, Cirrincione and Pezzino2012; Fiannacca et al. Reference Fiannacca, Williams, Cirrincione and Pezzino2013).
The comparison of pre-Carboniferous detrital zircon ages of Gorgoglione sandstones with similar ages from crystalline basements of the Mediterranean area (Fig. 17) displays a better analogy with the Sardinia–Corsica block than with the Calabria–Peloritan Arc, being the Ediacaran ages (two ages at 576 ± 8 Ma and 591 ± 11 Ma) poorly represented among detrital zircons in contrast with the widely found Ordovician–Silurian ages that are well represented in the Sardinia–Corsica domain. The small Cryogenian peak at 672 ± 28 Ma corresponds to inherited crushed zircon cores (e.g. Figs 12 and 14) diffused in many Variscan basements formed by assemblage of Pan-African terranes (Micheletti et al. Reference Micheletti, Barbey, Fornelli, Piccarreta and Deloule2007), therefore the Cryogenian ages give ambiguous signs.
Age distribution within the selected crystalline basements in the Mediterranean area. (1) Schaltegger & Corfu, Reference Schaltegger and Corfu1992; (2) Bussy et al. Reference Bussy, Péronnet, Ulianov, Epard and Von Raumer2011; (3) Pinarelli et al. Reference Pinarelli, Bergomi, Boriani and Giobbi2008; (4) Paquette et al. Reference Paquette, Ménot, Pin and Orsini2003; (5) Casini et al. Reference Casini, Cuccuru, Maino, Oggiano and Tiepolo2012; (6) Alagna et al. Reference Alagna, Peccerillo, Martin and Donati2010; (7) Oggiano et al. Reference Oggiano, Gaggero, Funedda, Buzzi and Tiepolo2010; (8) Pavanetto et al. Reference Pavanetto, Funedda, Northrup, Schmitz, Crowley and Loi2012; (9) Helbing & Tiepolo, Reference Helbing and Tiepolo2005; (10) Williams et al. Reference Williams, Fiannacca, Cirrincione and Pezzino2012; (11) Fiannacca et al. Reference Fiannacca, Williams, Cirrincione and Pezzino2013; (12) Trombetta et al. Reference Trombetta, Cirrincione, Corfu, Mazzoleni and Pezzino2004; (13) Schenk, Reference Schenk1980; (14) Langone et al. Reference Langone, Caggianelli, Festa and Prosser2014; (15) Micheletti et al. Reference Micheletti, Barbey, Fornelli, Piccarreta and Deloule2007.

Many age data (46 %) of detrital zircons from Gorgoglione sandstones result in Carboniferous–Permian ages ranging from 332 ± 6 Ma to 265 ± 7 Ma, except for two ages at 244 ± 6 Ma and 223 ± 6 Ma (Fig. 16a; Table 2). They form a large cluster at 297 ± 8 Ma (Fig. 16a). The majority of these ages were detected on magmatic zircons showing oscillatory zoning, but some ages were also measured on homogeneous luminescent zircons probably deriving from metamorphic rocks. Metamorphic and intrusive magmatic rocks having Carboniferous and Permian ages are diffused in eastern-central Sardinia and along the Calabria–Peloritan Arc; both these basements could represent the source area of detritus. In addition, the large amount of granitic and low- to medium-grade metamorphic fragments among the lithics of sandstones correlates well with the micaschists, phyllites, orthogneisses and granitoids forming the Sardinia basement and the Serre, Sila and Aspromonte massifs in Calabria and the Peloritani Mountains in Sicily. The Variscan basements play a key role in providing supplies to Middle Miocene basins. These basins are located, according to various authors (e.g. Alagna et al. Reference Alagna, Peccerillo, Martin and Donati2010; Critelli et al. Reference Critelli, Muto, Perri and Tripodi2017; Guerrera et al. Reference Guerrera, Martín-Martín and Tramontana2019), in the areas facing the front of the Alpine chain corresponding to eastward and southward subduction of the Tethys ocean basin beneath the Adria continental plate (Fig. 1). The Alpine metamorphism and magmatism took place during the Palaeogene (Eocene–Oligocene) and were concentrated in the Alpine area (northern Italy), in eastern Corsica and in some sectors of NW Calabria (Catena Costiera). The evidences of Alpine metamorphic and magmatic events are missing among detrital zircon ages from Gorgoglione sandstones, whereas the signatures of Variscan orogeny prevail, as also highlighted in Oligo-Miocene sediments of the Alps (Sharman et al. Reference Sharman, Hubbard, Covault, Hinsh, Linzer and Graham2018). Of the possible source areas of detritus in which the Variscan signatures prevail, the Sardinia–Corsica (pro-part) block seems the best candidate. Participation in the supply of detritus from Calabrian Arc portions cannot be excluded because, despite the evidence of alpine tectonic events in the Calabria continental crust, the isotopic system of zircons from the Variscan basement did not reset at the typical low temperatures of the Alpine metamorphism. Certainly, signatures of Alpine reworking rocks such as ophiolites and their metasedimentary covers are missing in the Gorgoglione sandstones.
Few but relevant young ages around 24 ± 1 Ma emerged in this study (Fig. 16b) on two large euhedral detrital zircons with clear magmatic textures (Fig. 11) from the lower portion of Log2 (GOR30 sample in Fig. 4b). Cenozoic magmatic activity in Italy is essentially related to the Alpine orogeny during the Eocene–Oligocene and to Apennine subduction in Chattian–Burdigalian times. Eocene–Oligocene magmatism is concentrated in the Alpine area, reaching its climax in the Oligocene (32–30 Ma), whereas the younger magmatic activity started around 28 Ma, reaching its peak at c. 21–18 Ma with calcalkaline and high-K calcalkaline products essentially restricted to western Sardinia (Alagna et al. Reference Alagna, Peccerillo, Martin and Donati2010). The Chattian detrital zircon ages (24 Ma) in the Gorgoglione sandstones, while representing a relatively minor constituent (6 % of zircon ages), were measured on large zircon crystals with evident magmatic growth zoning (Fig. 11); consequently their provenance seems related to volcanic activity on Sardinia–Corsica (pro-part) basement (Fig. 17) or to possible volcanic centres on the Meso-Mediterranean Microplate (Guerrera et al. Reference Guerrera, Martín-Martín and Tramontana2019). In addition, the occurrence of some rounded volcanic lithic fragments (Fig. 6e–g) and the lack of single euhedral minerals of volcanic origin indicate a recycling detritus, and the age of c. 24 Ma probably represents the maximum sedimentation age. Possibly, a major number of geochronological data in more samples along the section, together with more extensive bio-stratigraphic studies, could better constrain the meaning of these ages.
9. Conclusion
The sandstone detrital mode evolution represents a good method to reveal the filling dynamism of wedge-top basins related to fold–thrust belt tectonism and not least to infer provenance area indications. The major part of provenance studies on Oligocene–Miocene turbiditic sandstones from the Southern Apennines indicate that the source terranes are in the Calabria–Peloritani Arc, except for some volcanoclastic detritus having a Sardinia provenance (Critelli, Reference Critelli2018). The petrographic and chemical features of Gorgoglione sandstones, together with U–Pb detrital zircon ages, have proven to be a more powerful method to better constrain their source area. The peaks of age clusters at 672 ± 28 Ma, 458 ± 9 Ma and 297 ± 8 Ma and the few ages around 24 Ma (Fig. 16) suggest that the main source area of the study sandstones can be traced back to the Sardinia–Corsica (pro-part) block in which Ordovician–Silurian (485–419 Ma) and Carboniferous–Permian (358–254 Ma) magmatic and metamorphic rocks and Chattian volcanites occur, without Ediacaran signatures of zircon ages corresponding to the range 562–526 Ma (Fig. 17). On the other hand, the orthogneisses of the Calabria–Peloritan Alpine Chain marked by zircon ages around 540 Ma (Fig. 17) are uncommon in the study sandstones (only two ages at 576 ± 8 Ma and 591 ± 11 Ma have been found). The provenance of Gorgoglione sandstones from a crystalline basement identifiable as the Sardinia–Corsica (pro-part) block encourages new palaeogeographic reconstructions for Miocene sedimentary basins in the Mediterranean area to depict the evolution of Apennine orogen.
Supplementary material
To view supplementary material for this article, please visit https://doi.org/10.1017/S0016756820000886
Acknowledgements
The editor-in-chief, an anonymous referee, S. Critelli and G. Sharman are deeply thanked for suggestions that significantly improved the paper. This research was funded by “Aldo Moro” Bari University; grand n. 00596609 ricat 01.