


Introduction
Forecasting an avalanche hazard can be done by estimating the snow-cover stress held, which is related to snow thickness, density, shear and tensile properties and a dry-friction coefficient. If values of these parameters are known at any point on a snow slab, we can compute the stress field and determine potentially dangerous zones where the stress exceeds its threshold value.
Such a simple scheme is rarely applied to predicting an avalanche or to pinpointing dangerous zones in a deterministic manner. The reason is that the spatial variability of snowpack parameters is significant and, in practice, cannot be estimated with sufficient accuracy. This fact suggests the use of probabilistic methods, where the probability of density and covariancc of snowpack parameters are used instead of their exact values. In previous work (Reference Chernouss and FedorenkaChernouss and Fedor-enko, 1997), we undertook a numerical experiment considering snowpack thickness, cohesion and friction coefficients, and snow density as random values. It was not easy to interpret the results obtained because of the effect of multiple factors. In this study, we concentrate only on investigating the influence of random snowpack thickness to demonstrate the applicability of a probabilistic approach per se.
Problem Formulation
The aim of our work is to determine snow pack stability on an arbitrarily shaped mountain slope, calculating the stress field within a three-dimensional snowpack. This is a very time-consuming task. However, as has been shown previously (NcfcdYcv and Bozhinsky, 1989), the three-dimensional analysis may be reduced to a two-dimensional problem if the mechanical parameters of snow depend weakly on snow depth. In this case, the theory of equilibrium of thin shells can be applied.
The most appropriate coordinate system for this problem is a local orthogonal unit with vectors e1, e2, e3, where e1 and e2 are tangential to the two lines of curvature at any point of the surface and e3 = e1 x e2 (Reference LoveLove, 1944). We assume that all points of the surface are non-umbilical and so at any point two distinct curvature lines exist. Under such assumptions, the stress field in the snowpack is governed by a simple system of partial differential equations expressing the equilibrium of a thin elastic shell (Nefeciyev and Boz-hinsky, 1989);

where eg is a unit vector representing the gravitational force direction, s1|s2 the curvature coordinates, h = h(s1, s2 the snowpack thickness measured perpendicularly to the slope surface, σi,j the stress tensor, i,j= 1,2, p the snow density, g the gravitational acceleration and cos α1 and Cos α2 the directional cosines of the displacement vector u. Note that cos α1 = Cos α2 if and only if |u| = 0. Ffr is the absolute value of the friction force between the snowpack and underlying surface. C is the coefficient of cohesion. f is the coefficient of friction, and N is the normal pressure of the snowpack on the underlying surface. Equations (1) should be complemented by adding a system of linear equations which couples strains and stresses in the snowpack

where E is the Young's modulus and v is the Poisson ratio. According to Reference Nefed'yev and BnzhimkiyNefed'yev and Bozhinsky (1989) this system of equations must be solved with the Dirichlet boundary conditions Ur = 0, where T is the boundary of the snowpack surface.
In order to solve this set of equations, all snow parameters have to be specified. Many field experiments reveal a large spatial variability of the snow depth h which suggests a stochastic description of this parameter. Other parameters, such as p and C, can also be considered as random but their variability is usually less than the variability of ft (Reference FohnFohn, 1989). Since Equations (1) contain derivatives of h, it is expected that the spatial random variation of h will affect the solution more than the variations of p and c. Specifically, in this study, the snow thickness is represented as an inhomogeneous Gaussian spatial-random field with a predetermined covariancc, which is obtained by field measurements.
The calculated displacement u and stress tensor σi,j also become stochastic. Our aim is to find different statistical moments, like the probability P(σ(x,y) > σthres;x,y) to exceed some threshold value σthres of stress at every point in the snowpack. The stochastic solution to the problem considered in this study is obtained by a Monte-Carlo simulation scheme. According to this scheme, Equations (1) and (2) are solved for a large number of realizations of h(s1, s2)-From the large number of deterministic solutions for these realizations, any desired statistical moment can be obtained.
Preprocessing
Because of the extreme requirement for computational speed, we chose a finite-difference technique for solving Equations (1) and (2) numerically. The first step was to generate a mesh of lines of curvature and build a random field of snowpack thickness with Gaussian distribution and prescribed covariancc. As assumed, the slope surface z = z(x,y), where x,y,z are Cartesian coordinates, does not contain umbilical points. The lines of curvature in this case may be found by solving the ordinary differential equations (Reference Korn and KornKorn and Korn, 1968)

where

In practice, a mountain slope is represented as a discrete set of samples (xi, yi, zi). To calculate the coefficients of E to N of Equation (3), the mountain slope in the vicinity of a possible avalanche Starting zone should be interpolated or approximated, for example, by a cubic surface. The pair of Equations (3) may then be solved easily by the adaptive Runge Cutta method (Reference Press, Flannery, Teukolsky and VetlerlingPress and others, 1992).
As assumed above, the fluctuating component of the snowpack thickness h(s1, s2) has a normal distribution and covariance 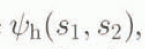 , which is obtained from field measurements. The realization of the snowpack thickness
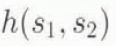 is a sum of regular
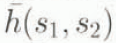 and fluctuating
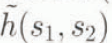 components,
 Here, we assume that the regular term varies much more slowly than the fluctuating one. The regular Ierm may be found from direct measurements of snow thickness at the control points on the slope Hi, i=1, ... ,M, where M is the number of control points on the considered slope. To build a random field with such properties we perform the following steps:
Generate the Gaussian δ correlated spatial random field 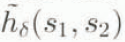 with zero mean and given variance.
Transform the generated random field 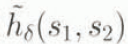 from the space domain to wave-number domain by the two-dimensional fast Fourier transform (Reference Press, Flannery, Teukolsky and VetlerlingPress and others, 1992).
Transform in a similar manner the covariance 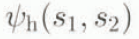 to its power spectra
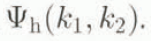 .
Fit 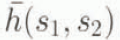 to snow thickness data Hi
obtained by direct measurements.
Build the fluctuating component 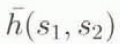 in a space domain by inverse Fourier transform of the function
 and calculate the desired field
 .
These operations yield a mesh of curvature lines and a random field of snow thicknesses conforming both with the existing covariance 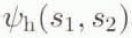 and measured values Hi.
Some Results and Discussion
The main goal of this study was to demonstrate the applicability of the probabilistic approach and to improve our understanding of stochastic behavior of the stress field in the snowpack with a random component of the thickness. The ultimate goal is to identify slopes which may be dangerous. For our simulation we took avalanche start-zone number 46 (Fig. 1) at the quarry of “Apatil” JSC in the Khibiny mountains, Kola Peninsula. The contoured part of the slope was substituted with a cubic surface, where the rms fitting error was about 2.1m. The grid of lines of curvature used in the finite-difference simulation was evaluated by the Runge-Kut-ta method (Reference Press, Flannery, Teukolsky and VetlerlingPress and others, 1992). The regular term of snow thickness (Fig. 2) was found by the program “surface” that is a component of generic mapping tools (GMT) software (Reference Wessel and Smith.Wessel and Smith, 1995). The fluctuating part of the snow thickness was calculated using the empirical covariance  obtained from long scries of field measurements in Khibiny (Reference Chernouss and SivardiereChernouss, 1995). We chose typical values of snow density p = 300 kg m-3, coefficient of cohesion c = 2000 Pa, coefficient of friction f = 0.4 and σthres
= 2000 Pa, v = 0.3, E = 107 Pa.
The geometry of avalanche starting zone No. 46 at the quarry of the “Apatil” JSC in Khibiny mountains, Kola Peninsula. Numbered triangles on the slope surface denote the points where the snow thickness has been observed. The thick solid line indicates the boundary T where the condition ut=0 is applied.

Isolines of the regular term h(x, y) in m of snow thickness (solid) and the steep-slope topography in m a.s.l. (dashed). Slope angles vary from 20° to 43°.

The results of stochastic modeling are shown in Figure 3. The most important result of our simulations is that the probability of avalanche release depends on snow thickness. At the upper part of the avalanche start zone, where the snow slab is thickest, the excedance probability P(σ > (σthres) appears to be much larger whereas the slope geometry is quite similar. This result is expected and substantiates the validity of the method. Using our simulation method, it is possible to obtain other quantities, such as the density function of the probability of avalanche-release occurrence at any point on the slope. At present, it is beyond the scope of our work to forecast the time and place of avalanche release, even if this were feasible, since we do not have sufficient knowledge of the snow parameters.
Preliminary results of simulation. The columns present the spatial distribution of the probability P(σ(T(x, y) > (σthres; x,y). The maximum value of probability is 0.21, the minimum is 0.012. The values of P(σ > σthres) less than 0.01 are not shown.

Our experience testifies to the efficiency and good convergence of the finite-difference scheme on regular slopes that do not include umbilical points and lines of inflection. The demand for regularity may be a serious limitation of this scheme, since the surface of a real slope often contains singularities and hence numerical difficulties arise while building the model mesh. A possible way of avoiding this limitation is to use the finite-element method to solve Equations (1) and 2) numerically.
In order to introduce the proposed method for estimating avalanrhe-relcasc probability for avalanche forecasts, it has to be verified beforehand using the available data. Since we obtain statistical values as an output of our simulation, the raw data should be statistically processed in order to obtain comparable data. The database and the necessary software are currently in preparation at the Centre of Avalanche Safety of the “Apatit” JSC.



