

Candidates with higher levels of media coverage are more easily recognized by voters at the ballot box and are therefore likely to have a higher chance of getting elected (Goldenberg and Traugott Reference Goldenberg, Traugott and Vermeer1987). In a context of increasing personalization (Karvonen Reference Karvonen2010), media-centered campaigns (Norris Reference Norris2000), and declining partisan attachments (Dalton and Wattenberg Reference Dalton and Wattenberg2000), the media can play a crucial role in campaigns and news coverage of a candidate that could make a difference to electoral success when voters are making up their minds later in the campaign (see Dalton Reference Dalton2012 on the German electorate, for example). Candidates must rely on the news media to get their message out to voters, and biases in the amount or type of news coverage can influence the perceptions of voters and the viability of candidacies. If women are covered differently than male candidates in the media—and research demonstrates this is the case (for example, Kittilson and Fridkin Reference Kittilson and Fridkin2008)—this is a potential barrier to their electoral success and could explain the underrepresentation of women.
However, little attention has been paid to the logic behind these claims of stereotyped coverage. The underlying causes of the gender gap in coverage can be due to either bias in the media (a media logic) or to the selection and placement of candidates by political parties (a party logic). Furthermore, the lack of comparative research (with the notable exception of Kittilson and Fridkin Reference Kittilson and Fridkin2008) has meant that it is has been difficult to investigate how electoral systems and candidate selection contribute to the coverage of female candidates. These questions are even more relevant, as some scholars have failed to find a gender bias in candidate coverage (see, for example, Hayes and Lawless Reference Hayes and Lawless2013; Heldman, Oliver, and Conroy Reference Heldman, Sarag and Conroy2009; Smith Reference Smith1997; Uscinski and Goren Reference Uscinski and Goren2011) while others do find gendered patterns in media coverage (for example, Gidengil and Everitt Reference Gidengil and Everitt2000; Heldman, Carroll, and Olson Reference Heldman, Carroll and Olson2005).
The majority of this past research has not concentrated on the possible mechanisms leading to biased coverage because studies have been based on data from one country and one election only where there is minimal variation in factors such as candidate selection and electoral systems. Also, these studies tend to aggregate indicators of coverage by gender of the candidate, and therefore it is impossible to control for other factors that may influence media coverage, such as electoral viability, and those factors are thus omitted from the analysis. Moreover, much of the previous literature has also assumed that media coverage is biased if women and men fail to receive equal amounts (and similar type) of coverage, whereas one could argue that to demonstrate gender bias in candidate coverage we need to compare female and male candidate who are alike in other characteristics that determine the amount and type of media coverage.
Therefore, the central aim of this of this article is not only to examine potential differences in the news media coverage male and female candidates receive, but also to investigate what affects candidates’ news media coverage and how the effects of traditional predictors, such as incumbency, candidate's party-determined electoral viability (list position), and party's electoral standing, vary depending on candidate's gender. Using 2009 European Election Study's Media Content Data (Schuck et al. Reference Schuck, Xezonakis, Banducci and de Vreese2010), which includes candidate level data on media coverage from 25 European Union member states, we investigate how varying institutional settings affect individual differences in the amount of news media coverage in such a large number of countries. Despite the second-order nature of these elections, we argue that these are appropriate for examining media coverage. Importantly, our data allow us to develop a candidate-based, rather than party- or country-based approach that enables us to take into account candidate characteristics as well as party and country characteristics that would influence the amount of media coverage a candidate receives. Our results do suggest that parties play a role in any gender differentiation in media coverage as political parties tend to not put forward women candidates in viable positions. We show limited evidence that the media are to blame for any lack of coverage. The results on tone of coverage are more nuanced in that male candidates, on balance, receive more negative coverage but are less likely to be evaluated overall.
WOMEN CANDIDATES’ COVERAGE IN THE NEWS: A MEDIA OR PARTY LOGIC
The current record of evidence of gender biased candidate coverage is mixed. Several scholars show that during the American Senate races (Kahn and Goldenberg Reference Kahn and Goldenberg1991), Republican primaries (Heldman, Carroll, and Olson Reference Heldman, Carroll and Olson2005, Meeks Reference Meeks2012), Canadian general elections (Gidengil and Everitt Reference Gidengil and Everitt2000), British general elections (Ross et al. Reference Ross, Evans, Harrison, Shears and Wadia2013), and European Elections (Banducci et al. Reference Banducci, Karp and Kittilson2007) male candidates receive more coverage than their female contenders. Not only the amount of coverage that varies, but also the type of stories in which women and men candidates appear and the tone of coverage they receive (Bystrom, Robertson, and Banwart Reference Bystrom, Robertson and Banwart2001; Gidengil and Everitt Reference Gidengil and Everitt2000; Heldman, Oliver, and Conroy Reference Heldman, Sarag and Conroy2009; Heldman, Carroll, and Olson Reference Heldman, Carroll and Olson2005; Kahn Reference Kahn1994; Kahn and Goldenberg Reference Kahn and Goldenberg1991; Uscinski and Goren Reference Uscinski and Goren2011).
However, other scholars find that female candidates do not receive differential news media coverage (see, for example, Bystrom et al. Reference Bystrom, Robertson and Banwart2001; Kittilson and Fridkin Reference Kittilson and Fridkin2008; Smith Reference Smith1997), and Heldman, Oliver, and Conroy (Reference Heldman, Sarag and Conroy2009) report that Sarah Palin received more coverage than any other vice presidential candidate in the 2008 U.S. presidential campaign. While these scholars fail to find a gender gap in the amounts of candidate coverage, all of these studies show how stories featuring women are different from stories featuring male candidates (Bystrom et al. Reference Bystrom, Robertson and Banwart2001; Heldman, Oliver, and Conroy Reference Heldman, Sarag and Conroy2009; Kittilson and Fridkin Reference Kittilson and Fridkin2008). The most recent and comprehensive account of U.S. congressional elections, however, questions the use of gender stereotypes in coverage of female candidates and finds that bias both in terms of the amount of coverage and stereotypes does not exist in contemporary congressional elections (Hayes and Lawless Reference Hayes and Lawless2013).
While the most recent literature has moved on to study gendered mediation and the differences in the type and tone of media coverage of highly visible and prominent candidates, such as Hillary Clinton and Sarah Palin in the 2008 U.S. presidential race (see, for example, Heldman, Oliver, and Conroy Reference Heldman, Sarag and Conroy2009; Lawless Reference Lawless2009; Uscinski and Goren Reference Uscinski and Goren2011), we are left with little knowledge of what influences the amount of news media coverage male and female candidates receive. In other words, we ask whether the difference in coverage is due to differences in the status of the candidates, as fewer women are less likely to be incumbents, and therefore differences in coverage are due to experience of candidates rather than any bias on the part of the news media. In trying to uncover the mechanisms that might explain any differences between coverage of male and female candidates, we suggest there is both a media logic and a party logic.
A media logic (Altheide and Snow Reference Altheide and Snow1979, Reference Altheide and Snow1991) suggests that news values dominate in the selection and presentation of political news. Rather than focusing on how media portray women, examining the logic behind the coverage, one would focus on how news values and journalistic practices might lead to gendered coverage. This logic recognizes that the news media (and journalists) are not passive conduits of political information but rather that editorial decisions are based on the values of journalists. These values include a commitment to informing voters but also maintaining audience shares (Zaller Reference Zaller1999). In order to maintain audience interest, news media might therefore focus on political leaders or on those candidates deemed more likely to win. We might also suggest that the values of journalists and editors may play a role in any gender bias in coverage. However, whereas there may be some differences in the sources male and female reporters cite when writing about a campaign (Freedman and Fico Reference Freedman and Fico2005), there is little evidence to suggest that bias in the editorial room (e.g., more male editors) influences coverage of female candidates (Craft and Wanta Reference Craft and Wanta2004). Furthermore, women candidates are no longer a novelty, and journalists may not necessarily revert to stereotypes in their reporting. Fowler and Lawless (Reference Fowler and Lawless2009) also caution us against interpreting significant candidate gender difference as being media driven and suggest that focusing on political context may yield a better understanding of the dynamics underlying differences in media coverage.
We also argue that a party logic takes as its starting point that the main goal of political parties is to win vote shares and office (Downs Reference Downs1957); therefore parties put forward the candidates who are likely to win, and this will, in turn, shape which candidates are covered in the media. Where other factors are equal, party selectors may be more likely to put forward male candidates assuming male candidates, based on past outcomes, have a greater likelihood of leading to electoral success. Political parties select candidates but also have varying degrees of control over their electoral list ranking, and list position may affect the amount of media coverage. While in majority/plurality systems parties determine individual candidate's viability by deciding which constituency she runs in, in PR list systems (with ranked electoral lists) parties determine individual candidate's viability by her electoral list standing. We expect that this party-determined candidate viability has a strong impact on the amount of news media coverage candidates receive. Therefore, if for example women were placed on the electoral lists less favorably than men, women's unfavorable election list rankings would make them less viable and more obscure to media attention.
EXPLAINING VISIBILITY OF WOMEN IN ELECTION NEWS COVERAGE
As this article studies candidate coverage in 25 different countries, it has the advantage of simultaneously studying the effect of individual-, party-, and institutional/contextual-level variables. Drawing on the distinctions between the media and party logic, we ask whether any noted differences in media coverage of male and female candidates is due to party-determined viability or if a gender bias exists even after we control for these factors and can be explained by cultural factors that are reflected in the media coverage of women. In addition to candidate factors, we argue that a range of factors influences media coverage at the country and party level, such as the voting system and the electoral strength of the party. In the next section, we develop a set of hypotheses drawing on electoral and party systems literature.
Political parties play a major role as gatekeepers to electoral office, and, as such, represent one of the barriers to women's representation (Kittilson Reference Kittilson2006) as well as an indirect influence on the amount of media coverage candidates receive. Parties are more likely to nominate women where there is less electoral risk or where they are least likely to displace male candidates (Duverger Reference Duverger1955, Lakeman Reference Lakeman, Rule and Zimmerman1994). Though this is changing, past research has shown that women are more likely to stand in unwinnable seats (Ryan, Haslam, and Kulich Reference Ryan, Haslam and Kulich2010) and appear further down party lists (Lühiste Reference Lühiste2015). Journalists may find it more efficient to cover viable candidates, and this suggests that we would expect greater coverage of men based on their greater likelihood of being viable candidates. This leads to our first hypothesis:
H1:
Viability increases the amount of news media coverage candidates receive.
If, once controlling for the effects of party-determined viability, any gap in the coverage between men and women is not significant, we would argue that media coverage is not biased but rather reflects strategic considerations of political parties in terms of candidate selection. That political parties are less likely to put women in electorally viable positions may reflect gender bias, ideological norms, or organizational structures in parties (Caul Reference Caul1999; Kittilson Reference Kittilson2006).
Other considerations are the electoral system and ballot structure. Strategic decisions about the selection and list placement of women candidates is largely structured by the type of electoral system or ballot structure (Matland Reference Matland1998). While all EU member states use a proportional electoral system to elect their representatives to the European Parliament, each country is free to choose the specific voting system. In proportional electoral systems voters are most commonly either asked to demonstrate their support to a specific candidate of a political party (preferential voting) or to a political party as a whole (closed and blocked party-list voting) when casting their ballots. Preferential voting systems vary from pure preferential systems with open list ballot structure (voters single-handedly determine the electoral success of individual candidates) to flexible preferential systems with ordered list ballot structure (voters are presented with ranked election lists, but, based on the amount of preference votes, these party-determined lists will be amended to a larger or smaller extent when translating votes to seats). We argue that the weight different voting systems put on candidates versus parties may influence where parties place female candidates, and this in turn will influence the news media's reaction to individual candidates.
In terms of how the media responds to individual candidates, whether the campaign coverage is more candidate or party centered may influence the attention media pay to women candidates in multiple ways. Past research suggests that in preference voting systems personal characteristics that mark a candidate as being distinct from others in her party can be seen as a potential advantage in gaining preference votes (Carey and Shugart Reference Carey and Shugart1995; Shugart et al. Reference Shugart, Valdini and Suominen2005). If the competition for news media coverage takes place not only between candidates from different parties but also between same-party candidates, such as in preference voting systems, one could argue that women could use their sex as the distinguishing personal characteristic for gaining more news media coverage. At the same time, in nonpreferential voting systems, media are likely to use more party-centered campaign coverage. In such a case, it is reasonable to assume that if media pay any attention to individual candidates, it covers the most prominent and viable candidates, and thus care less about other distinctive candidate characteristics, such as candidate sex. Based on this argument one would expect women to receive more news media coverage in preferential voting systems than in nonpreferential voting systems because in the former systems, there are likely to be more opportunities to use being a woman as a distinguishing feature when gaining media coverage. This leads to our second hypothesis:
H2:
Women are likely to have greater media visibility in preferential than closed list voting systems.
In some preferential voting systems party-list ranking matters too. Therefore, it could be that in different types of preferential voting systems (open versus ordered list voting systems) candidate gender has a differential effect on candidates’ news media coverage. In open-list systems, candidate sex and incumbency are likely to be the most distinctive features that allow candidates to distinguish themselves from one another, as party-list rankings have no effect on electoral outcomes. Therefore, in open-list systems women may receive more news media coverage because in most countries female candidates are more of a novelty than male candidates. Besides candidate sex and incumbency, however, in ordered-list systems media can use other indicators, such as candidates’ party-list rankings, when selecting who to cover and who not to cover.
H3:
Women are likely to have less coverage in ordered list voting systems.
As argued above, we expect the amount of news media coverage a candidate receives to be strongly affected by her party-determined viability. Previous research suggests that in ordered-list systems women suffer from less viable electoral list placements than women in closed-list systems (Lühiste Reference Lühiste2015). If party-determined viability is the central predictor of candidates’ news media coverage and women are less viable in ordered-list systems than in closed-list systems, it is likely that women also receive less news media coverage in ordered-list systems than in closed-list systems. Hence, we would witness an interaction effect of party-determined viability and voting system on women's individual news media visibility. Therefore, we pose a conditional hypothesis:
H4:
Viability will have a stronger influence on the amount of media coverage for women candidates in ordered-/preferential-list systems.
A final hypothesis tests for gender bias in the tone of coverage. We have focused on the amount of coverage that a candidate receives so far; however, there is also the possibility that the content varies between male and female candidates. Contrary to existing research on the amount of coverage, studies indicate that women candidates are not always disadvantaged. Past research has found that women have more positive coverage than men (Kahn Reference Kahn1994; Smith Reference Smith1997). The evidence regarding a female candidate advantage is more mixed when looking at more salient presidential elections (Heldman, Carroll, and Olson Reference Heldman, Carroll and Olson2005). Generally, given our focus on second-order elections, we hypothesize:
H5:
Female candidates will gain more positive coverage in tone than male candidates.
There is also a range of control variables to consider where we do not formulate hypotheses. In the European context, where political parties are the central players on the political arena, a candidate's personal viability is highly dependent on her party's electoral standing, too. Since previous literature suggests that accessibility to news media coverage depends on the electoral viability of both the candidate and her party (Ansolabehere, Behr, and Iyengar Reference Ansolabehere, Behr and Iyengar1991; Iyengar Reference Iyengar1990; Trimble and Sampert Reference Trimble and Sampert2004), it is reasonable to expect that, to a great extent, the variance in candidate coverage is explained by whether a candidate is a member of one of the front-running parties.
Besides the type of voting system, formal party rules are also likely to affect the amount of news media coverage female candidates receive. Candidate gender quotas are the most direct way to influence the gender composition within political parties and their election lists (Caul Reference Caul2001). However, candidate quotas do not always work as efficiently as planned. In fact, in most cases candidate quotas do not prescribe the position that women are to take in party lists, meaning that increasing the share of women among candidates does not necessarily increase their share among viable candidates (Krook Reference Krook2007; Matland Reference Matland and Dahlerup2006) and thus their likelihood of receiving more media coverage. This is why we distinguish between candidate quotas with placement mandate rule and candidate quotas that do not prescribe the position that women are to take in party lists. We expect that both legislative and voluntary party quotas would only be effective if they result in higher list positions for female candidates. In other cases they (quotas without placement mandate rule) are likely to remain ineffective.
At the same time, the impact of ballot structure, a party's candidate selection process (whether women are on the top of the list), and the use of candidate quotas might also have spurious effects. The fact that, in some countries, the press covers men and women candidates more equally and that political parties position both men and women as their top candidates can simply be an expression of overall gender equality in the society. Such expectations are also supported by previous research that argues that women experience greater political representation in countries where gender ideology is more equal (Matland Reference Matland1998; Norris & Franklin Reference Norris and Franklin1997; Paxton and Kunovich Reference Paxton and Kunovich2003; Schwindt-Bayer and Mishler Reference Schwindt-Bayer and Mishler2005). Considering all that, we expect women to gain more news media coverage in more gender-equal societies. We explore these additional effects in the analysis.
Finally, past research suggests that current office holders have better chances of gaining access to news media compared to their challengers (Kahn and Goldenberg Reference Kahn and Goldenberg1991). Media are likely to pay more attention to incumbent office holders because they have already proven that they are relevant candidates and thus can win a given seat. Giebler and Wagner (Reference Giebler and Wagner2010), however, point out that the incumbents might not always have the same impact on voters. They suggest that national candidates affect voters’ party choice more than European candidates during European Parliament elections (Giebler and Wagner Reference Giebler and Wagner2010). Therefore, the incumbency in the European Parliament might not serve as such a strong predictor of media coverage. Moreover, in the case of European Parliament elections, the incumbents are geographically “further away” from their voters and from the national media covering these elections. We use incumbency in the selection model (see below) to predict whether a candidate is included in our sample of candidates.
DATA, MEASUREMENT, AND MODELS: EUROPEAN PARLIAMENT ELECTIONS
For our analysis, we primarily rely on the 2009 European Election Study (EES) Media Content Data that covers news media outlets (both newspapers and broadcast) in the 27 EU member states from the 2009 election. The benefits of these data in evaluating the visibility of women candidates is that they have been collected across a large number of countries using the same coding rules in each country to assure comparability across countries (for more information, see Schuck et al. Reference Schuck, Xezonakis, Banducci and de Vreese2010). In addition to a large sample of candidates, the range of countries allows for an examination of contextual effects in terms of party and electoral system characteristics. Even though the same parties and even the same candidates participate, these are classified as second-order elections (Franklin Reference Franklin and Richardson2006; Reiff and Schmitt Reference Reif and Schmitt1980), which tend to be less salient in the media (de Vreese et al. Reference de Vreese, Banducci, Semetko and Boomgaarden2005).
Because European Parliament elections are second-order elections and generally produce higher levels of representation for women than national elections (Darcy, Welch, and Clark Reference Darcy, Welch and Clark1994; Ford and Dolan Reference Ford, Dolan and Whitaker1999; Kantola Reference Kantola2009; Matland and Studlar Reference Matland and Studlar1998), results may not be generalizable to first-order elections. Our results based on EP elections could prove “too positive” in the sense that we may overestimate women's news media coverage. However, our objective is not to predict the amount of news media coverage female candidates receive but rather to explain under which circumstances women are more visible in the campaign coverage. Hence, in order to enhance the generalizability of our findings it is important that the substantive relationships between our variables of interest do not vary between national and European Parliament elections. Generally, there is evidence that the factors associated with the representation of women in national legislatures also hold at second-order elections (Vengroff, Nyiri, and Fugiero Reference Vengroff, Nyiri and Fugiero2003). More recent work, however, suggests that electoral systems cannot explain the gap in women's representation between national and European levels (Fortin-Rittberger and Rittberger Reference Fortin-Rittberger and Rittberger2014). The latter findings suggest that our approach in focusing on individual-level candidate viability rather than country-level electoral rules alone may yield better explanations about media coverage.
Allowing for a comprehensive examination of the coverage of candidates, both newspapers and television news coverage were coded in each country. With at least two television news outlets (public and commercial) and at least three newspapers (two “quality” and one tabloid) per country, the total sample consists of 58 television networks and 84 different newspapers.Footnote 1 The time period covered is the three weeks prior to the election capturing the most intense period of campaigning for the elections. With regard to story selection for television, all news items have been coded. For newspapers, due to the number of stories in a daily newspaper, a smaller sample was drawn. All news items on the front page and all news items on one randomly selected page were coded. In addition, in order to capture all news about the elections, all stories pertaining particularly to the EU and/or the EU election on any other page of the newspaper have been coded (within political/news, editorial/opinion/comment, and business/economy sections) (Schuck et al. Reference Schuck, Xezonakis, Banducci and de Vreese2010). Because we measure the visibility of candidates in the news, our analysis is based on a subset of stories that mention the EP elections. Given the breadth of outlets and the three-week campaign period selected, our sample of stories includes most campaign-related news stories in major news outlets in each member state. As such, it should be a fairly representative picture of news media coverage in general. From this database of news stories, we code the mentions of MEP candidates (visibility) and how positively or negatively each actor was covered in the news. The tone of coverage of candidates is measured by asking raters how “favorably or unfavorably is the MEP (actor) evaluated (regardless of the source) from his/her own perspective (i.e., from the perspective of the candidate)?” The coders are trained that this evaluation must be explicit and should be expressed in terms that are clearly positive or negative judgements (e.g., “good,” “promising,” “ominous,” “disappointing”). Responses range from negative to positive on a five-point scale with a mixed or balanced evaluation being the midpoint. Where evaluations are not explicit, coding of tone is not made.Footnote 2 We have information on the tone of coverage only for 270 cases: these are candidates who were assigned an actor code and who actually received some media coverage.
Candidate Level Model
Unlike other cross-national studies on media coverage of women candidates, we propose a candidate-based analysis rather than a country- or party-based analysis. This allows us to account for important candidate characteristics such as incumbency as well as party and country level characteristics that could affect visibility. In order to build the candidate-based data set, we undertake two transformations. First, we transpose the unit of analysis from the news story to the candidate. The unit of analysis in the media content analysis was originally the story and within each story the most prominent six actors were coded along with their gender, whether or not the actor was quoted, and the evaluation (if any) of the candidate. This story-based data set is transformed into a data set where the candidate becomes the unit of analysis. To achieve a candidate-based data set, the story-based media data were transposed by transforming candidates (actors) from variables to cases. In this way, it is possible to calculate how many times each candidate was mentioned (the amount of coverage she gained), and run candidate-level models. Since the number of news stories covering MEP candidates varies from one country to another, we generated a standardized measure of candidate coverage by calculating the proportion of times a candidate was mentioned against the total number of times MEP candidates were mentioned in the news media in a given country (share of media coverage) and use this as the main dependent variable. As a result, the values of the standardized candidate coverage vary from “0” to “100,” indicating the percentage of total MEP coverage on a specific candidate in a given country. We also construct an indicator for the tone of coverage for each candidate taking the average tone across the stories that made an evaluation of the candidate.
Second, due to censored sample of candidates in the media content (i.e., we do not code the entire pool of more than 7000 MEP candidates), we build a database of all candidates for the EP election in order to examine selection effects. In the media coding, a list of the top 25% of MEP candidates was constructed, and these individual candidates were coded within the stories. While this represented a substantial proportion of candidates in stories, there were still some candidates who appeared in news stories but were not named on the list. Likewise, there are candidates not on the coding list who also did not garner any media attention. Therefore, our sample of candidates is censored because it does not include a large proportion of candidates who never received any coverage. We adjust for this by building a database with all MEP candidates (excluding parties and candidates who were not expected to exceed a minimum threshold of 2% of votes), including each candidate's sex, incumbency, party, party-list standing, and institutional and contextual variables. To these data, candidates’ individual media coverage from the media content data was linked. However, because not all candidates who received media coverage have a personal actor code, only media coverage of candidates who have their personal actor code can be linked to the individual level data set. Therefore, candidates whose media coverage is not coded to an individual actor but as “other X party MEP candidate” results in missing values in the candidate-level data set.
Therefore, whether or not a candidate has a value for the media coverage variable and whether such coverage was individually measured in the media content study depends on a nonrandom event of being assigned a personal actor code. However, it is important to keep in mind that the censored sample in the media data set is not only due to coding procedures. In fact, prior to the nonrandom selection in the media study, there was another event of nonrandom selection—how political parties rank-ordered their female and male candidates in the lists. This initial rank ordering determined which candidates were considered by the media study team as relevant candidates and thus assigned a personal actor code.
The two processes described above (selection of relevant candidates by the media study and placement of candidates on a party list) lead to a censored sample, and it then becomes important to establish the variables that explain selection into the sample of actors whose media coverage was captured in the 2009 media study before proceeding with individual-level analysis. Supplementary analysis demonstrates that women are less likely than men to have been assigned a personal actor code. However, when controlling for other possible selection variables, the effect of gender becomes insignificant, indicating that, once controlling for these other factors, there is no apparent bias in assigning actor codes to female candidates. Rather, it suggests that (a) women candidates may be placed less frequently in the most viable list positions (list leaders); (b) women are less likely to be incumbents than men, and/or (3) women run for less viable parties. As a result, the sample selection is explained by candidate's viability (list leader), incumbency, and her party's viability. However, due to other possible types of selection bias, we employ the Heckman selection procedure (Heckman Reference Heckman1979) when estimating our models.
A Heckman selection model estimates the probability of having a censored value on dependent the variable by using probit analysis for the full sample. It is important to note that the probit function is estimated on the entire sample of observations (all MEP candidates) whereas the regression analysis is performed solely on the subsample of observations (MEP candidates whose media coverage was measured in the media study). Therefore, the relationship of interest is a simple linear model:
 $${Y_i} = x{^{\prime}_i}\beta + u\; \; \; \; \; \leftarrow \hbox{outcome equation}$$
However, due to the censored sample, Y is only observed if a second, unobserved latent variable exceeds a certain threshold:
 $$z^{\ast}{_i} = {w_i}^{\prime}\alpha + {e_i};\; \; {\rm where}\; \; \; \; {z_i} = 1\ {\rm if}\ z^{\ast}{_i} \gt 0\comma\ {\rm and}\ {z_i} = 0,\ {\rm if \ otherwise}.$$
And therefore a probit selection function is used:
 $${\rm Pr}\left( {{z_i} = 1} \right) = \Phi \left( {\alpha ^{\prime}{w_i}} \right)\; \; \,\, \leftarrow {\rm selection \ equation}.$$
In other words, the modeling explained above uses the information on candidates without actor codes, too, when predicting the amount of news media coverage individual candidates receive. Because the data are hierarchical, utilizing individual-, party-, and country-level variables, we report robust standard errors adjusted for the clusters of countries.Footnote 3
Operationalization of Independent Variables
For our analysis there are two types of independent variables: selection variables (used in the selection model) and predictors of the outcomes of interest—media coverage. The selection variables explain selection into the media sample and are, therefore, related to the viability of the candidate (or placement on a list). The selection factors include candidate viability (list leader or not), incumbency, and the electoral viability of the national party for which the candidate is running. For candidate viability and incumbency we employ dichotomous variables. The electoral standing of the national party is operationalized by the share of votes the party received in the past national elections prior to the 2009 EP election and a dichotomous variable is used in the analysis (1 = party received more than 10% of the vote, 0 = party received less than 10% of the vote).A candidate's standardized list position is used to measure party-list ranking.
In addition to the above selection variables, we include factors set out in the theoretical section which are hypothesized to influence the level of media coverage received by candidates. We distinguish three types of voting systems: open-list preferential, ordered-list preferential, and closed-list nonpreferential voting system, with closed-list system being the baseline category.Footnote 4 We operationalize candidate gender quotas by constructing two dichotomous variables: gender quotas without placement mandates and gender quotas with placement mandates. Countries without gender quotas are the baseline category (see online appendix for operationalization). For measuring overall gender equality in society, we use the original gender equality index explained in the online appendix. The models also include a control variable for the size of constituency (1 = single constituency, 0 = multiple constituencies).
RESULTS
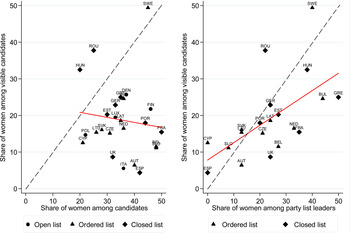
Before reporting the results of the candidate-based model, we first examine the extent to which any bias exists in the coverage of female candidates at the country level. The left-hand graph on Figure 1 shows the relationship between the share of female candidates in each member state and the visibility of female candidates in the news during the 2009 European Parliament election campaign. The dashed diagonal line represents a situation where the proportion of media coverage women candidates receive is equal to their share among all candidates. In the majority of countries female candidates gain proportionally much less media attention than we would expect given their share among candidates if there was no gender gap in news coverage. Moreover, the fitted line depicts a slight negative relationship between the proportion of women candidates and the coverage they receive in the news.
Gender differences in media coverage: 2009 EP elections. Source: 2009 European Election Media Study. Note: Figures display the proportion of elections news media coverage allocated to female candidates plotted against the proportion of female candidates in each country. The dotted diagonal line represents the expected relationship if no bias in coverage. The solid line represents the line of best fit when regressing the share of coverage on the proportion of candidates.

The most extreme examples of gender bias in news attention are Spain and Austria where women constitute around 40% of all candidates but receive only around 5% of the media coverage. On the contrary, women candidates in Hungary, Ireland, Romania, and Sweden enjoy more media coverage than their share among candidates would predict. Ireland and Romania both had one very prominent and controversial female candidate who received the majority of the media attention among women. For both Romania and Hungary, the representation of women at the European level far exceeds that at the national level (Chiva Reference Chiva2014), which may be linked to a greater amount of coverage for these “novel” candidates. In Sweden, which has only slightly more media coverage for women than would be expected, the pattern is consistent over time because Sweden was the most gender-equal country in terms of news media coverage of candidates in previous studies on European Parliament elections (see Banducci et al. Reference Banducci, Karp and Kittilson2007). Austria, where there are voluntary party quotas of 50% women, and Spain with a 40% legislative gender quota, demonstrate that the quotas increase the share of women as candidates but that this does not translate into greater media coverage.
The focus of this article is to establish whether male and female candidates who are similar in terms of experience receive different media treatment. Therefore, in the right-hand graph in Figure 1 we examine gender bias in media coverage among only those candidates who are list leaders. Comparing the two figures suggests that party-determined viability, where the candidate appears on the list, does affect women's news media coverage. Unlike the left-hand graph in Figure 1, the fitted line on the right-hand graph indicates a positive linear relationship between the proportion of women among list leaders and the proportion of media coverage they receive relative to male candidates. While not a perfect fit, the right-hand figure suggests that, when comparing like candidates, the gap between men and women's media coverage does narrow. Therefore, our initial examination of the data on women's media coverage relative to their proportion of candidates suggests that parties and their selection processes do lead to less coverage as the news media focus on list leaders. In particular, in countries such as Spain and Austria, the bias is considerably reduced when controlling for list leaders. However, for a number of countries, such as Belgium, France and the UK, there is still a substantial difference between the number of women list leaders and their visibility in the news coverage.
The initial look at the data in Figure 1 provides evidence of a gender gap in candidates’ news media coverage but also suggests that the gap in media coverage may not be as much about gender as it is about whether women are selected as the most viable candidates. In other words, there is a party selection bias with more men being selected as list leaders rather than strictly a media bias. In order to establish if the gap in media coverage is in fact about the selection and placement of candidates within party selection offices, our analysis proceeds by testing the same hypothesis with multivariate candidate level analysis where we control for candidate, party, and country-level factors that may affect the level of media coverage received by candidates.
Results of Candidate-Level Analyses
Our analysis proceeds in several steps. We first estimate models for all candidates (Table 1). Next we estimate the same effects in countries with open and ordered preferential lists where we can include an estimate of candidate viability or list position (Table 2). We then estimate a set of models with only list leaders in ordered- and closed-list systems (Table 3).We run this set of models (all candidates versus those in preference voting systems) because we are primarily interested in how the effects of viable candidacy explain women candidates’ news media coverage. Since there is no rank ordering of candidates by party gatekeepers in open-list systems, it is necessary to omit the cases from open-list systems to study how candidates’ party-determined viability affects their news media visibility. We also run separate models for male and female candidates and compare the differences of the coefficients with chi-square testsFootnote 5 because we expect different variances and effects for the two groups. Finally, we examine how the tone of coverage differs between male and female candidates (Tables 4 and 5). Given the small number of cases, we compare means rather than use a multivariate model.
Explaining candidates’ individual news media coverage

**p < 0.01; *p < 0.05; ***p < 0.10; robust standard errors (clustered by country) in parentheses. χ2 statistic indicates the difference between the estimates of the female candidate and the male candidate models.
Source: 2009 EP candidate lists; 2009 EES Media Content Study.
Explaining candidate visibility in preferential list systems
**p < 0.01; *p < 0.05; ***p < 0.10; robust standard errors (clustered by country) in parentheses. χ2 statistic indicates the difference between the estimates of the female candidate and the male candidate models.
Source: 2009 EP candidate lists; 2009 EES Media Content Study.
Explaining list leaders’ news media coverage in ordered and closed list systems

**p < 0.01; *p < 0.05; ***p < 0.10; robust standard errors (clustered by country) in parentheses. χ2 statistic indicates the difference between the estimates of the female candidate and the male candidate models.
Source: 2009 EP candidate lists; 2009 EES Media Content Study.
Tone of media coverage by candidate gender, viability and incumbency

Source: 2009 EP candidate lists; 2009 EES Media Content Study.
Tone of news media coverage by candidate gender and voting system
Source: 2009 EP candidate lists; 2009 EES Media Content Study.
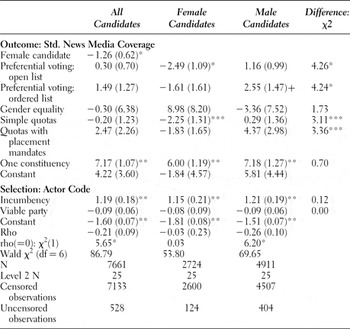
Table 1 summarizes the results of candidates’ individual media coverage across 25 EU member states (all three voting systems). For the selection model, we see that whereas party viability is in this case an insignificant selection variable, candidate incumbency is a strong positive predictor of the likelihood of having been assigned an actor code.Footnote 6 In terms of the second-stage model, we hypothesized above that there is no gender bias in the news media coverage of the 2009 European Parliament elections once taking into account party selection factors. We cannot control for list position (viability) in the set of models in Table 1 because we include an open-list system where the party does not order candidates. We do control for all other factors and see that female candidates, on average, receive less news coverage than male candidates. Given our outcome variable is the percentage of coverage candidates received, our estimated coefficient indicates that women receive, on average, 1.3% less coverage than men. Given the low saliency of these second-order elections in the news media, this small but statistically significant difference may yet still translate into greater name recognition for some candidates.
In this first set of models we have not controlled for viability so that we could treat this as a baseline test of gender bias in news coverage, and we see evidence of bias. Our second and third hypotheses test for differential impact of voting systems on female candidates. We hypothesized that women would have greater visibility in preferential than closed systems and less coverage in ordered-list systems. Women, contrary to expectations, receive less coverage in preferential systems when compared to closed systems. Preferential open-list systems have a negative and statistically significant effect on women's coverage. Female candidates receive, on average, 2.5% less news coverage in open-list systems when compared to closed systems. As hypothesized, there is a negative effect of ordered lists when compared to closed lists but this is not statistically significant ( H 3 ). On the other hand, men receive 2.5% more coverage in ordered-list systems compared to closed systems. This net advantage for male candidates across preferential systems is investigated further with the results in Table 2. Overall, contrary to expectations, closed-list systems have a positive effect on women's visibility in election news, suggesting that women are less disadvantaged in terms of media coverage when voters cast a vote for an entire party rather than for a candidate in a preferential system.
In terms of our other explanatory variables, from the first model in Table 1 we see that candidates receive more news media coverage in countries with a single constituency and that this is the case for both men and women. This advantage may be a result of the focus on national media. In countries where there is only one constituency, it is likely that campaign takes place at the national level, and thus the national media cover it more. In essence, there are fewer candidates to focus on with only one list. It is also less costly for the media to decide whom to cover from a smaller set of possible candidates. Overall gender equality appears to have a differential effect on women and men candidates’ news media coverage, indicated by the opposite sign of the coefficient. Where there is greater gender equality, controlling for other relevant factors, women candidates gain greater media attention. At the same time, quota legislation appears to have no effect on women candidates’ news media coverage. Indeed, simple quotas without a placement mandate reduce coverage for women candidates by, on average, 2.7%. The result is marginally significant and does suggest that while quotas are necessary to increase the number of female candidates, this does not always directly lead to similar levels of media coverage.
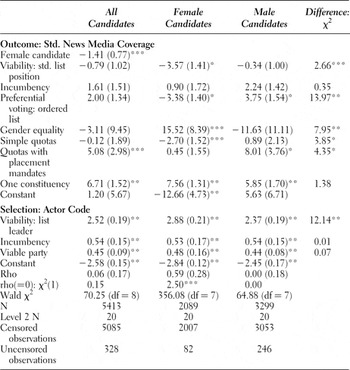
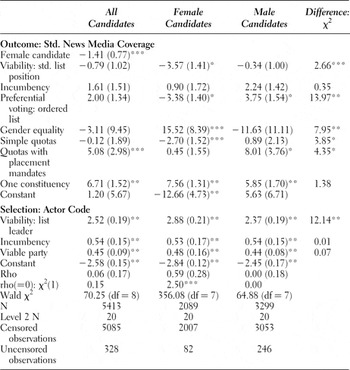
Results in Table 2 explain in more detail the differences between ordered-list preference voting and closed-list nonpreference voting systems. These models also include measures of candidates’ party-determined viability, which allow us to better evaluate how the variables affecting women's chances for viable candidacy are likely to affect the amount of news media coverage they receive.
All selection variables in Table 2 show expected results. List leaders, incumbents, and candidates running for a viable party are more likely to have an actor code and thus individually measured media coverage. Our first hypothesis was that candidate viability determined the amount of coverage received by a candidate and that gender differences would be nonexistent once we took this into account. In other words, we expected that the significant gender effect in Table 1 to disappear or weaken when candidate viability is taken into account. Contrary to our hypothesis, viability is not positively related to news media coverage. Furthermore, when we are able to control for list position, women still receive significantly less news media coverage than men, and the effect size is similar to that for all electoral systems. On average, women receive 1.4% less coverage than men.
As in Table 1 and contrary to our second and third hypotheses, women receive significantly less news media coverage in ordered-list preferential voting systems than in open-list voting systems, whereas, the opposite holds for men. Our expectation was that where candidates had an incentive to personalize the campaign, news coverage would be drawn to more novel female candidates. However, where there are greater incentives for personalised campaigns, it appears the news media focus on male candidates. This result may be due to greater campaign efforts by male candidates in preferential systems or because news media tend to focus on male candidates. Our fourth hypothesis was that viability would have a greater impact on women's coverage than men's. We do see that as a woman's position moves further down the list, media coverage does diminish. This is a statistically significant effect for women. There is no similar negative and significant effect for men. The chi-square test for differences between coefficients indicates that the difference between the coefficients for men and women is statistically significant (difference in χ2 = 2.66). Therefore, while viability does not adversely influence the news coverage of men it does reduce the coverage of women—as a female candidate moves down the list by a unit on our standardized scale, coverage diminishes by 3.5%.
At this point it is important to consider the incentives the media have in covering female candidates differently in different voting systems. The one variable not included in the analysis is media “effort” on the part of the candidate. We do not control for how hard candidates in different voting systems campaign in order to receive news media coverage. Since party gatekeepers appear to treat female candidates differently in ordered-list voting systems compared to closed-list voting systems in regard to their party-determined viability (see Lühiste Reference Lühiste2015), it is possible that female candidates’ campaign strategies vary across voting systems. When women are granted less viable candidacies in ordered-list systems compared to closed-list systems, they may also be less likely to put in the extra effort in their campaign to attract more media coverage. Contrary, women in closed-list systems, when ranked high on electoral lists, would probably receive media coverage regardless of their personal campaign as the media coverage in closed-list systems is more likely to be party- and prominent-candidate centred. Hence, alternative interpretation of the results of this paper would be that party gatekeepers’ dismal support for women candidates in ordered-list systems does not directly but indirectly explain women's dearth of media coverage in these systems.
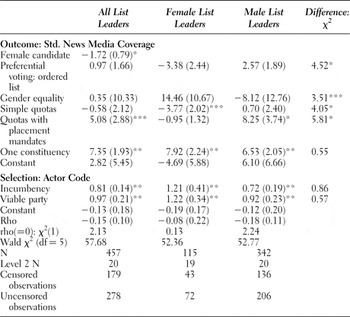
Results in Table 3 indicate that even if the sample includes election list leaders only, women nevertheless receive less news media coverage than men. When the sample is restricted to just list leaders, we find that women on average receive 1.7% less coverage than male candidates. These results give us further evidence that when comparing like candidates, women candidates still receive significantly less coverage. The effects of the type of voting system and overall gender equality show the same direction as in full models; the coefficients for both “Female list leaders” and “Male list leaders” model have lost the traditional level of statistical significance. This could be due to the small sample sizes. However, the estimates in question of the “Female list leaders” model differ in a statistically significant way from the estimates of the “Male list leaders” model, suggesting that female list leaders have higher chances for news media coverage in closed-list systems and in countries with a high level of gender equality, again similar to the models with all candidates.
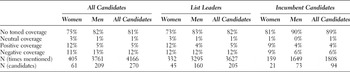
We next turn to the tone of coverage and our fifth hypothesis. Table 4 shows that 80% of the times when MEP candidates were covered, they were not explicitly evaluated. Yet, women candidates were more likely evaluated than men: one quarter of the coverage that female MEP candidates received was explicitly evaluated, compared to less than one-fifth of male candidates’ coverage. Moreover, the toned coverage of women was equally divided between negative (11% of total coverage) and positive evaluation (12% of total coverage) while men were more frequently negatively (13% of total coverage) than positively (5% of total coverage) evaluated. Given the high proportion of highly viable candidates (election list leaders) in the full sample, it is unsurprising that there are no differences in the tone of coverage of all candidates and that of election list leaders. However, incumbency appears to influence how candidates are covered in the news media, with incumbents receiving less toned news media coverage than nonincumbents. Only one in five occasions when an incumbent woman candidate was covered in the news, was she evaluated. In comparison, incumbent men candidates were evaluated only one in ten times that they were portrayed in the news. Similar to nonincumbent women, female incumbents who were evaluated were as likely to be evaluated negatively or positively (9% of total coverage in both cases). On the contrary, nonincumbent men were more likely negatively evaluated than incumbent men. This indicates that incumbency is more likely to increase men's chances for nonnegative news media coverage than women's.
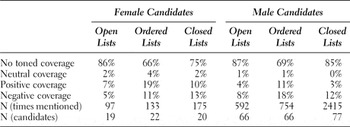
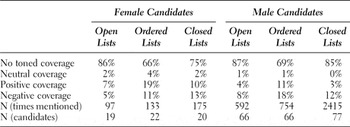
As the data presented in Tables 1, 2, and 3 suggest that women are likely to receive less news media coverage in preferential voting systems than in countries utilizing closed-list electoral systems, we also examine how the tone of coverage female candidates received varies by voting systems. Table 5 shows that women received considerably more toned coverage in ordered-list preferential voting systems (44% of total coverage) than in open-list preferential (14% of total coverage) and in closed-list nonpreferential voting systems (25% of total coverage). In closed-list systems women were more likely evaluated negatively (13% of total coverage) than positively (10% of total coverage). On the other hand, in both types of preferential systems, women were more often evaluated positively than negatively, especially so in ordered-list systems. Male candidates, too, are more likely to have received toned coverage in ordered list systems (31% of total coverage) than in closed- and open-list systems (15% and 13% of total coverage, respectively). However, unlike for women, the type of voting system has little impact on how negatively or positively male candidates are portrayed because men received considerably more negative than positive news media coverage in all voting systems.
CONCLUSION
Many scholars report that women candidates receive less news media coverage than male candidates (Banducci, Karp, and Kittilson Reference Banducci, Karp and Kittilson2007; Kahn Reference Kahn and Carroll2003; Kahn and Goldenberg Reference Kahn and Goldenberg1991). However, more recent studies have failed to find empirical evidence that the amount of media coverage that male and female candidates obtain varies significantly (Heldman, Oliver, and Conroy Reference Heldman, Sarag and Conroy2009; Smith Reference Smith1997; Uscinski and Goren Reference Uscinski and Goren2011). While the current literature offers interesting and consistent examples of how the media treat female and male candidates differently in terms of the tone and type of coverage, we have limited knowledge of why some studies find and others fail to find differential media treatment of men and women. In this paper, we hypothesized that women's news media coverage during electoral campaigns is not an independent process, but is influenced by the behavior of different actors—that is, parties, candidates, voters—and by the electoral rules and overall context. Therefore, we hypothesized that the gender bias in candidate coverage depends on specific electoral rules, such as the type of voting systems, and on party gatekeepers’ decisions when ranking candidates in electoral lists. However, once controlling for these factors, we find that there is still a persistent, albeit small, gender gap in the amount of coverage. Importantly, we find that when controlling for viability, the gender gap in coverage does not disappear. Political parties may be responsible for not promoting women candidates in list systems of candidates, but when comparing men and women in similar positions or even as party leaders, a bias in the coverage remains. Therefore, despite party factors explaining some of the gender differences in coverage, at least part of the gender bias in candidate coverage appears to be the media's own creation.
The differential coverage for male and female candidates may send cues to voters, at least partly due to their nonviable position, that women are not a “normal” part of the political world. Furthermore, by covering female candidates less often than male candidates, the media encourage party elites’ gender-biased decisions when nominating and soliciting candidates in future elections, too. Such assumption is further supported by the finding that women receive even less news media coverage compared to men in preferential voting systems, where candidate's list position is less crucial for her viability than in countries with closed and blocked party-list voting. Thus, under conditions where the competition for individual media coverage is less dependent on parties and likely to be fiercer, media give advantage to male candidates. However, while women may electorally suffer from limited news media coverage in ordered-list preferential voting systems, the fact that they receive more positive evaluation in those systems, compared to open- and closed-list systems and compared to men, may somewhat limit the probable electoral penalty they would have to pay otherwise.
We do find that where the gender equality index points to more gender equal societies, women candidates are more likely to be represented in the election news coverage. We suggest that where there is greater equality, the media may find it easier to reflect this equality because (1) there are more women to cover, (2) there are more women in key positions deciding who gets more media coverage, and (3) the newsroom perceive more demand from the wider public to cover women more in the media, too. Thus, for female candidates the contextual political environment can either stimulate or depress their chances for news media coverage. While women candidates do not benefit from preferential voting, overall gender equality in the society increases their likelihood for receiving more news media coverage during campaigns.
Our results indicating there is less media coverage of women where there are quotas without mandated placement points to several possible confounding factors in preventing women's electoral success. Quotas are intended to increase women's electoral representation by ensuring that important first step of increasing the share of women among candidates. However, we see that becoming a candidate does not equal media coverage. Our analysis suggests that further work is necessary to understand the conditions under which quotas are adopted. If quotas are adopted in less progressive countries, the gendered media culture may not reflect the political push to increase women's representation and therefore lag behind in terms of representing women in its coverage. Overall, our results point to both a party and a media logic where the gender gap in coverage is considered.
SUPPLEMENTARY MATERIAL
To view supplementary material for this article, please visit http://dx.doi.org/10.1017/S1743923X16000106