Introduction
The need for component analysis of zebrafish electroretinogram
Zebrafish is a genetic model for visual-system studies (Fadool & Dowling, Reference Fadool and Dowling2008). More visually alert than mouse, in zebrafish, as in primates, color perception is very well developed. Forward-directed genetic research on zebrafish suggests that there are many important genes with undiscovered function for visual-system organization. These genes are revealed as developmental, neuroanatomical, behavioral, or electrophysiological deficits induced by random mutations. The zebrafish electroretinogram (ERG) is often screened in such studies, but is as yet a blunt tool, as there is no ERG component analysis for zebrafish as there is for cats (Granit, Reference Granit1933; Sieving et al., Reference Sieving, Frishman and Steinberg1986; Robson & Frishman, Reference Robson and Frishman1995), mice (Robson et al., Reference Robson, Maeda, Saszik and Frishman2004), and primates (Bush & Sieving, Reference Bush and Sieving1994; Sieving et al., Reference Sieving, Murayama and Naarendorp1994; Robson & Frishman, Reference Robson and Frishman1998).
The ERG b-wave: A measure of ON-bipolar cell function
The ERG is the light-evoked field potential generated by retina. It sums extracellular limbs of current loops set in motion by light stimulation of all retinal cells, producing net light-evoked voltage changes at the retinal surface (Newman, Reference Newman1980), culminating in a series of named ERG peaks and troughs. The challenge is to disentangle the various summations and cancellations among these current loops that produce the characteristic waveform so as to understand the physiology and circuitry of the various cell types of origin. The ERG b-wave, a vitreal positive-going peak at light onset, is thought to be generated in large measure by currents circulating around ON-type retinal bipolar cells (Stockton & Slaughter, Reference Stockton and Slaughter1989). This is in part because of the disproportionately large bipolar cell representation in the inner nuclear layer of the retina (Strettoi & Masland, Reference Strettoi and Masland1995; Jeon et al., Reference Jeon, Strettoi and Masland1998; Connaughton et al., Reference Connaughton, Graham and Nelson2004) but also because of the especially long ON-bipolar cell axon (Famiglietti et al., Reference Famiglietti, Kaneko and Tachibana1977; Nelson, Reference Nelson1977) that provides a large radial dipole for extracellular currents circulating around these cells.
Bipolar cell pathways express unique glutamate receptor types
ON bipolar cells employ unique synaptic glutamate receptors in contacts with rods and cones. These receptors are insensitive to the AMPA/kainate antagonists that inactivate most excitatory synapses in the nervous system. Because of this, synaptic currents of ON bipolar cells, and the b-wave responses they generate, can be isolated. Conversely, the synapses between OFF-type bipolar cells and photoreceptors employ AMPA/kainate-type glutamate receptors common to retina and brain (DeVries, Reference DeVries2000). Light responses of OFF-type bipolar cells, horizontal cells, amacrine cells, and ganglion cells are all blocked by AMPA/kainate antagonists, leaving photocurrents only from photoreceptors and ON-type bipolar cells. In many species, ON bipolar cells express only metabotropic glutamate receptors (mGluR6) in synapses with photoreceptors. mGluR6 is a type III metabotropic glutamate receptor, that is insensitive to AMPA/kainate antagonists (Masu et al., Reference Masu, Iwakabe, Tagawa, Miyoshi, Yamashita, Fukuda, Sasaki, Hiroi, Nakamura, Shigemoto, Takada, Nakamura, Nakao, Katsuki and Nakanishi1995), and continues to function even in the presence of such antagonists. In these species, the light responses of ON bipolar cells are completely blocked by agonists and antagonists of type III metabotropic receptors (Slaughter & Miller, Reference Slaughter and Miller1981), as are ERG b-waves. In zebrafish and other cyprinids, however, both metabotropic and nonmetabotropic glutamate currents combine in ON-bipolar cell function (Grant & Dowling, Reference Grant and Dowling1995, Reference Grant and Dowling1996; Connaughton & Nelson, Reference Connaughton and Nelson2000; Wong et al., Reference Wong, Cohen and Dowling2005b). This dual glutamate pathway is reflected in zebrafish b-wave responses (Saszik et al., Reference Saszik, Alexander, Lawrence and Bilotta2002a; Wong, Reference Wong2004; Wong et al., Reference Wong, Adolph and Dowling2005a) that persist even in the presence of the metabotropic agonists and antagonists. Nonetheless, the remaining nonmetabotropic b-wave, like the metabotropic b-wave, is insensitive to AMPA/kainate antagonists (Wong et al., Reference Wong, Adolph and Dowling2005a).
Combining wavelengths and drugs to dissect circuits
In zebrafish, Saszik et al. (Reference Saszik, Alexander, Lawrence and Bilotta2002a) found that l-AP4 (a type III metabotropic agonist) blocked the b-wave in wavelength-dependent fashion. Both modeling and raw data indicated that ERG b-waves were greatly suppressed for blue and UV stimulation but less so for red and green, suggesting a u- and b-cone ON bipolar circuitry biased toward metabotropic synapses. This opened the possibility that through a combination of selective glutamate agonists and antagonists and selective wavelength of stimulation, individual, cone-selective ON bipolar pathways could be isolated in zebrafish ERG responses. In effect, the four endogenous “channel rhodopsins” of zebrafish retina, the r-, g-, b-, and u-cone pigments (Robinson et al., Reference Robinson, Schmitt, Harosi, Reece and Dowling1993), could be combined with selective glutamate blockers to probe circuitry. Dissection of the ON pathway was further aided by the existence of at least two different glutamate mechanisms in ON bipolar cells: a metabotropic mechanism and a nonmetabotropic one, the latter based in a glutamate transporter-gated chloride current (Connaughton & Nelson, Reference Connaughton and Nelson2000) or Iglu (Grant & Dowling, Reference Grant and Dowling1995, Reference Grant and Dowling1996). There is a happy confluence of six endogenous handles that can be combined in various fashions to study circuitry using an evoked potential approach.
The zebrafish ERG revisited
The Bilotta laboratory measured classic spectral sensitivity functions for the native zebrafish b-wave and developed linear models based on pigment absorbance to analyze them (Hughes et al., Reference Hughes, Saszik, Bilotta, Demarco and Patterson1998). Perturbations in b-wave spectral properties by individual drugs such as l-AP4 were also investigated (Saszik et al., Reference Saszik, Alexander, Lawrence and Bilotta2002a), but no attempt was made to isolate the ERG elements arising from individual synaptic mechanisms, such as cone synapses with ON bipolar cells. In the present study, we use nonlinear models to characterize the spectral summation within isolated ERG elements. The membrane signals from cones, and ON bipolar cell contacts with cones, are identified through pharmacological blockade and response subtraction. The spectra of these ERG elements are modeled with sums of saturable Hill functions, one for each cone pigment mechanism. In Hill-type models of ERG elements, the fit parameters V max, the cone–color saturation amplitude, and k, the half-saturation amplitude, are closely analogous to similar measures that might be made on cones and bipolar cells themselves. V max provides an index of maximal membrane current contributed by signals from each cone–color type. In this way, synaptic gains are estimated. k compares intrinsic sensitivity among signals arising from different cone pathways.
To isolate synaptic actions, we developed an in vitro perfused eyecup preparation for adult zebrafish (Wesolowska et al., Reference Wesolowska, Nelson and Connaughton2002) that conveniently allows a layering of multiple drugs to isolate ERG elements. Through response subtractions among the waveforms generated by the layered drug treatments, isolated ERG elements generated by photoreceptors, ON bipolar cells, and inner retinal neurons can be calculated and modeled. Furthermore, both metabotropic and nonmetabotropic contributions to the ON bipolar response are distinguished. The proposal for a selective synaptic circuitry and chemistry for different cone pathways is further tested, and some emergent properties of the zebrafish ERG are defined.
Materials and methods
Preparation of zebrafish retina eyecups
Light-adapted adult zebrafish (Danio rerio, EK strain) were decapitated according to an animal study protocol approved by the Animal Care and Use Committee of the National Institute of Neurological Disorders and Stroke, NIH, in accordance with National Research Council Guidelines and Public Health Service Policy on Humane Care and Use of Laboratory Animals. Fish were kindly donated by The Laboratory of Molecular Genetics, National Institute of Child Health and Human Development, NIH. Eyes were removed and mounted upright on squares of black nitrocellulose filter paper (Millipore, Billerica, MA). Under a dissecting microscope (Leica Microsystems MZ12-5; Bannockburn, IL), corneas were punctured with sharp iridectomy scissors; then cornea, iris, and lens were cut away. Eyes, rinsed for 10 min in bubbled (95% O2 and 5% CO2) minimum essential medium (Invitrogen, Carlsbad, CA), were transferred to a stimulation, recording, and perfusion chamber mounted on a microscope stage (Olympus BX51; Olympus America, Center Valley, PA). Retina eyecups were perfused at room temperature (22°C) from the vitreal side (0.3 ml·min−1) through a 3.25-inch gel-loader pipetter tip (Thomas, Swedesboro, NJ), leaving a semisubmerged preparation. Excess media was pumped out of the chamber at a rate of 2 ml·min−1 (Pre-Set Volume Pumps Series I; The Lee Company, Westbrook, CT).
Optical source and calibration
The vitreal sides of retina eyecups were illuminated through a 4× UV plan-apo objective and microscope epifluorescence illumination system. A xenon source focused onto a liquid light guide through intervening filter wheels and shutter (Uniblitz; Vincent Associates, Rochester, NY) provided the stimulation. Interference filters mounted on one wheel (Lambda 10-2; Sutter Instruments, Novato, CA) provided wavelengths from 330–650 nm at 40 nm intervals (20 nm half band; Chroma Technology Corporation, Brattleboro, VT). Stimulus attenuations from 0.0 to 4.5 log units (metallic ND; Andover Corporation, Salem, NH) were provided by another filter wheel, with further attenuation of 1–3 log units attained by manually inserting filters in the path. Monochromatic illumination was quantified with a calibrated silicon detector (Newport Corporation, Irvine, CA). Maximum irradiance in the plane of the retina ranged from 6.3 log hν·μm−2·s−1 at 330 nm to 8.0 log hν·μm−2·s−1 at 490 nm, though stimuli this bright were not delivered in the physiological protocol. Except for 330 nm, quantal output was relatively flat.
A second liquid light guide, illuminated through a second port on the xenon source, provided background stimulation (3.9 neutral density filters, 0.05 μW·cm−2, J16 Digital Photometer; Tektronix, Beaverton, OR). The background was white and adjusted to evoke a low-level ERG signal with photopic waveform. Xenon “white” delivers approximately equal quanta across r-, g-, b-, and u-cone absorbance peaks, but the optical elements in the background pathway were partially UV absorbent. The background was found sufficient to prevent dark-adaptation of rods, without significant adaptation of cones.
Stimulus protocol
The stimulus protocol consisted of 280 flashes of different wavelengths and irradiances delivered in a fixed sequence over a period of 15.8 min. At each wavelength and irradiance, four stimuli were averaged. An irradiance–response series of 7 or 14 points covering a 3.0 log unit range in 0.5 log unit steps was acquired at each wavelength. In total, the spectrum was covered with 70 wavelength-irradiance mean responses. Irradiance ranges were preadjusted to correspond to the dynamic range of the ERG at each wavelength. Peak irradiances ranged from 5.4 to 6.0 log hν·μm−2·s−1. Flash duration was 300 ms and the repetition rate was 3.0 s. A 12-s pause between each wavelength’s irradiance series allowed for recovery. Wavelengths were staggered in the order 650, 570, 490, 410, 330, 650, 610, 530, 450, and 370 nm.
Evoked potential (ERG) recording
The reference electrode was an 18 gauge chlorided silver wire placed in the chamber outflow pool. The recording electrode was a patch pipette, filled with 0.9% NaCl, filed to a ~100 μm tip, and mounted on the head stage of a DAM 80 AC differential amplifier (World Precision Instruments, Sarasota, FL), set for 0.1 Hz (τ = 1.6 s) to 1 kHz bandpass filter and for a gain of 104. Amplifier output was digitized with a Digidata 1200 series interface and Clampex 8.2 software (Axon Instruments/Molecular Devices, Sunnyvale, CA). Digitization was at 0.5 ms intervals for 2 s starting 400 ms before stimulus onset. The coefficient of variation in b-wave amplitudes among different preparations was wide (~0.4); nonetheless, drug-evoked waveshapes and preparation stability were similar regardless of preparation amplitude.
The spectral protocol was initiated through Clampex sequencing keys. A second DOS computer programmed in Quick Basic 7.0 (Microsoft, Redmond, WA) was used to respond to Clampex TTL requests to trigger acquisition and to send protocol commands to filter wheels and Uniblitz reflective shutters (Vincent Associates). Data collection including all drug treatments required 3–4 h.
Drugs
Concentrated stock solutions of the drugs CNQX (6-cyano-7-nitroquinoxaline-2,3-dione, Tocris Cookson Inc, Ellisville, MO); l-AP4 (l-(+) Amino-4-phosphonobtyric acid, Tocris Cookson Inc, Ellisville, MO); CPPG ((RS)-α-Cyclopropyl-4-phosphonophenylglycine, Tocris Cookson Inc, Ellisville, MO); dl-threo-β-benzyloxyaspartic acid (TBOA; Tocris Cookson Inc); and l-aspartic acid (RBI/Sigma, St. Louis, MO) were diluted by controlled injection into the main perfusion line and applied to the vitreal surface of the retina. Stock solutions of CNQX were 5 mm (dissolved in H2O) and were diluted to 30–50 μ m at the vitreal surface. Stock solutions of l-AP4 were 5 mm and those of CPPG were 5–20 mm (both dissolved in 1 n NaOH and then neutralized to pH 7). l-AP4 was diluted to 20–100 μ m at the vitreal surface; CPPG was diluted to 120–180 μ m. Stock solutions of TBOA were 2.5–10 mm (dissolved in H2O) and diluted to 20–40 μ m at the vitreal surface. Stock solutions of l-aspartic acid were 500 mm (dissolved in H2O and titrated to pH 7.0) and diluted to 3000–7000 μ m at the retinal surface.
Dilution of drugs
Dilution was accomplished by adjusting flows from syringe pumps. These were 1 cc disposable syringes with plungers advanced by motorized micrometers (Motor Mike Actuators; Newport/Oriel, Irvine, CA). Actuators were driven in pulsed mode (12 V, 5 ms) allowing for very slow speeds with delivery nearly proportional to pulse rate. Infusion of stock solutions, and resultant concentrations on the retina, could be varied in eight steps by switch, each differing by a factor of approximately 2. The main perfusion flow of 0.3 ml·min−1 was measured by drop counting, and pressure on the main perfusion reservoir was adjusted by computer to maintain the drop rate constant. Delivered drug concentrations were calculated from the ratio of drug infusion rate to the main flow rate of the media. Between 10 and 30 min were allowed for equilibration of drugs with the retina, as monitored by ERG waveform changes.
Data analysis
Clampex protocol files containing averaged responses for each drug treatment were imported into Origin (v. 7.5; OriginLab, Northampton, MA) making use of the Origin script language LabTalk. The slower processes of response subtractions and nonlinear least squares fitting (NLSF) were written in Origin C language. After importing, records were “box-car” smoothed (33 point running average, covering one cycle of 60-Hz line noise) and graphed. Peak amplitude of PIII (baseline to trough) and of b-wave elements (trough to peak) was measured and fit with the spectral model [eqn. (1)]. Both spectral sensitivity and irradiance–response curves were generated from the model. Results from multiple experiments were compiled in a Filemaker database (Filemaker Inc, Santa Clara, CA).
The spectral model
The zebrafish photopic ERG provides the unique challenge of modeling the circuitry integration of four vertebrate cone signals, r, g, b, and u. As drug treatments used in this study heavily suppress the synaptic interactions through retinal interneurons, including those that might introduce nonlinear interactions between cone signals, a simple summation model seemed worth testing and, in fact, fit the response–wavelength–irradiance datasets well.
We have chosen to model each isolated zebrafish ERG element as a sum of four Hill functions, each with an exponent of one and each with separate saturation nonlinearities. A similar model was used to quantify rod and r-cone summation in cat horizontal cells (Nelson, Reference Nelson1977).

Amplitudes (V) for the complete sequence of 70 stimuli of different wavelengths (λ) and intensities (I) were fit by this eight parameter three-dimensional model. The model in turn generated both irradiance–response curves (holding λ constant) and spectral sensitivity curves (holding V, the criterion response level, constant). The parameters V r, V g, V b, and V u are the saturated amplitudes for r-, g-, b-, and u-cone signals. The parameters k r570, k g480, k b415, and k u362 are the half-saturating values of irradiance for each cone signal, as measured at the wavelength of maximal absorption as given by Robinson et al. (Reference Robinson, Schmitt, Harosi, Reece and Dowling1993). These k values are sometimes referred to as “sensitivities”. The absorbance functions of the r, g, b, and u cones, A r(λ), A g(λ), A b(λ), and A u(λ), are each normalized to the peak wavelength for that cone. In eqn. (1), dividing each “k” value by absorbance at a particular wavelength in effect adjusts the effective k at that wavelength for reduced off-peak absorbance efficiency.
The absorbance functions for r, g, b, and u cones were calculated from absorption nomograms [eqn. (2)].
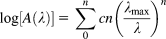
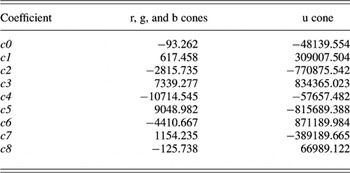
The coefficients for r-, g-, b-, and u-cone nomograms appear in Table 1. One nomogram is used for r, g, and b cones (Hughes et al., Reference Hughes, Saszik, Bilotta, Demarco and Patterson1998). Palacios et al. (Reference Palacios, Goldsmith and Bernard1996) concluded that the u-cone nomogram in giant danio, a species related to zebrafish, is actually narrower than that for the other pigments. For this reason, the Palacios u-cone data are used for the 362 nm zebrafish u-cone pigment.
Polynomial coefficients of normalized absorption nomograms for zebrafish cones

When entered into eqn. (2), these coefficients generate pigment absorbance functions A r(λ), A g(λ), A b(λ) and A u(λ). The nomogram for r, g, and b cones is from Hughes et al. (Reference Hughes, Saszik, Bilotta, Demarco and Patterson1998). The nomogram for the u cone is from Palacios et al. (Reference Palacios, Goldsmith and Bernard1996).
Response–wavelength–irradiance data were fit with the spectral model [eqn. (1)] using NLSF (Levenberg–Marquardt). There are constraints on the stimulus ranges to which this model can be applied. We chose colors that included both peak and flanking wavelengths for each of the four zebrafish cones. Irradiances included response threshold and extended to 6.0 log hν·μm−2·s−1 at r- and g-cone spectral peaks, and 5.4 log hν·μm−2·s−1 at b- and u-cone spectral peaks. These maximal stimuli were from 1.6 to 2.3 log units greater than the semisaturation values for the respective cone mechanisms as seen below or from 96 to 99% saturating. Considering the whole stimulus protocol, at some point, each cone type is saturated. No stimulus saturated all cone mechanisms simultaneously, however. The model [eqn. (1)] does not detect very small cone–color signals and sometimes fails to converge in the search for them. In the case of such small signals, the cone color was eliminated from the NLSF.
Results
Nomenclature for ERG elements and choice of spectral model
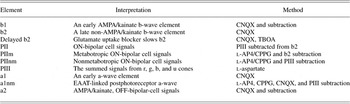
Among the ERG response waveforms evoked in this study with five drug treatments, and further in examination of the subtracted differences between them, 10 peaks or troughs were named. Seven of these are interpreted in terms of the isolated functions of cones, ON bipolar cells, OFF bipolar cells, or inner retinal neurons, and five of these isolated functional elements were spectrally studied. For ease of reference, the colloquial names given these elements, their physiological interpretation, and a short summary of the way in which each is calculated appear in Table 2. The PII, PIII nomenclature is adapted from Granit (Reference Granit1933) who noted functional waveform changes similar to those seen below using progressive ether anesthesia.
Onset elements in zebrafish photopic ERG

Colloquial names, physiological interpretations, and brief description of the method for extracting the element are given. All elements are photopic, isolated on a rod-saturating weak photopic background.
The spectral model [eqn. (1)] is an independent summation model for cone signals within each functional element. It takes into account that most wavelengths, except for 650 nm, stimulate multiple cone types. It assigns saturated amplitudes and sensitivities to each cone signal and sums them so as best to fit all the 70 response–wavelength–irradiance data points. Irradiance–response curves presented below are based on this full modeled dataset rather than being based just on the 7 or 14 data points acquired for a particular wavelength. These irradiance–response curves are model predictions for a particular wavelength based mainly on the more extensive data acquired at other wavelengths.
One of the model successes is fitting saturated response values in the various ERG onset elements. These progressively increase as wavelength becomes shorter, as more saturable cone signals are recruited. This experimental fact in itself precludes other models, such as those with joint saturation for multiple cone signals. The resulting irradiance–response curves provide an accounting by visual inspection of the appropriateness of the model to the datasets. Another assessment of model performance is provided by R 2.
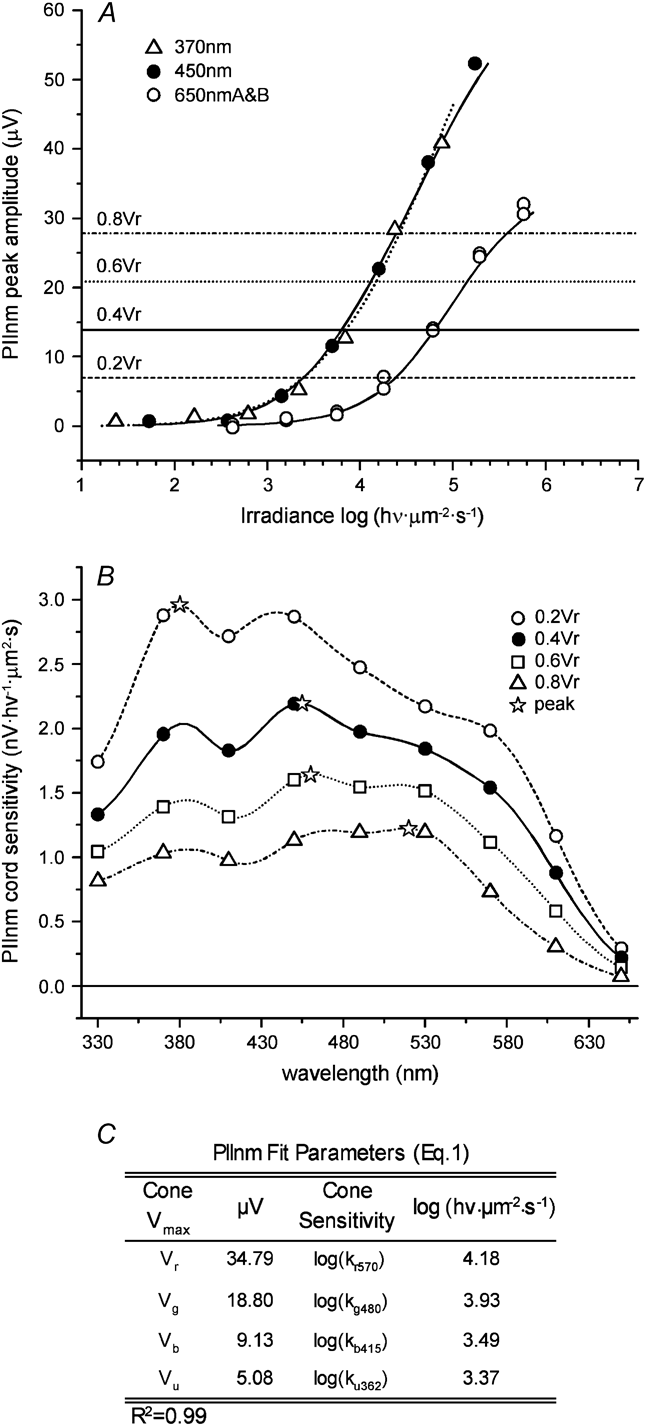
The model [eqn. (1)] can be plotted as spectral sensitivity. Cord sensitivity was chosen as an index. This is the criterion voltage divided by the irradiance required to meet this criterion at each wavelength. Cord sensitivity is a nanovolts per photon measure, with units of nV·hν −1·μm2·s. V r was chosen to define the four criterion levels (0.2V r, 0.4V r, 0.6V r, and 0.8V r) so as to guarantee that sensitivity points could be calculated for all wavelengths.
PIII, the contribution of cones to the ERG
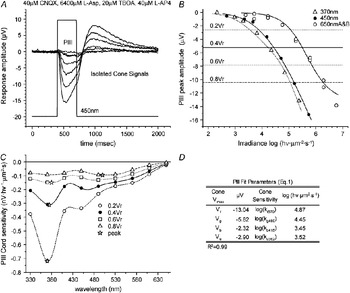
To determine the spectral sensitivity and the intensity response functions for zebrafish cones without interference from the retinal network, we blocked all glutamatergic transmission with l-aspartic acid (Sillman et al., Reference Sillman, Ito and Tomita1969a,Reference Sillman, Ito and Tomitab), herein supplemented with additional blockers. Sample responses at 450 nm appear in Fig. 1A. These waveforms are representative of any of the nine wavelengths tested. Photopic PIII responses so isolated are smoothly varying functions of irradiance. Maximum PIII negativity is plotted against quantal irradiance for 370, 450, and 650 nm (Fig. 1B), three of the nine wavelengths tested. The continuous curves are model predictions [eqn. (1)] based on the 70 irradiance–response points garnered from all nine wavelengths.
Spectral shape of photopic PIII. (A). The nested irradiance–response series was evoked with 450-nm stimuli from a light-adapted zebrafish eyecup treated with the synaptic blocking agents listed in the figure (l-Asp, l-aspartate). The 7 irradiance levels are 2.7, 3.3, 3.7, 4.2, 4.7, 5.2 and 5.7 log(hν·μm−2·s−1). (B). Peak negativities are plotted versus stimulus irradiance at 370, 450, and 650 nm. Curves are model predictions [eqn. (1)] based on the entire spectral dataset. Horizontal lines are spectral sensitivity criterion levels. (C). PIII spectral sensitivity plots vary with criterion levels. Stars mark spectral maxima. Other points mark the test wavelengths. Spectral peaks range from the UV (370 nm at the 0.2V r criterion) to the blue–green (500 nm at the 0.8V r criterion). Both points and curves are calculated from the model fits [eqn. (1)]. (D). The fit parameters [eqn. (1)] show saturation amplitudes from r cones (V r) are greatest, while those from b and u cones (V b, V u) are least. Cone sensitivity is given as the log of half-saturation irradiance. Sensitivities of b and u cones, log(k b415) and log(k u362), are greater than those of r and g cones, log(k r570) and log(k g480). Spectral peaks are dominated by b and u cones at low criteria. In this and the following figures the rectangular stimulus trace (A) is adjusted in height and level to equal the maximum and minimum response voltage excursions during the entire 70-record nine-wavelength dataset. Irradiance–response curves (B) are predictions based on NLSF fits to eqn. (1) for the whole dataset, not just the points for individual wavelengths. The 650 nm points (B) are doubled because this wavelength is repeated as a check for preparation stability. Cord sensitivity (C) is the irradiance required to reach criterion voltage divided by the criterion voltage. Spectral voltage criteria are set to 0.2, 0.4, 0.6, and 0.8 of V r [eqn. (1)].

At low criterion voltages (0.2V r, 0.4V r, and 0.6V r), spectral sensitivity (Fig. 1C) is maximal near u-cone peak absorbance but flattens to a broad maximum near the g-cone absorbance peak for the highest criterion (0.8V r). In 17 such spectra, maxima shifted from 440 ± 13 nm [mean and standard error of the mean (SEM)] at 0.2V r to 509 ± 10 nm at 0.8V r. PIII parameter fits for this eyecup (Fig. 1D) reveal that the largest signal component arises from r cones (V r). Note that the 0.8V r criterion (−10 μV), while near 650 nm saturation for r cones, was not particularly large for PIII as a whole, as net saturation, and the sum of V max's from all cone types was −24 μV (Fig. 1D). The success of the sum of Hill functions model [eqn. (1)] can be judged by the 0.99 R 2 value.
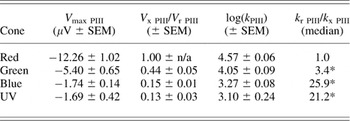
R-, g-, b-, and u-cone signals within zebrafish PIII differ in half-saturation irradiances and in amplitude contributions to PIII (Table 3). Combining results from 17 preparations, g-cone saturated amplitudes were 40–50% that of r cones, while b- and u-cone saturated amplitudes were 10–20% that of r cones (Table 3, col. 2). The median signal for g-cones was about 3 times more sensitive than that for r-cones. B- and u-cone signals were 20–30 times more sensitive (Table 3, col. 4). All the cone-signal V max ratios (Table 3, col. 2) differ significantly (P < 0.01, t-test), except for b and u cones (P > 0.05, t-test). The half-saturating irradiances (Table 3, col. 3) differed significantly among cone types (P < 0.01, t-test), except for b and u cones (P > 0.05, t-test). g, b, and u cones were significantly more sensitive than r cones (Table 3, col. 4).
Cone–color signals within photopic PIII, isolated by l-aspartate

Saturated amplitudes (V max PIII, col. 1) and half-saturation irradiances (k PIII, col. 3) for r-, g-, b-, and u-cone signal elements are extracted by the spectral model [eqn. (1)]. V x PIII/V r PIII (col. 2) gives V max relative to r cones. k r PIII/k x PIII (col. 4) gives median half-saturation irradiances relative to r cones, so that values larger than 1 indicate greater sensitivity. Values significantly greater than 1 are marked by asterisks (P < 0.05, t-test). Response–wavelength–irradiance datasets from 17 preparations were fit by NLSF to the spectral model [eqn. (1)] with a median R 2 of 0.98. r cones contribute the largest signal amplitude to PIII but at a lower sensitivity than g-, b-, or u-cone types. In this and the following tables, V max refers to V r, V g, V b, and V u for the cone signal within the ERG element. The k values are in hν·μm−2·s−1. Values are means ± standard errors of the mean (SEM), except for the k ratios. These follow a non-Gaussian distribution best characterized by the median. All ratios are computed from paired values within each preparation.
AMPA/kainate block reveals b1 and b2, fast and slow b-wave elements
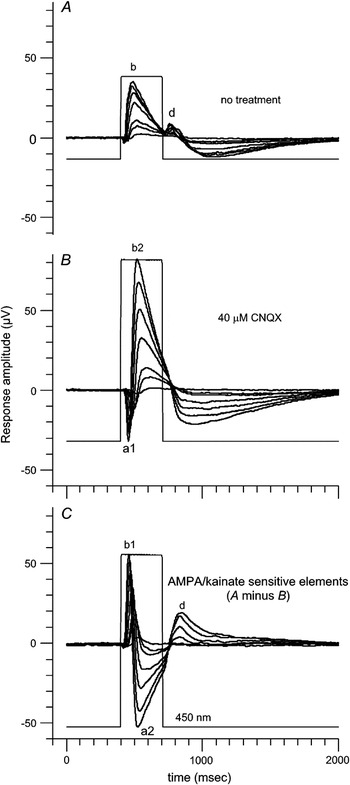
CNQX is an AMPA-kainate antagonist. Most glutamatergic synapses in the retina, except between cones and ON-type bipolar cells, the principal contributors to the ERG b-wave, were blocked by this antagonist. The blockade limits GABAergic and glycinergic synaptic activity as well, by blocking excitatory input to horizontal cells and amacrine cells. The use of CNQX at the outset limits ERG currents to just those contributed by ON bipolar cells and photoreceptors.
In the untreated ERG (Fig. 2A), there is a b-wave (b) at stimulus onset and a d-wave (d) at stimulus offset. CNQX had four effects: increasing the b-wave amplitude, delaying the b-wave peak (b2, Fig. 2B), inducing onset negativity (a1, Fig. 2B), and eliminating the d-wave. The increase in b-wave amplitude is thought to reflect suppression of subtractive OFF-bipolar-cell signals and suppression of inhibitory circuits involving horizontal and amacrine cells. Similar amplitude increases were previously noted in zebrafish (Wong, Reference Wong2004) and originally reported in monkey (Bush & Sieving, Reference Bush and Sieving1994; Sieving et al., Reference Sieving, Murayama and Naarendorp1994). The unmasking of an a-wave element (a1) and the delay in b-wave peak (b2) merit further study.
ERG elements blocked by AMPA/kainate antagonists. (A). 450-nm stimulation evokes both onset b-wave and offset d-wave responses in the untreated eyecup. (B). CNQX, an AMPA/kainate antagonist, induces onset negativity (a1), doubles b-wave amplitude, delays the b-wave peak time (b2), and abolishes d-wave (d) responses. (C). Arithmetic subtraction of CNQX-treated responses (B) from untreated responses (A) reveals three AMPA/kainate-generated elements sensitive to CNQX: a fast b-wave element (b1), a maintained ON negativity (a2), and the d-wave (d). Irradiances of stimulation are the same as Fig. 1. Responses in (A) and (B) are recorded consecutively in the same eyecup.

The AMPA/kainate-driven ERG elements blocked by CNQX can be calculated by arithmetic subtraction of the traces in Fig. 2B from those in Fig. 2A. This gives the traces of Fig. 2C. It came as some surprise that, by this analysis, part of the b-wave rising phase (b1, Fig. 2C) involves AMPA/kainate receptors. The loss of this element accounts for the slower peak time in the remaining b-wave (b2, Fig. 2B). The next element blocked is a2, a slowly decaying negativity maintained throughout the stimulus ON phase. At stimulus offset, the d-wave is also blocked. The CNQX blockade of a2 and d (Fig. 2C) is interpreted as the expected suppression of AMPA/kainate-mediated light responses from OFF bipolar cells.
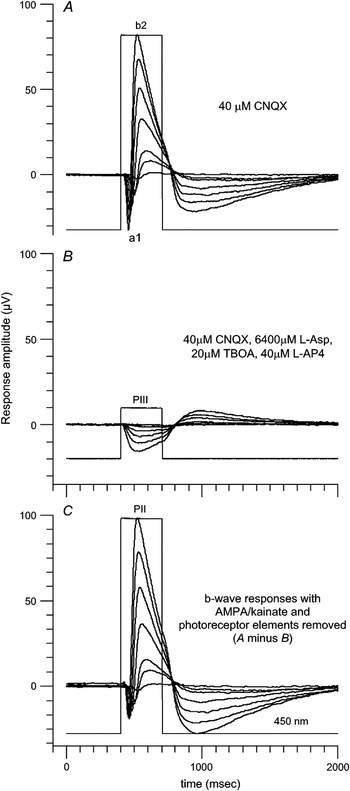
The CNQX-isolated b-wave (b2, Figs. 2B and 3A) is not a purely ON bipolar-driven element as cone PIII field potentials also actively summate within this response. In Fig. 3C, this PIII cone component has been removed from b2 by subtracting PIII (Fig. 3B), recorded a little later in the drug treatment protocol for this eyecup. This leaves the isolated ON bipolar signals (PII, Fig. 3C). Interestingly, the subtraction does not fully eliminate the a1 a-wave (Fig. 3A), at least half of which remains (Fig. 3C). This remaining a-wave element appears to be postphotoreceptor and associated with ON-bipolar cell activity.
PII, the non-AMPA/kainate b-wave element. (A). Non-AMPA/kainate ERG elements a1 and b2 remain after treating an eyecup with CNQX (same as Fig. 2B). (B). PIII cone signals are revealed after complete synaptic blockade (same as Fig. 1A). (C). The photoreceptor-generated PIII signal within (A) is removed by subtracting (B) from (A), revealing PII, a postphotoreceptor non-AMPA/kainate element that originates selectively with ON-type bipolar cells. An a-wave element remains even after subtracting cone-generated PIII. Responses are recorded consecutively in the same eyecup in (A) to (B) order. All stimuli are 450 nm with the same irradiances as in Fig. 1.

Cone contributions to b-wave elements
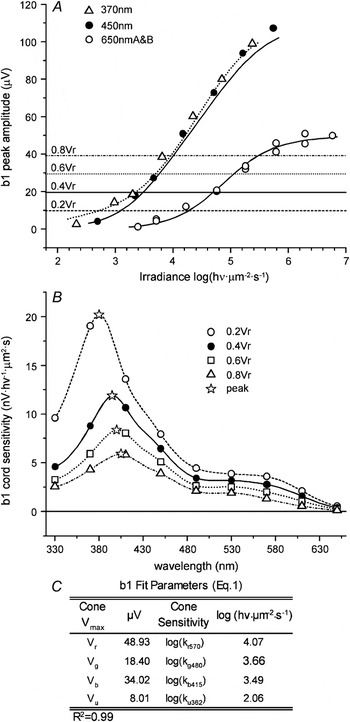
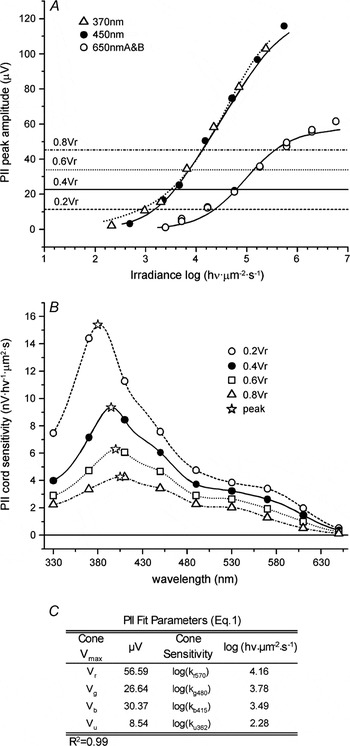
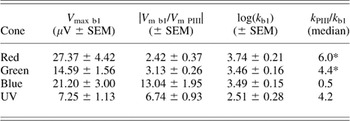
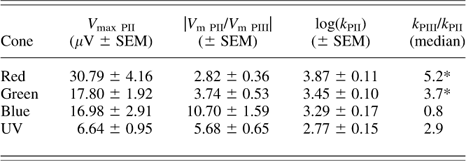
The b1 and PII b-wave elements differ in time course but are similar in response–irradiance and spectral characteristics. In Figs. 4A and 5A, irradiance–response plots for 450- or 370-nm stimuli yield near double the saturated amplitudes seen at 650 nm. Spectral sensitivities (Figs. 4B and 5B) are b- and u-cone dominated, with peaks shifting little with changes in criterion. r and g cones contribute a low lying plateau at longer wavelengths. In 13 such spectral sets for b1, peaks followed the b-cone absorbance maximum shifting from 416 ± 16 nm at 0.2V r to 421 ± 15 nm at 0.8V r (means and SEM's). Similarly, in 15 such spectral sets for PII, peaks were also stable near the b-cone absorbance maximum shifting from 409 ± 15 nm at 0.2V r to 425 ± 13 nm at 0.8V r. In accordance with the b-cone-tracking spectral peaks for both b1 and PII, the fit parameters for these elements (Figs. 4C and 5C) show V b > V g, and both log(k b415) and log(k u362) less than either log(k g480) or log(k r570).
Spectral properties of b1, a b-wave element generated by AMPA/kainate receptors. (A). Peak responses versus stimulus irradiance at 370, 450, and 650 nm are fit by curves predicted from the spectral model [eqn. (1)]. Maximal amplitudes are larger for simulation with UV (370 nm) or blue (450 nm) than those for red (650 nm). Horizontal lines are criteria for spectral sensitivity. (B). Model-generated spectral curves for b1 vary with criterion. Stars indicate spectral peaks, which remain in the UV or blue (380–405 nm) for all criteria tested. Other points mark test wavelengths. (C). The table lists model [eqn. (1)] fit parameters for this b1 dataset. These parameters generate the curves in (A) and both curves and points in (B). While V r and V g are in similar ratio as found for PIII (Fig. 1), V b is much increased. Other conventions are the same as Fig. 1.

Spectral shape for PII, a b-wave element insensitive to AMPA/kainate blockade. (A). PII irradiance–response data are fit by predicted model curves [eqn. (1)] at three wavelengths. Maximal responses are much larger for UV (370 nm) or blue (450 nm) stimulation than those for red (650 nm). Horizontal lines are criterion levels for spectral sensitivity. (B). Model-generated PII spectral sensitivity curves vary with criterion level. Stars mark spectral peaks, ranging from 380 nm (0.2V r criterion) to 405 nm (0.8V r criterion). Other points mark test wavelengths. (C). The table lists model [eqn. (1)] fit parameters for PII. These parameters generate the curves in (A) and both curves and points in (B). While the ratio of V r to V g is similar to PIII (Fig. 1), V b is much increased. Other conventions are the same as Fig. 1.

Comparison of b1 and PII to PIII
The modeled cone signal composition within the b1 and PII b-wave elements is summarized and compared to PIII in Tables 4 and 5. As a group, modeled cone–color signals within b1 and PII are 2–13 times larger in saturated amplitude than for PIII (col. 2, Tables 4 and 5). Sensitivity, as measured by the ratios of half-saturation irradiances (col. 4, Tables 4 and 5), was significantly increased over PIII for r and g cones. b-cone saturated amplitudes are 10–13 times larger than seen in PIII (col. 2, Tables 4 and 5). By comparison, V max gains for r- and g-cone signals are in the range 2–4. U-cone signals are intermediate with V max gains of 6–7. Clearly, ON pathways, as represented by b1 and PII, create b-cone signals of disproportionately large amplitude. This contributes to b-cone tracking of spectral peaks for both b1 and PII while relegating r- and g-cone contributions to shoulders on the spectral profile.
Cone–color signals in b1, the AMPA/kainate-sensitive b-wave element

Saturated amplitudes (V max b1, col. 1) and half-saturation irradiances (k b1, col. 3) for r-, g-, b-, and u-cone signals are extracted from 13 preparations by the spectral model [eqn. (1)]. The median R 2 was 0.98. |V m b1/V m PIII| (col. 2) gives the absolute gain in V max relative to PIII. In column 4, k PIII/k b1 is an index of change in sensitivity (half-saturation irradiance) relative to PIII. Positive values with asterisks indicate significant sensitivity increases (P < 0.05, t-test). r cones and b cones contribute the greatest signal amplitudes. V max signal gains relative to PIII are largest for b and u cones, while sensitivity gains are seen for r and g cones. Other conventions are the same as Table 3.
Cone–color signals for PII, the AMPA/kainate-insensitive b-wave element
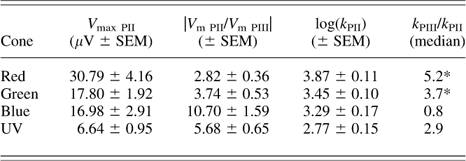
Saturated amplitudes (V max PII, col. 1) and half-saturation irradiances (k PII, col. 3) for r-, g-, b-, and u-cone signals are extracted by the spectral model [eqn. (1)] from 16 preparations. The median R 2 was 0.99. While r and g cones contribute the largest signal amplitudes, V max gains relative to PIII (col. 2) are largest for b- and u-cone signals. Sensitivity gains (col. 4) are significant for r and g cones (P < 0.05, t-test). Conventions are the same as Table 4.
Metabotropic and nonmetabotropic components within PII
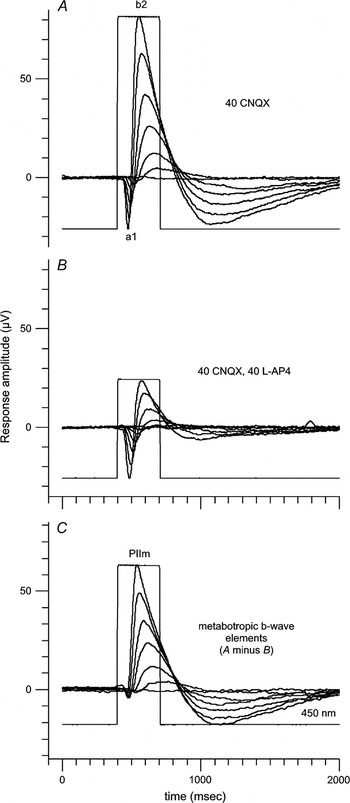
To identify ON bipolar subelements within b2 that might be mediated by the metabotropic receptor mechanism and, furthermore, to identify nonmetabotropic signals that might remain, l-AP4, a metabotropic glutamate agonist, was added to the perfusion mixture while continuing to treat retinas with the AMPA/kainate blocker CNQX. A CNQX-treated a1 and b2 response appears in Fig. 6A, similar to Figs. 2B and 3A. With the addition of l-AP4, a smaller biphasic waveform, composed of a-wave and a diminished b-wave, persisted (Fig. 6B). To view the l-AP4-blocked metabotropic elements in isolation, the nonmetabotropic response (Fig. 6B) is subtracted from the CNQX-isolated response (Fig. 6A). PIIm, an isolated b-wave element results (Fig. 6C). PIIm is the metabotropic b-wave, a subelement of PII that is blocked by l-AP4. No a-wave is associated with this element.
Extraction of PIIm, the metabotropic b-wave. (A). Non-AMPA/kainate ERG elements a1 and b2 remain after treating an eyecup with CNQX (similar to Fig. 2B). (B). Treatment with l-AP4, a blocker for type III metabotropic glutamate receptors, in addition to the AMPA/kainate blocker CNQX used in (A) leaves a1 little affected but reduces the b2 element. (C). Arithmetic subtraction of responses treated in both CNQX and l-AP4 (B) from responses treated only with CNQX (A) reveals PIIm, the metabotropic b-wave. PIIm arises from ON-bipolar-cell metabotropic glutamate receptors post-synaptic to zebrafish cones. The subtraction (C) reveals little a-wave element for PIIm. Stimuli are all 450 nm with irradiances of 1.7, 2.6, 3.2, 3.7, 4.2, 4.7, and 5.2 log(hυ·μm−2·s−1). Responses in (A) and (B) are recorded consecutively in the same eyecup. Other conventions are the same as Fig. 1.

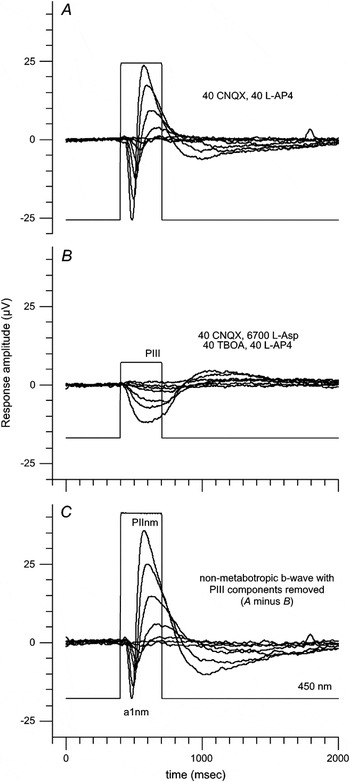
Not all the zebrafish b-wave is blocked by l-AP4 (Fig. 6B). A nonmetabotropic non-AMPA/kainate subelement remains. This is disentangled from PIII in Fig. 7 by subtracting PIII, isolated by l-aspartate a little later in the same preparation (Fig. 7B), from the response set seen in the presence of CNQX and l-AP4 (Fig. 7A). The result of this subtraction (Fig. 7C) is biphasic in waveform, composed of a1nm and PIInm. PIInm is a nonmetabotropic, non-AMPA/kainate postphotoreceptor b-wave element. Furthermore, a1nm is a nonmetabotropic, non-AMPA/kainate postphotoreceptor a-wave element.
Extraction of PIInm, a nonmetabotropic non-AMPA/kainate b-wave element. (A). An eyecup treated with the AMPA/kainate antagonist CNQX and the metabotropic glutamate agonist l-AP4 responds with a-wave and b-wave (same records as Fig. 6B). (B). Addition of l-aspartate (l-Asp), a nonspecific blocker of glutamatergic transmission, and TBOA, a glutamate uptake blocker, eliminates postphotoreceptor responses leaving PIII, the cone signal. (C). Arithmetic subtraction of PIII (B) from the responses in (A) reveals a postphotoreceptor, nonmetabotropic non-AMPA/kainate a-wave (a1nm) and b-wave (PIInm). Both elements originate with ON bipolar cells. Responses were recorded consecutively in the same eyecup in (A) to (B) order. Irradiances of 450-nm stimuli are the same as in Fig. 6. Other conventions are the same as Fig. 1.

Spectral properties of PIIm
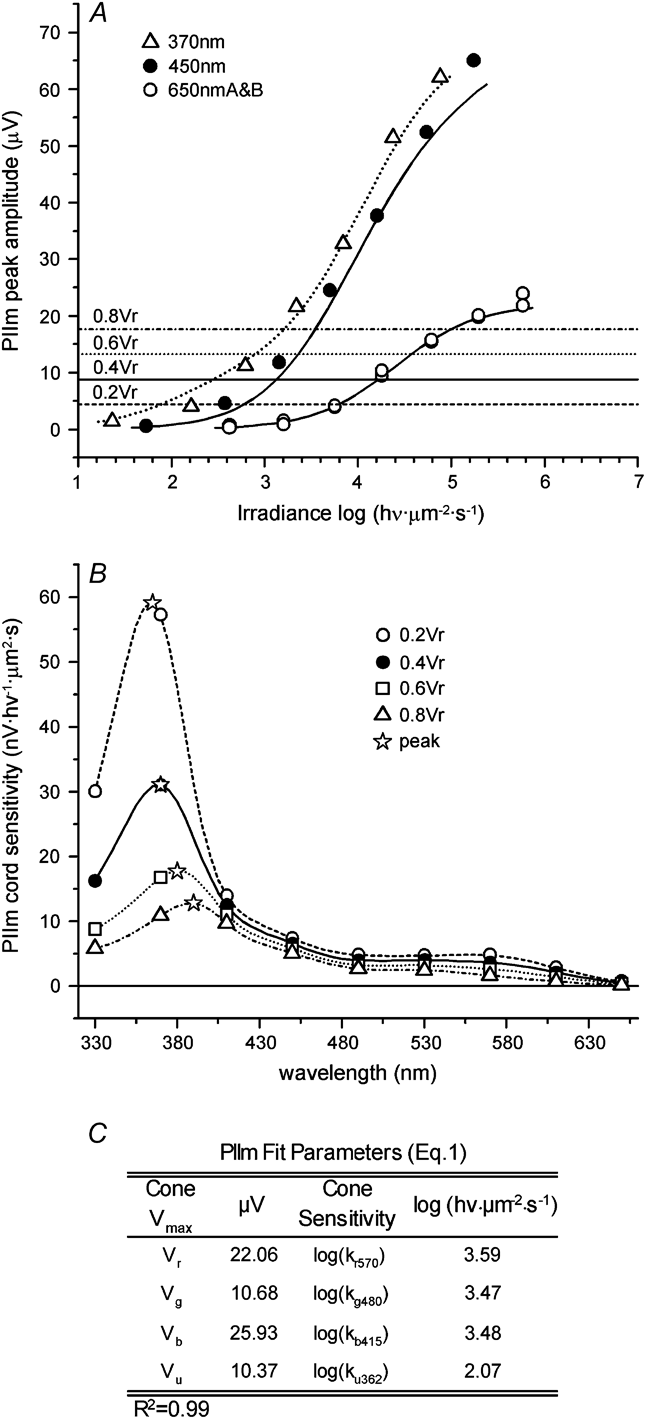
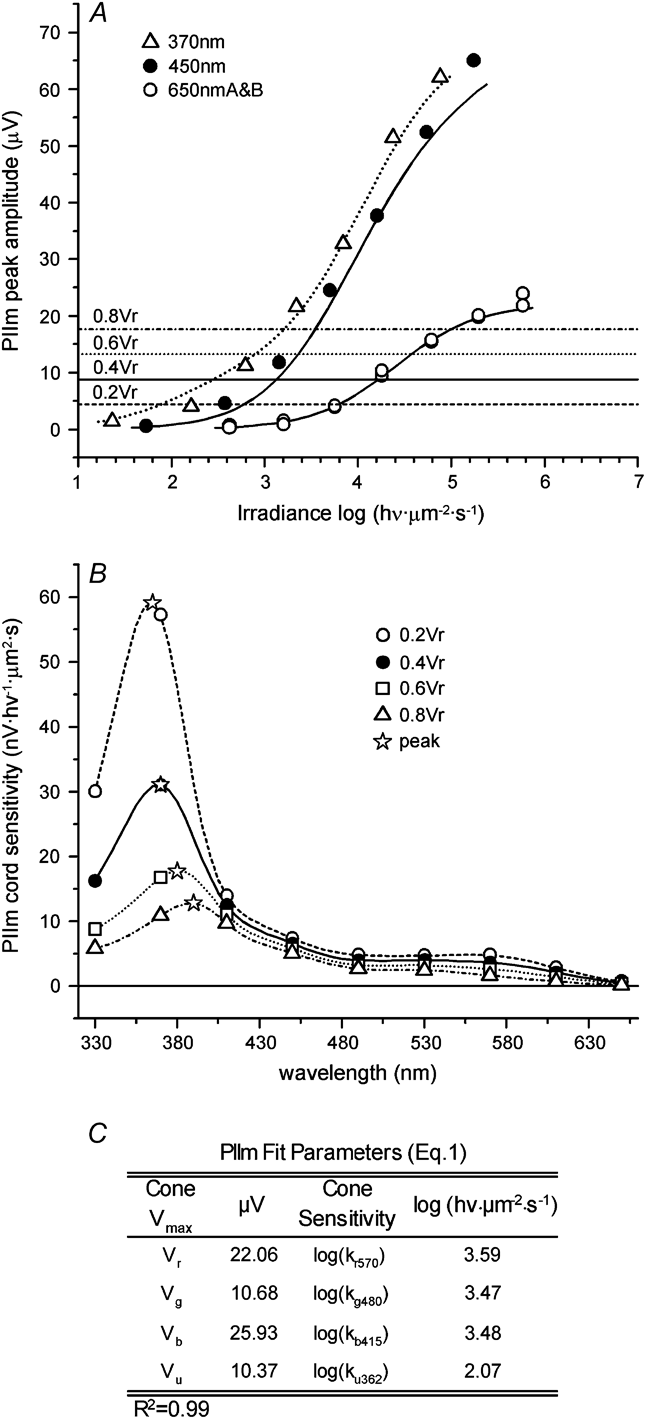
When PIIm irradiance–response functions for red, blue, and UV stimuli are examined (Fig. 8A), saturated amplitudes in the blue (450 nm) and UV (370 nm) were found nearly triple those in the red (650 nm). Correspondingly, spectral sensitivity (Fig. 8B) is dominated by b- and u-cone absorbance, and peaks at 365 nm for the 0.2V r criterion, with red shift only as far as 390 nm for the 0.8V r criterion. Spectral contributions from r and g cones form only a low shoulder on the spectral profile. Similar results were obtained when CPPG, an mGluR6 antagonist (120–180 μ m), was used in place of l-AP4, an mGluR6 agonist. In six such spectral sets for PIIm, peaks were intermediate between b- and u-cone absorbance maxima shifting from 375 ± 20 nm at 0.2V r to 390 ± 13 nm at 0.8V r (means and SEM's). The model parameters (Fig. 8C) explain this with two factors, first, the dominant b-cone saturation voltage (V b) and second, the high sensitivity (log(k u362)) for the u-cone signal.
Spectral characteristics of PIIm, the metabotropic b-wave. (A). The PIIm peak responses are compared to predicted model curves at three wavelengths. Saturated amplitudes in the UV (370 nm) and blue (450 nm) are nearly triple than those in the red (650 nm). Horizontal lines mark criteria for spectral sensitivity. (B). Spectral sensitivity curves for PIIm vary with criterion level. Stars mark spectral peaks. These range from 365 nm at the 0.2V r criterion to 390 nm at the 0.8V r criterion. Other points show test wavelengths. (C). The table lists model [eqn. (1)] fit parameters for this dataset. These parameters generate the curves in (A) and both curves and points in (B). For PIIm, V b is the largest signal element. Other conventions are the same as Fig. 1.
Comparison of PIIm with PII
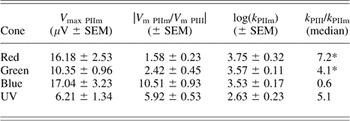
As a subelement of PII, it is not surprising that PIIm cone-signal amplitudes are smaller than found for PII. The loss is selective, however, and limited to r- and g-cone signals, while b- and u-cone amplitudes remain about the same (col. 1, Tables 5 and 6). Correspondingly, the r- and g-cone V max gains relative to PIII are reduced to 1–2 for the PIIm element, as compared to 2–4 for PII (col. 2, Tables 5 and 6). The b- and u-cone signal gains of 10 and 7, respectively, are about the same in PII and PIIm. The changes in sensitivity for cone signals relative to PIII (col. 4, Tables 5 and 6) do not appear to differ among PII and PIIm. Owing to the relative rejection of r- and g-cone signals, the metabotropic PIIm subelement represents a more cleanly b- and u-cone pathway than any of the other zebrafish ERG elements.
Cone–color signals for PIIm, the metabotropic b-wave element

Saturated amplitudes (V max PIIm, col. 1) and half-saturation irradiances (k PIIm, col. 3) for r- g- b- and u-cone signals are extracted by a spectral model [eqn. (1)] for six preparations, four treated with l-AP4 and two with CPPG. The median R 2 (all fits) was 0.99. The saturated amplitude of b-cone signals is greatest but similar to r-cone signals. V max gains relative to PIII (col. 2) are greatest for b- and u-cone signals. Sensitivity gains (col. 4) are significant for r- and g-cone signals (P < 0.05, t-test). Other conventions are the same as Table 4.
Spectral properties of the nonmetabotropic PIInm b-wave element
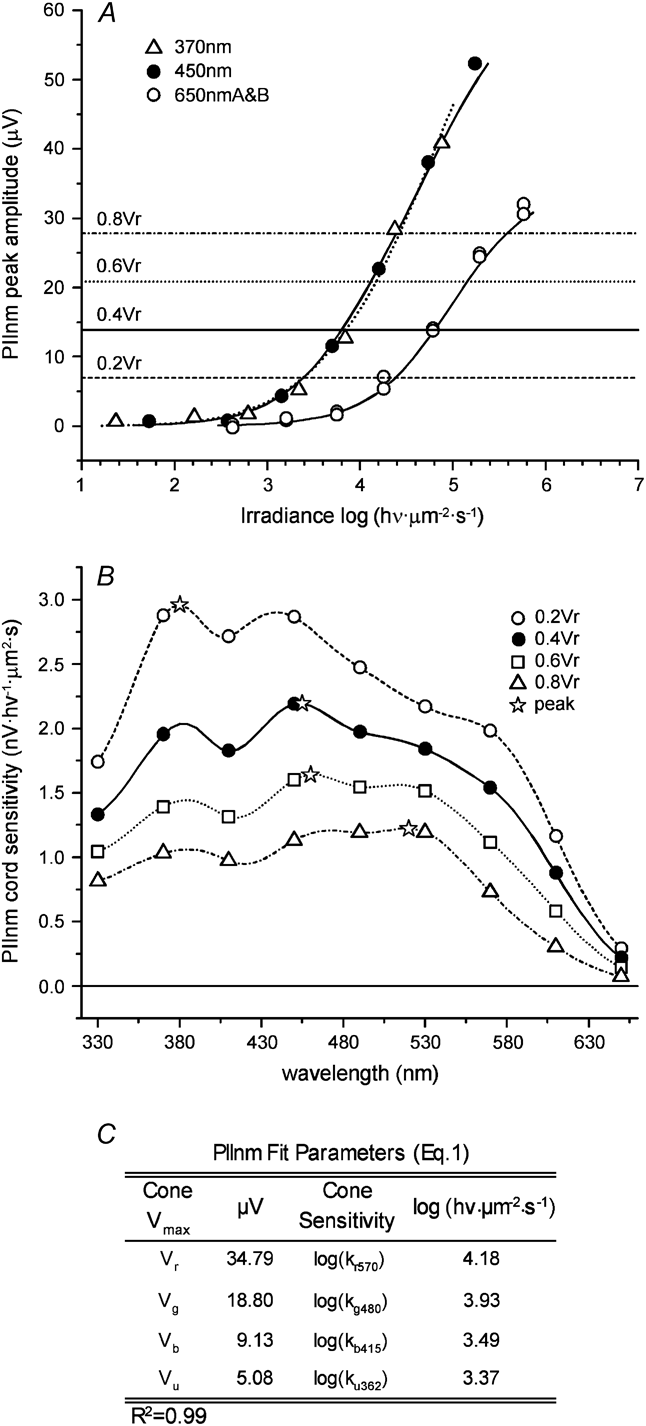
PIInm response–irradiance functions (Fig. 9A) are similar to PIII. While the saturated amplitudes for blue (450 nm) and UV (370 nm) are larger than red (650 nm), the difference appears less than double. The very large b- and u-cone signals seen in the metabotropic pathway are lacking. Spectral sensitivity (Fig. 9B) is more evenly distributed among cone signals. The PIInm spectral profile (Fig. 9B) shifts in peak from 380 nm for the 0.2V r criterion to 530 nm for the 0.8V r criterion. Similar waveforms and spectra for PIInm were seen when CPPG, an mGluR6 antagonist (120–180 μ m), was used in place of l-AP4, an mGluR6 agonist, to block metabotropic receptors. In five such spectral sets for PIInm, peaks were intermediate between b- and r-cone absorbance maxima shifting from 459 ± 20 nm at 0.2V r to 527 ± 8 nm at 0.8V r (means and SEM's). Contributions from r and g cones are very much in evidence. Modeled sensitivities (Fig. 9C, col. 3) for b- and u-cone signals are higher than for r- or g-cone signals, but V max gains for b- and u-cone signals are low, so that the V max distribution among cone types more resembles the PIII distribution ratio than the PII distribution ratio.
Spectral shape for PIInm, the nonmetabotropic non-AMPA/kainate b-wave element. (A). Plots of PIInm peak responses versus stimulus irradiance at three wavelengths reveal saturated amplitudes in the UV (370 nm) and blue (450 nm) are somewhat larger than those in the red (650 nm) but not to the extent seen for the PIIm (Fig. 8). Horizontal lines mark criterion levels for spectral sensitivity. Curves are model predictions [eqn. (1)]. (B). Spectral sensitivity curves for PIInm shift with criterion level. Stars mark peaks in the modeled broad spectral functions. These range from the UV (380 nm) at the 0.2V r criterion to the green (520 nm) at the 0.8V r criterion. (C). The table lists model [(eqn. (1)] fit parameters for this data set. These parameters generate the curves in (A) and both curves and points in (B). Except for scale factors, PIInm resembles PIII in spectral properties. Other conventions are the same as given for Fig. 1.
Comparison of PIInm with PII and PIII
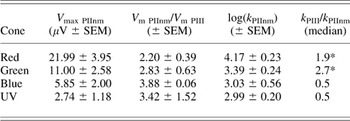
Cone V max amplitudes within PIInm are smaller than PII, consistent with PIInm as a subelement of PII (col.1, Tables 5 and 7). While r- and g-cone V maxs were slightly reduced with respect to PII, b- and u-cone V maxs were greatly reduced. The distribution of cone V maxs (col. 1, Tables 3 and 7) is quite similar to PIII. Correspondingly, V max gains compared to PIII are in the range 2–4 for signals from r, g, b, and u cones (col. 2, Table 7). As with other postphotoreceptor onset elements, sensitivities (col. 4, Table 7) are significantly increased compared to PIII only for r and g cones, but these sensitivity gains are smaller than seen in PIIm (col. 4, Table 6). For the PIInm subelement, the processing of signals appears relatively uniform for all cone–color signals.
Cone–color signals for PIInm, the nonmetabotropic b-wave element

Saturated amplitudes (V max PIInm, col. 1) and half-saturation irradiances (k PIInm, col. 3) for r-, g-, b-, and u-cone signals were extracted using a spectral model [eqn. (1)] for five preparations, three treated with l-AP4, an mGluR6 agonist, and two with CPPG, an mGluR6 antagonist. The median R 2 (all fits) was 0.99. The distribution of V max values is similar to PIII, and V max gains relative to PIII are all in the range 2–4 (col. 2). Sensitivity gains (col. 4) were small but significant for r and g cones (P < 0.05, t-test). Conventions are similar to Table 4.
Actions of TBOA, a glutamate uptake antagonist thought to block the nonmetabotropic b-wave
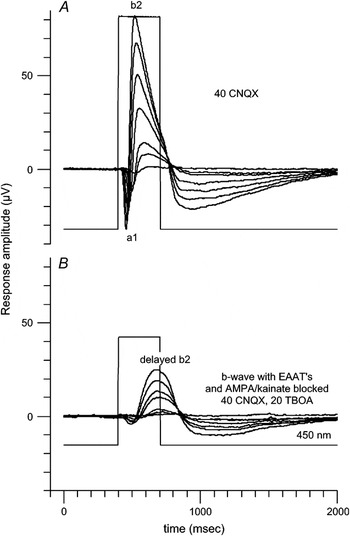
Wong et al. (Reference Wong, Cohen and Dowling2005b) suggest that zebrafish nonmetabotropic b-waves are mediated through glutamate transporters and can be blocked by transporter antagonists. The actions of TBOA, a broad-spectrum nontransported antagonist appear in Fig. 10. A CNQX-isolated a1 and b2 response appears in Fig. 10A. A diminished and slowed b-wave (delayed b2) appears on addition of TBOA (Fig. 10B). The a1 component (Fig. 10A) is reduced 85% by TBOA treatment (Fig. 10B). This a1 blockade was seen in four of five treatments (one had no a1 element). Remaining a-wave elements are accounted for by PIII. The b2 amplitude is reduced by more than a factor of 2 (delayed b2, Fig. 10B). The time to peak for this delayed b2 is greatly increased. This was seen in all TBOA treatments (N = 5). Higher doses of TBOA further reduce or eliminate even the delayed b2 responses (not shown). Because of major alteration in response kinetics, the tool of response subtractions is not useful. It appears likely that TBOA diminishes and/or delays both PIIm and PIInm elements and can progressively and nonselectively alter many postphotoreceptor ERG elements.
TBOA, a glutamate uptake antagonist, blocks a1 and slows b2. (A). a-wave (a1) and b-wave (b2) remaining after AMPA/kainate responses are blocked in an eyecup treated with CNQX (same as Fig. 2B). The combined waveform is composed of metabotropic and nonmetabotropic glutamate signals, as well as cone signals. (B). Addition of the glutamate uptake blocker TBOA to CNQX abolishes the a1 component, delays b2 peak time (delayed b2), and reduces b2 amplitude. Results suggest that a1, and its major component a1 nm, are mainly transporter phenomena. Actions on b2 are more complex. Because TBOA causes major changes in b2 response kinetics, the method of waveform subtraction for showing TBOA actions is difficult to interpret and is not shown.

Discussion
Zebrafish ERG elements and the implications of a spectral model
The existence of separable signals within the photopic ERG of zebrafish that can be attributed to isolated cellular mechanisms is confirmed. Seven onset elements are discerned in this study. Traditional elements are PII and PIII (Granit, Reference Granit1933). Photopic PIII is an isolated composite cone signal. Photopic PII is a non-AMPA/kainate composite b-wave element arising from ON bipolar cells. This can be separated into PIIm, a metabotropic signal element, and PIInm, a nonmetabotropic signal element, by agonists or antagonists of mGluR6. AMPA/kainate antagonists blocked two elements traditionally associated with OFF bipolar cells (Sieving et al., Reference Sieving, Murayama and Naarendorp1994). These are a2, a maintained vitreal hyperpolarization, and the stimulus offset d-wave. Two novel onset elements emerged from this study. The first, b1, is a rising-phase b-wave element that is blocked by AMPA/kainate antagonists. The second is a1nm, an early a-wave element. The a1nm element arises neither from AMPA/kainate glutamate receptors nor from mGluR6 but is blocked by antagonists of glutamate transporters.
An ERG spectral model based on summation of independent color processing circuits fits the pharmacologically and arithmetically isolated ERG elements well and provides a cone-signal component analysis from response–wavelength–irradiance data. The model shows no single photopic spectral sensitivity function in zebrafish ERG, even on neutral backgrounds, or for isolated ERG elements; rather, sets of nested spectral curves are generated with shapes and peaks that depend on criterion levels chosen. The pattern of nested spectral curves differs among the elements. The PIII cone-signal profile produces broad flat spectral curves with peaks ranging from UV to green, as does PIInm. By contrast for PIIm, the metabotropic ON-bipolar cell signal, spectra are greatly enriched in b- and u-cone signals and in large part, reject r- and g-cone signals, as implied by the work of Saszik et al. (Reference Saszik, Alexander, Lawrence and Bilotta2002a). Spectral curves are sharply peaked between b- and u-cone absorbance maxima.
PIII, the cone field potential
PIII is decomposed into signals originating with r, g, b, or u cones. A ready hypothesis to predict saturated cone-signal amplitudes within PIII is that they reflect the densities of cone types. In zebrafish, the cone mosaic is ordered. There are six cones in each repeat: two unequal double cones, a short single cone, and a long single cone (Engstrom, Reference Engstrom1960). The double cones are made up of a principal r cone and an accessory g cone. The long and short singles are made up of b and u cones, respectively. This gives a ratio of 2:2:1:1 for r:g:b:u (Robinson et al., Reference Robinson, Schmitt, Harosi, Reece and Dowling1993). On this stoichiometry, saturated r- and g-cone-signal amplitudes within PIII should be equal, as should b- and u-cone amplitudes. The amplitude of the latter pair should be half that of the former. Though this idea accurately predicts greater amplitudes for r- and g-cone signals than for b- or u-cone signals, and the equality b- and u-cone signals, it does not predict that r-cone amplitudes are double those of g cones or seven times those of b or u cones. Evidently, intrinsic properties of each cone, not just their numbers, must also come into play.
The PIII decomposition also suggests that cones differ in intrinsic half-saturation. On this measure, b and u cones are more sensitive than r cones by about a factor of 20–30. g cones appear three times more sensitive than r cones. Terrestrial solar irradiance at the u-cone peak is half that at the r- and g-cone peaks (Bird & Riorden, Reference Bird and Riorden1986) and even less on the short-wavelength limb. Sensitive b and u cones might be an adaptation. The greater sensitivity of b and u cones is carried forward to all postsynaptic elements, giving blue and UV stimulation the threshold sensitivity edge in all ERG onset elements.
b1, an AMPA/kainate-mediated b-wave element
The earliest phase of the zebrafish b-wave is CNQX sensitive. This is b1. The origin might be inner retina. Horizontal cells use AMPA/kainate receptors as do OFF bipolar cells. Both cell types are hyperpolarized by AMPA/kainate antagonists, and the light responses are blocked (Hankins & Ikeda, Reference Hankins and Ikeda1991; Hensley et al., Reference Hensley, Yang and Wu1993; Krizaj et al., Reference Krizaj, Akopian and Witkovsky1994; Nelson et al., Reference Nelson, Bender and Connaughton2003). In experiments with horizontal cells hyperpolarized by adapting backgrounds, outer retina, postsynaptic cone signals increase in amplitude, but peak times shorten (Chappell et al., Reference Chappell, Naka and Sakuranaga1985; Pflug et al., Reference Pflug, Nelson and Ahnelt1990). On this argument, the delayed peak time of the CNQX-treated b-wave, which leads to the b1/b2 distinction, is not likely caused by CNQX-hyperpolarized horizontal cells, though the b2 amplitude increase might be. CNQX blocks amacrine responses with attendant loss of GABAergic and glycinergic inhibition of bipolar cells (Connaughton et al., Reference Connaughton, Nelson and Bender2008). These actions are not expected to be fast enough to alter the rising phase of the ON-bipolar cell response. We speculate that b1 results from synaptic currents in the inner retina of zebrafish, perhaps synapses onto amacrine and ganglion cells. In the mammalian rod system, AII amacrine cells are quicker in rise time than rod-bipolar-cell inputs (Nelson, Reference Nelson1982; Dacheux & Raviola, Reference Dacheux and Raviola1986), and inner retina ERG responses are prominent for very dim stimuli (Sieving et al., Reference Sieving, Frishman and Steinberg1986). The zebrafish b1 element might be similar to positive scotopic threshold responses in mammals (Saszik et al., Reference Saszik, Robson and Frishman2002b; Bui & Fortune, Reference Bui and Fortune2004).
PII, a composite, non-AMPA/kainate ON-bipolar cell response
Isolation of photopic PII, the ON cone bipolar contribution to the light-adapted ERG, was pioneered in monkey retina by Sieving et al. (Reference Sieving, Murayama and Naarendorp1994). This group combined pharmacological blockades with response subtractions. We have used a similar approach to isolate zebrafish PII. The tetrachromatic cone signals that combine in zebrafish photopic PII are of particular interest for studies of color vision. Therefore, we additionally studied the spectral properties of isolated PII signals.
The zebrafish PII element is composed of two subelements: one (PIIm) is blocked by the metabotropic glutamate ligands l-AP4 or CPPG and the other (PIInm), a nonmetabotropic subelement, is not. In the cyprinid giant danio, TBOA, a nontransported, broad-spectrum glutamate transporter antagonist (Shimamoto et al., Reference Shimamoto, Lebrun, Yasuda-Kamatani, Sakaitani, Shigeri, Yumoto and Nakajima1998), partially blocked the ERG b-wave. This suggested that the nonmetabotropic element originated with glutamate transporter-associated chloride channels (Wong et al., Reference Wong, Adolph and Dowling2005a), agreeing with findings of similar glutamate-gated currents by patch physiology on the membranes of ON bipolar cells of zebrafish (Connaughton & Nelson, Reference Connaughton and Nelson2000), giant danio (Wong et al., Reference Wong, Cohen and Dowling2005b), and hybrid bass (Grant & Dowling, Reference Grant and Dowling1995, Reference Grant and Dowling1996). The hypothesis then is that the PIIm subelement is metabotropic, and the PIInm subelement is transporter mediated. TBOA affects all retinal glutamate transporters producing a variety of actions. Several authors have noted that without care in dosing, delay in b-wave peak time and total b-wave loss can result (Nelson & Connaughton, Reference Nelson and Connaughton2004; Wong et al., Reference Wong, Adolph and Dowling2005a). For this reason, PIInm is most reliably revealed by response subtraction after l-AP4 or CPPG treatments.
PIIm cone signals
The PIIm irradiance–response function has triple the amplitude for blue or UV stimulation as for red and the highest b- and u-cone signal composition of any onset element. Peak amplitude gains for b- and u-cone signals (relative to PIII) are in the range of 7–10, as compared to 1–2 for g- and r-cone signals. Spectral peaks for this element lie between b- and u-cone absorbance maxima for all criteria tested. Despite b and u cones being one third of the cone population, 80% of the PIIm saturated amplitude arises from b- and u-cone signals. While the PIIm signal represents all cones, the weighting suggests that subsynaptic contacts between b cones, u cones, and bipolar cells are special, driving more light-evoked current through the ON-bipolar cell pathway. Saszik et al. (Reference Saszik, Alexander, Lawrence and Bilotta2002a) were the first to note the enrichment of b- and u-cone signals in the zebrafish l-AP4-sensitive b-wave. The present study confirms this but adds that all cone types make metabotropic glutamate synapses with ON-type bipolar cells.
PIInm cone signals
PIInm spectral sensitivities are oriented toward longer wavelengths. Spectral profiles are broad. Peaks shift gradually from the long-wavelength limb of b-cone absorbance to the short-wavelength limb of r-cone absorbance as criterion levels increase. The distribution of cone–color signal amplitudes resembles that found in cone PIII, suggesting that the PIInm, excitatory amino-acid-transporter chloride-channel mechanism (EAAT5, Arriza et al., Reference Arriza, Eliasof, Kavanaugh and Amara1997), is uniformly shared among postsynaptic contacts between different cone types and ON bipolar cells. The mechanism does not particularly redistribute cone–color amplitudes or sensitivities. The gains in maximal signal amplitudes (relative to PIII) are in the range 2–4 for all cone spectral signals.
a1nm and a2, postphotoreceptor a-waves
In the photopic ERG of monkeys, both fast and slow a-wave components sensitive to AMPA/kainate blockers can be isolated (Bush & Sieving, Reference Bush and Sieving1994). These components are postreceptor and appear to originate with hyperpolarizing cone bipolar cells. The analogous ERG element in zebrafish is a2, a maintained, cornea hyperpolarizing CNQX-sensitive element. There is a further postphotoreceptor, a-wave element in zebrafish, a1nm. This element is CNQX insensitive and not driven by AMPA/kainate receptors. As AMPA-kainate glutamate synapses provide excitation to amacrine and ganglion cells, an inner retina origin for a1nm is unlikely. So a1nm may not be analogous to the postphotoreceptor scotopic threshold response of mammals (Sieving et al., Reference Sieving, Frishman and Steinberg1986) or to corneal negative OFF-cone bipolar signals identified in primate ERG (Sieving et al., Reference Sieving, Murayama and Naarendorp1994). The a1nm element is also insensitive to blockers of mGluR6 and is therefore nonmetabotropic. In giant danio, TBOA abolished this “a-wave” (Wong et al., Reference Wong, Adolph and Dowling2005a), similar to present results for zebrafish. We propose that zebrafish a1nm is intrinsic to PIInm and that the nonmetabotropic ON bipolar mechanism generates biphasic current flow. Perhaps a loss of inward sodium current as light stops PIInm glutamate transport is followed by loss of an outward chloride current, as transporter chloride channels later disassociate, generating a biphasic waveform. PIIm, by contrast, generates no associated a-wave.
Spectra and circuitry
The zebrafish photopic ERG presents a study in cone system integration for an animal model with rich genetics and equally rich color capabilities. Seven functionally distinguishable elements, PIII, a1nm, a2, b1, PII, PIIm, and PIInm contribute to responses at light onset. All the elements studied increase in saturated amplitude as stimuli move toward shorter wavelengths that progressively recruit more cone–color types. This result is successfully represented by a model that sums independently saturable sources for each cone–color signal. The result is not unexpected for the composite PIII signal arising from independent r, g, b, and u cones. For the b-wave elements, the implication is similar: separate ON-cone bipolar pathways for each cone–color type. A single cone bipolar pathway with pooled cone input sharing a common saturation level would not produce the observed and modeled outcome. The model is likely most applicable to the pharmacologically isolated b-wave elements, as these are studied under conditions that suppress cone-signal color interactions through interneurons. Hughes et al. (Reference Hughes, Saszik, Bilotta, Demarco and Patterson1998) showed opponent cone–color signals in the native b-wave. This suggests the underlying independent pathways studied here are entangled through interneuron circuitry.
Among ERG onset elements, there are two distinct spectral mixing patterns. The PIII mixture is spectrally broad and is shared by PIInm. The PIIm mixture is b- and u-cone focused. This focus is accompanied by increased voltage gain in the metabotropic b- and u-cone signals. The gain might be accounted for in two ways. The first is higher current densities through synaptic and nonsynaptic ion channels. The second is increased membrane area, as would result from a greater proliferation of cells. As ON-type bipolar cells of zebrafish do not differ greatly in dimensions (Connaughton et al., Reference Connaughton, Graham and Nelson2004), simply larger cells seem unlikely. This suggests specialized b- and u-cone bipolar cells, in addition to being metabotropic, may exist in a relatively high density as compared to other ON-type bipolar cells.
Acknowlegments
This research was supported by the Intramural Research Program of the National Institute of Neurological Disorders and Stroke, NIH. We express admiration for, and take inspiration from, the pioneering research of the late Joe Bilotta and his students and colleagues. We thank Anna Wesolowska, Risa Gordon, and Victoria Connaughton for critical contributions to the development of evoked potential recordings in zebrafish eyecup.