1 Introduction
Plasma photonic crystals can be used as dynamic waveguides and filters because of their tunable photonic band gaps by plasma parameters (such as voltage, pressure, temperature and an external magnetic field). A one-dimensional (1-D) plasma photonic crystal is formed by a periodic distribution of binary plasma and dielectric materials (Hojo & Mase Reference Hojo and Mase2004, Reference Hojo and Mase2009; Guo Reference Guo2009; Liu, Zhong & Liu Reference Liu, Zhong and Liu2009; Zhang, Ma & Liu Reference Zhang, Ma and Liu2009; Fan & Dong Reference Fan and Dong2010; Qi, Yang & Fu Reference Qi, Yang and Fu2010a ; Qi et al. Reference Qi, Yang, Lan, Gao and Shi2010c ). A two-dimensional (2-D) plasma photonic crystal is a structure in which plasma rods are arranged in the dielectric material periodically, or is a structure composed of dielectric rods in a bulk plasma (Sakai, Sakaguchi & Tachibana Reference Sakai, Sakaguchi and Tachibana2005; Sakai & Tachibana Reference Sakai and Tachibana2007; Sakai, Sakaguchi & Tachibana Reference Sakai, Sakaguchi and Tachibana2007b ,Reference Sakai, Sakaguchi and Tachibana c ; Qi & Yang Reference Qi and Yang2009; Qi et al. Reference Qi, Yang, Lan, Gao and Li2010b ; Qi Reference Qi2012). Recently, the concept of plasma metamaterials was proposed, where the dynamic permittivity or negative refractive index can be manipulated by the tunable parameters (Sakai et al. Reference Sakai, Sakaguchi, Naito, Lee and Tachibana2007a , Reference Sakai, Naito, Shimomura and Tachibana2010; Kong et al. Reference Kong, Liu, Zhang, Zhou and Li2011; Guo Reference Guo2012; Zhang, Liu & Kong Reference Zhang, Liu and Kong2013). For plasma photonic crystals, most work focuses on the band structures or negative refractive index properties. Through study of the transmission and reflection characteristics, absorbing properties of two types of 2-D plasma photonic crystal were studied (Qi et al. Reference Qi, Li, Fang and Li2015). It is found that they show broader and higher absorption characteristics than bulk plasma, and the absorption can be tuned via plasma parameters.
In this paper, by using the transfer matrix method, the absorbing properties of electromagnetic waves in a 1-D plasma photonic crystal are proposed. Compared with absorption of the bulk plasma, a 1-D plasma photonic crystal has more absorption bands and can be used to absorb electromagnetic waves below the plasma frequency. Furthermore, absorption characteristics of 1-D plasma photonic crystals versus periodic number, plasma collision, plasma frequency, plasma thickness, dielectric constant and incident angle have been investigated.
2 Results and discussions
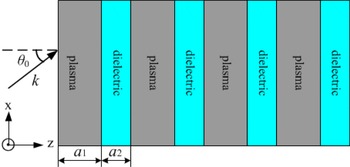
A schematic view of a 1-D plasma photonic crystal is given in figure 1, where the relative dielectric constant of plasma and dielectric are
 ${\it\varepsilon}_{p}$
and
 ${\it\varepsilon}_{b}$
with thicknesses
 $a_{1}$
and
 $a_{2}$
, respectively.
 $a$
,
 $k$
and
 ${\it\theta}_{0}$
are period length, wave vector and incident angle, respectively. When an electromagnetic wave is obliquely incident on the plasma, it can be divided into transverse electric (TE) polarization, where the electric field is perpendicular to the
 $xz$
plane, and transverse magnetic (TM) polarization, where the magnetic field is perpendicular to the
 $xz$
plane. In the model,
 $N$
is the period number of the plasma photonic crystal.
By obtaining the transmission
 $T({\it\omega})$
and the reflection
 $R({\it\omega})$
, absorption
 $A({\it\omega})$
can be calculated from
 $A({\it\omega})=1-R({\it\omega})-T({\it\omega})=1-|r|^{2}-|t|^{2}$
(Landy et al.
Reference Landy, Sajuyigbe, Mock, Smith and Padilla2008; Qi & Zhang Reference Qi and Zhang2011a
,Reference Qi and Zhang
b
; Shen et al.
Reference Shen, Yang, Zang, Gu, Han and Cui2012). If parameters of the plasma photonic crystal are not specified, the structure has dimensions given by the plasma thickness
 $a_{1}=0.4a$
, dielectric thickness
 $a_{2}=0.6a$
, periodic number
 $N=200$
, relative dielectric constant of dielectric layers
 ${\it\varepsilon}_{b}=1$
, normalized plasma frequency
 ${\it\omega}_{p}a/2{\rm\pi}c=0.3$
, collision frequency
 $v=0.02{\it\omega}_{p}$
and incident angle
 ${\it\theta}_{0}=0^{\circ }$
.
Schematic view of one-dimensional plasma photonic crystal with obliquely incidence.

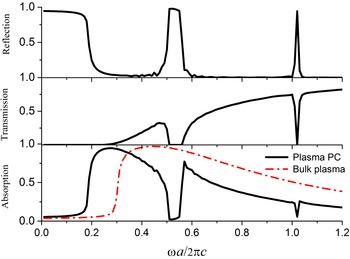
The reflection, transmission and absorption of a 1-D plasma photonic crystal.

Figure 2 shows reflection, transmission and absorbing curves of the 1-D plasma photonic crystal with the solid lines. The dot-dashed lines denote absorbing properties of the bulk plasma with the same plasma parameters and thickness as the photonic crystal. The horizontal axis denotes the normalized frequency
 ${\it\omega}a/2{\rm\pi}c$
and the vertical axis represents the magnitude. For the plasma photonic crystal, besides the normalized cutoff frequency at
 ${\it\omega}a/2{\rm\pi}c=0.2$
, two gaps appear due to the Bragg reflection of periodic structures: the large gap located at approximately
 ${\it\omega}a/2{\rm\pi}c=0.53$
and the very narrow gap located at approximately
 ${\it\omega}a/2{\rm\pi}c=1.02$
. For plasma, the cutoff frequency can be calculated from the relative dielectric function of the plasma, which is expressed as (Ginzberg Reference Ginzberg1970).
 $$\begin{eqnarray}{\it\varepsilon}_{p}=1-\frac{{\it\omega}_{p}^{2}}{{\it\omega}({\it\omega}+jv)},\end{eqnarray}$$
where the real part
 ${\it\varepsilon}_{p}$
is derived as
 $$\begin{eqnarray}Re({\it\varepsilon}_{p})=1-\frac{{\it\omega}_{p}^{2}}{{\it\omega}^{2}+v^{2}}.\end{eqnarray}$$
For
 $Re({\it\varepsilon}_{p})>0$
, an electromagnetic wave can transmit through the plasma. It is calculated that the normalized cutoff frequency is approximately
 ${\it\omega}a/2{\rm\pi}c=0.3$
, which is in accordance with the result shown by the simulation curve.
In figure 2, absorption of the bulk plasma appears above the plasma frequency
 ${\it\omega}a/2{\rm\pi}c=0.3$
with the highest absorption 97 % at
 ${\it\omega}a/2{\rm\pi}c=0.44$
. The absorbing value decreases to 26 % at
 ${\it\omega}a/2{\rm\pi}c=1.2$
. For the plasma photonic crystal, three absorbing bands appear due to interference of Bragg scattering: the first absorption appears below the normalized plasma frequency ranging from
 ${\it\omega}a/2{\rm\pi}c=0.2$
to 0.5 with the highest absorption of 95 % at
 ${\it\omega}a/2{\rm\pi}c=0.28$
. The absorption of the second band decreases monotonically from 76 % to 27 % with frequencies varying from
 ${\it\omega}a/2{\rm\pi}c=0.57$
to 1. Finally, when the frequency varies from
 ${\it\omega}a/2{\rm\pi}c=1.03$
to 1.2, the third absorption decreases from 27 % to 0.18 %. Compared with absorption of the bulk plasma, a 1-D plasma photonic crystal with the same thickness has more absorption bands and can be used to absorb electromagnetic waves below the plasma frequency. On the other hand, both the bandwidth and magnitude of the absorbing bands can be tuned as band gaps of the plasma photonic crystal can be changed by plasma parameters.
2.1 Influence of periodic number
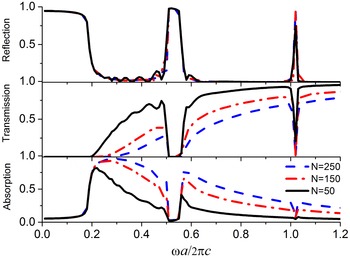
Using the same parameters as figure 2 except the periodic number, figure 3 shows the influence of a period number of
 $N=50$
, 150 and 200 on the reflection, transmission and absorption curves, respectively. As the period number increases, the location and magnitude of the reflection bands change little with the transmission magnitude decreasing. Therefore, absorption becomes more obvious with periodic number increasing. Physical insights into absorption in plasma have been revealed that the absorption is mainly attributed to collision processes of the plasma (Bronold et al.
Reference Bronold, Heinisch, Marbach and Fehske2011). As a large number of periods introduce more plasma layers into the plasma photonic crystal, the absorption increases with the period number increasing. However, it is difficulty to realize a plasma photonic crystal absorber when the period number is too large. In the following, the influence of collision frequency, plasma frequency, plasma thickness, dielectric constant and incident angle on the absorbing properties will be discussed. It may be more practical to obtain large absorption by varying these parameters.
Influence of period number on the reflection, transmission and absorption.

2.2 Influence of collision frequency
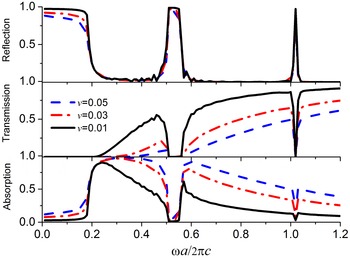
Figure 4 shows how the collision frequencies
 $v=0.01{\it\omega}_{p}$
,
 $v=0.03{\it\omega}_{p}$
and
 $v=0.05{\it\omega}_{p}$
affect the reflection, transmission and absorption curves. With increasing collision frequency, the location and magnitude of the gaps do not change, except for a small decrease of the cutoff frequency. However, magnitudes of the transmission decrease greatly due to a larger collision frequency which would lead to more loss in the plasma photonic crystal (Liu, Hong & Yuan Reference Liu, Hong and Yuan2006; Qi et al.
Reference Qi, Yang, Lan, Gao and Shi2010c
). Then, the absorption curves tend to increase. For
 $v=0.05{\it\omega}_{p}$
, the average absorption of the first band reaches over 94 %, and the absorption decreases from 93 % to 39 % for the next two bands.
Influence of collision frequency on the reflection, transmission and absorption.

2.3 Influence of plasma frequency
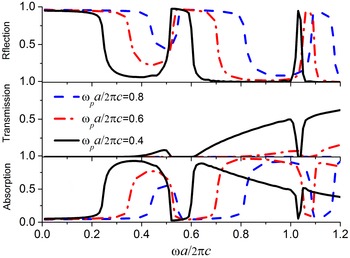
Figure 5 shows the reflection, transmission and absorption varying with plasma frequency, where the solid, dot-dashed and dashed lines correspond to the normalized plasma frequencies
 ${\it\omega}_{p}a/2{\rm\pi}c=0.4$
, 0.6 and 0.8, respectively. With plasma frequency increasing, cutoff frequency and gaps in the refection curves become larger with their locations shifting toward the higher frequency. The transmission curves decrease. For
 ${\it\omega}_{p}a/2{\rm\pi}c=0.8$
, the transmission is lower than 0.1 %, and cannot be seen in the figure. As plasma frequency increases, absorbing locations of the first two bands shift to the higher frequencies with the bandwidth enlarged. Magnitude of the first band tends to decrease, while the magnitude of the second band first increases and then decreases.
Influence of plasma frequency on the reflection, transmission and absorption.

2.4 Influence of plasma thickness
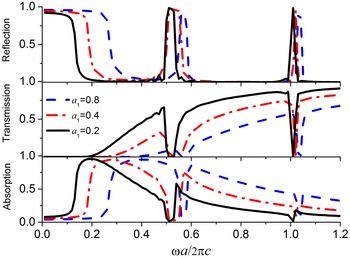
Figure 6 shows the transmission, reflection and absorption versus thickness of the plasma layer. Both the cutoff frequency and location of the first two reflection bands shift to higher frequencies as plasma thickness increases. At the same time, the transmission decreases because loss increases when more plasma is introduced into the structure. For absorption curves, locations of the first two bands shift to the higher frequencies with plasma thickness increasing, the bandwidths tend to decrease, while the absorbing magnitudes increase. For
 $a_{1}=0.8a$
, the average absorption is approximately 91 % for the first band. For the next two bands, the absorption decreases monotonically from 86 % to 33 %.
Influence of plasma thickness on the reflection, transmission and absorption.

2.5 Influence of dielectric layer
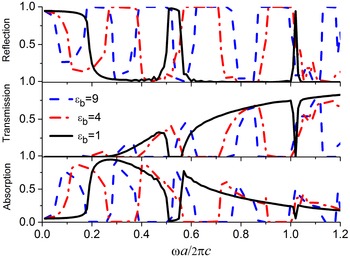
Figure 7 shows the reflection, transmission, and absorption versus the relative dielectric constant
 ${\it\varepsilon}_{b}$
of the dielectric layer. According to the variation principle, reflection bands shift toward lower frequencies because an increase of the dielectric constant leads to the frequency modes decreasing (Joannopoulos et al.
Reference Joannopoulos, Johnson, Winn and Meade2008). On the other hand, the large difference of relative dielectric function between plasma and dielectric makes more new gaps appear. As a result, more absorbing bands appear. Therefore, using a material with a larger dielectric constant would be more suitable to design multi-channel absorbers.
Influence of dielectric constant of dielectric layer on the reflection, transmission and absorption.

2.6 Influence of incident angle
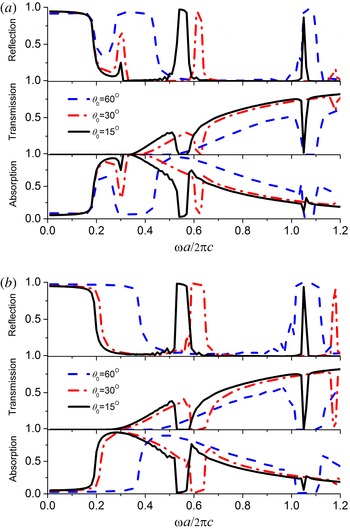
Figure 8(a) and (b) show the influences of incident angle on absorption for TM and TE polarizations, respectively. For TM polarization, when the incidence angle increases from
 ${\it\theta}_{0}=15^{\circ }$
to 60°, a new gap at approximately
 ${\it\omega}a/2{\rm\pi}c=0.3$
appears, while the second gap disappears for
 ${\it\theta}_{0}=60^{\circ }$
. For absorption of the first band, both the bandwidth and the magnitude decrease and the absorption curves of the second band shift to higher frequency with the magnitude increasing. For TE polarization, as the incident angle increases, locations of the cutoff frequency and gaps shift to the higher frequencies with bandwidths increasing. The transmission decreases with more waves being reflected. Therefore, the absorption bands shift to higher frequency with the bandwidth increasing.
Influence of incident angle on the reflection, transmission and absorption. (a) TM; (b) TE.

3 Conclusions
In summary, using the transfer matrix method, the absorbing properties of 1-D plasma photonic crystal have been investigated. Compared with bulk plasmas which have the same size and plasma parameters, the plasma photonic crystal can absorb waves below the plasma frequency. Furthermore, there is usually one absorbing band for the bulk plasma, while a 1-D plasma photonic crystal has more efficient absorption bands. Results show periodic number and collision frequency only control the transmission magnitude of the absorbing bands, while plasma frequency, plasma thickness and incident angle not only control the absorbing magnitude, but also affect the absorbing frequencies. Using material with a larger dielectric constant would be more suitable to design multi-channel absorbers. These features of 1-D plasma photonic crystals would have potential applications in tunable millimetre absorbers.