This symposium presents 10 articles forecasting the 2008 U.S. national elections. The core of this collection is the seven presidential-vote forecasting models that were presented in this space before the 2004 election. Added to that group are one additional presidential forecasting model, one state-level elections forecasting model, and one model forecasting the relationship between congressional votes and seats won by the parties. Some of the articles that are focused on the presidential race have also taken the opportunity to forecast the congressional elections as well.
The modern field of election-forecasting research is now about three decades old and continues to grow both in the number and diversity of models and in the sophistication of their evaluation (Jones Reference Jones2008; Campbell Reference Campbell2008a). In this introduction, after discussing some of the particular challenges facing the forecasting of this year's elections, I try to provide some reasonable standards by which we can evaluate the presidential vote forecasts after the election. The introduction concludes with a summary of the presidential forecasts.
The Challenges of 2008
From some perspectives, the 2008 presidential election ought to be an easy one to forecast. With President Bush's approval ratings hovering around the dismal 30% mark and with a weak election-year economy, how can 2008 be anything other than a big Democratic year? There are, however, some aspects of the election that may make this a far more challenging election to forecast. First, in addition to knowing the very unfavorable conditions confronting the in-party, we also know that the 2008 election is an open-seat election and open-seat elections have tended to be particularly competitive. Since 1868, while incumbents have won about two-thirds of their elections, non-incumbent candidates of the in-party have lost about as often as they have won (Campbell Reference Campbell, Campbell and Garand2000, 178–81; Reference Campbell2008b, 104–6; Mayhew Reference Mayhew2008). Historically, open-seat presidential elections have tended to be closely decided. The open-seat election of 2000 should remind us vividly of this possibility for 2008. One reason that open-seat elections may be so closely decided is that they may be less retrospective in nature. It is certainly plausible that President Bush's low approval ratings do not mean as much for Senator McCain as they would have meant for President Bush as a candidate, but how much of a difference will they make?
It is also worth observing that a large portion of the drop in President Bush's approval ratings between his reelection in 2004 and the 2008 campaign is a result of disaffection among Republicans and, to a lesser degree, independents. Just before the 2004 election, President Bush's approval rating stood at 48% (Gallup). Among Republicans it was 93% and among Democrats it was at 11%. As of this July, his approval rating as measured by Gallup had dropped 17 points to only 31%. Among Democrats his approval rating was nearly unchanged at 7% (Joe Lieberman, Zell Miller, and a few others). In sharp contrast, among Republicans it had dropped 26 points to only 67%. Independents dropped from 42% in 2004 to 28% in July. In an era of intense partisan polarization, bringing disenchanted Republicans back to their party should be a real possibility and winning back the support of large numbers of independents with Senator McCain's history of support among independents and his more centrist voting record in the Senate should also be doable. In short, President Bush's low approval numbers indicate that many voters are not happy with the Bush administration, but those who have been added to the ranks of the dissatisfied since 2004 are not necessarily inclined to vote for the Democrats.
Then there is the question of which party is the more unified going into the fall campaign. The Democratic Party's nomination battle between Obama and Clinton was unusually long and contentious, but the ideological differences between the candidates were small and the primary turnout and campaign contributions of Democrats signaled a good deal of enthusiasm. The Republican nomination, on the other hand, was not nearly as divided, but did not spark the same level of excitement. Many conservative Republicans were resigned to McCain as their candidate. The question is which problem is more solvable by the time of the conventions: Democratic disunity or Republican lethargy?
Then there is the question of campaign finance. This is the first election since the enactment of campaign finance reforms in the early 1970s in which the financing advantage of one candidate over another may affect the results. In rejecting public financing and opting instead to try to outraise and outspend his opponent, Senator Obama is the first major party presidential candidate since 1972 to avoid the general-election spending limits imposed when a candidate accepts public financing. How much more will Obama spend than McCain, will it make a difference to the vote, and will its effects be detected by indicators in the forecast models?
Last but not least, there is the question of race. As the first African American presidential nominee of a major political party will Barack Obama be hurt or helped by his race? African American turnout will undoubtedly soar, but there are others who may withhold their votes from the Democrat because of Obama's race. Is being an African American a net asset or a net liability to seeking the White House in 2008? This is unchartered territory and may not be reflected well in the predictors used in the models.
The congressional forecasts also face some challenges, beyond the coattail or surge effects of the unknown presidential vote. The most potent challenge facing forecasts of the U.S. House elections is the question of how many seats are being seriously contested by both major parties. There is a long-term trend of declining numbers of marginal seats, districts that have a real chance of changing hands. The median number of marginal seats (55 to 45% or closer) declined from 83 in elections (on-year and midterm) from 1950 through 1980 to just 53 in elections since 1980. As one might expect, net partisan seat swings also have declined with the decline in the number of seriously contested districts. The median gain or loss for a party declined from between 18 and 19 seats in elections from 1950 to 1980 to an anemic seven or eight seats since 1980. Fewer seats seriously contested constrain the potential for seat swings in either direction.
How many House seats will be seriously contested in 2008 and how will this affect the forecasts? In elections from 1998 to 2004, the number of marginal seats never exceeded 50. This kept seat changes in single digits. Then in 2006, with a series of scandals shaking House Republicans and the Mark Foley scandal breaking in the weeks before the election, the number of marginal seats increased to 64 and set the stage for Democrats to gain 31 seats. Will the number of marginal seats fall back to the low numbers suggested by their long-term trend or has another Democratic tide thrown more seats into play?
Evaluating the Forecasts
Every election presents different challenges for forecasting, but one challenge is constant: properly evaluating the forecasts after the election. After the dust settles in an election, casual observers often declare the forecasts to be either right or wrong. Unfortunately, the basis for making these judgments is not always either clear or justified. One thing, however, can be said justifiably and in advance about all election forecasts is that they are wrong (or, on very rare occasions, amazingly lucky). That is, all forecasts are wrong to some degree. They are not perfect and no forecaster would claim that they are. In the presidential forecasts, we are predicting the two-party popular vote division. Our indicators are imperfect.Footnote 1 Our model specifications are imperfect. The number of cases available to make estimations is relatively few. And even if we had the perfect model with the perfect measures and all the data that we wanted, candidates and voters are free to act in unanticipatable ways after our forecasts have been made. The congressional forecasts are subject to the same imperfections and unexpected post-forecast developments that may affect the election (such as the Mark Foley scandal of 2006).
The fact that the election has some challenging aspects to it and that forecasts will always differ from the actual vote does not mean that forecasts cannot be evaluated. Some forecasts are better than others and all can be evaluated using some reasonable benchmarks. Moreover, since the forecasts will be evaluated, it is better that they be evaluated based on some pre-established systematic metric rather than by some loose post-hoc impressions, as has been all too often the case in the past.
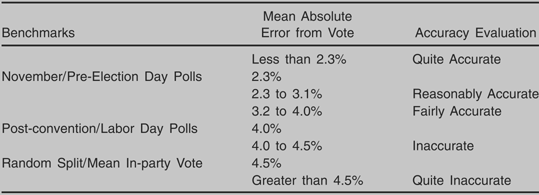
What benchmarks are reasonable to use in evaluating the presidential forecasts? As previously suggested, several naive forecasts are reasonable benchmarks for comparison (Campbell Reference Campbell2005). Two very simple forecasts are a guess that the national vote will divide randomly to split the vote evenly and a guess that the in-party will win its usual share of the vote. The mean absolute error of using either of these naive forecasts in elections from 1948 to 2004 has been 4.5 percentage points. At a bare minimum, an informed forecast ought to outperform these simple predictions. Upping the ante a bit, a forecast based on a simple reading of the polls at the start of the fall campaign, using either the polls immediately following the second convention or at Labor Day, has had an average absolute error of about 4 percentage points (4.3 for the post-convention poll and 3.7 for the Labor Day poll). The most strenuous standard for the forecasts are the polls conducted in the week before or on the day before the election. Since 1948, these polls have been off by an average of about 2.3 percentage points (2.6 points for the November poll and 2.0 for the last pre-election poll).
Table 1 arrays these benchmarks and their associated errors from most to least accurate. If a forecast made months in advance of the election is more accurate than the last polls taken in the last few days of the campaign, it is difficult not to judge that forecast to have been quite accurate. Put numerically, forecasts that are off by less than 2.3 percentage points of the two-party vote (not the spread) are quite accurate, as compared to the typical accuracy of the final polls. At the other extreme, if a forecast is less accurate than what a completely naive guess would be on average or less accurate than guessing the average in-party vote is on average, errors greater than 4.5 percentage points, then it seems fair to judge the forecast to be quite inaccurate. Forecasting critics, of course, may choose to use less temperate and more colorful terminology for this category.
Evaluating Presidential Vote Forecasts Relative to Three Benchmarks

The evaluation of forecast accuracy between these outer benchmarks is less clear, but the categories indicated in the table are at least tied to the benchmarks. Forecasts being less accurate than the average accuracy of the final polls but more accurate than the average accuracy of the polls at the campaign's outset (when many of the forecasts are made) can be classified as reasonably accurate or fairly accurate, depending on whether they are closer to the accuracy of the earlier polls or to the later polls. Forecasts that are less accurate than the average accuracy of the pre-campaign polls but more accurate than a naive guess can be reasonably termed as simply inaccurate.Footnote 2 Others may disagree with these labels or standards or propose those of their own, but there is a good deal of value in having standards based on some objective indicators and having them in place before the votes are cast and the forecasts are judged.
The 2008 Forecasts
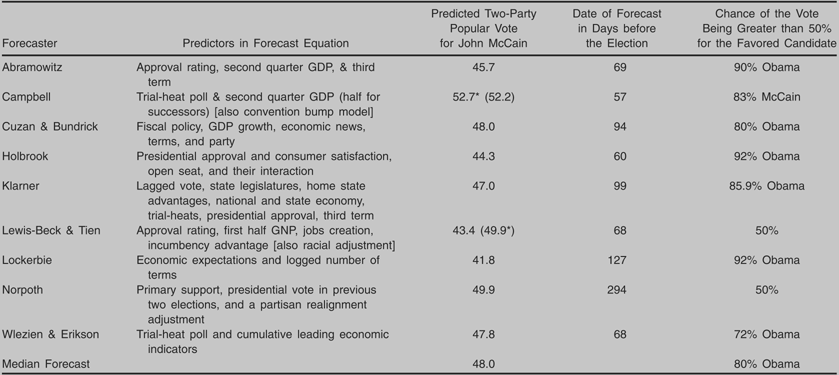
So what are the forecasts? Table 2 presents the presidential vote forecasts. The table presents the nine presidential vote forecasts, provides thumbnail descriptions of the models, and indicates both the lead time in days in which the forecasts were made and the level of certainty with which the forecasting equation has identified which candidate will receive the plurality of the national popular vote (not necessarily the electoral vote). The median of these nine forecasts indicates that Senator McCain will receive 48% of the two-party popular vote. Of the nine models, six predict that Obama will win a popular-vote plurality, one predicts that McCain will receive a popular-vote plurality, and two indicate that the election will be too close to call with any degree of certainty.
Forecasts of the In-Party Presidential Candidate's Two-Party Popular Vote

* Indicates the preferred forecast of the forecaster when two models or forecasts have been generated.