1. Introduction
Ship collisions have garnered increased attention in recent years because of their frequent occurrences and sizeable potential losses. To reduce these hazards, researchers have proposed some practical methods for ship collisions risk analysis, which can be divided into four main categories: extraction of maritime movement patterns (Qu et al., Reference Qu, Meng and Suyi2011; Pallotta et al., Reference Pallotta, Vespe and Bryan2013; Silveira et al., Reference Silveira, Teixeira and Guedes Soares2013), anomaly detection (Pallotta et al., Reference Pallotta, Vespe and Bryan2013; Riveiro et al., Reference Riveiro, Pallotta and Vespe2018), ship accident probability and consequences modelling (Li et al., Reference Li, Meng and Qu2012; Zhang et al., Reference Zhang, Yan, Yang, Wall and Wang2013; Wu et al., Reference Wu, Tian, Yan and Guedes Soares2019) and statistical analysis of maritime accidents (Kum and Sahin, Reference Kum and Sahin2015; Rezaee et al., Reference Rezaee, Pelot and Finnis2016; Zhang et al., Reference Zhang, Sun, Chen and Cheng2021). However, many of these approaches heavily rely on historical accident data. While the cumulative number of ship collisions worldwide is significant (EMSA, 2019), it is noteworthy that the frequency of ship collisions is low relative to the traffic volume in a given area. Therefore, the effectiveness of methods based on historical accident data is limited.
In recent years, the study on non-accident critical events (NACE) in potential ship collisions has become one of the most important research topics for maritime traffic safety risks (Du et al., Reference Du, Goerlandt and Kujala2020a). NACEs are also described as ‘conflict’ or ‘near-miss’ in literature, being used to assess collision risk in a surrogate measure. According to the previous definition (Du et al., Reference Du, Goerlandt and Kujala2020a), the NACE can be broadly understood as a realistic scene of navigation in which a ship continues to sail in its current state and may have an accident with other objects in time and space. In this study, the narrow definition of the NACE is a situation of near-collision, which has great potential to be a collision (Lei et al., Reference Lei, Tsai, Wen and Peng2017). In case of a ship encounter, two ships will face the consequences of collision if they do not take measures. Systematic identification of NACEs with different methods has been developed based on traffic conflict theory and technology (Debnath and Chin, Reference Debnath and Chin2006). These methods include the synthetic indicator approach, the safe boundary approach and the velocity-based approach (Chen et al., Reference Chen, Huang, Mou and Gelder2019a). Furthermore, the ship domain method in the safe boundary approach is considered a relatively mature method for studying macro collision maritime risks (Zhang et al., Reference Zhang, Goerlandt, Montewka and Kujala2015; Bakdi et al., Reference Bakdi, Glad, Vanem and Engelhardtsen2019; Zhang et al., Reference Zhang, Feng, Qi, Shu, Zhang and Wang2019). The safe boundary approach for NACEs detecting and identification has become popular due to available data from the Automatic Information System (AIS) (IMO, 2001, 2003), which provides information about the vessel type and size, position and other navigational states.
Many academic works have proposed methods of identifying NACEs, but few studies are working on practical applications of maritime risk. However, there have been attempts to apply the concept of NACE in practical scenarios. For example, Goerlandt and Kujala (Reference Goerlandt and Kujala2011) posed a model of ship collision probability based on AIS data, and applied the model to actual water space risk analysis in the Gulf of Finland. Qu et al. (Reference Qu, Meng and Suyi2011) used three-ship collision risk model to quantitatively assess ship collision risk in the Singapore Strait. Rawson and Brito (Reference Rawson and Brito2021) explicitly proposed the practical application of the NACEs’ concept to assess spatial collision risk. They specifically studied the encounter rates in the United States and focused on the practical considerations for implementing the approach to describe navigational risks in the Gulf of Mexico. Zhang et al. (Reference Zhang, Sun, Chen and Cheng2021) studied the ice-free navigation period of Ro-Pax ships in the Gulf of Finland, and estimated collision probability scenarios through collision detection models (ABCD-M) based on the behaviour of collision avoidance and generated scenarios for ship damage stability assessment. Furthermore, the concept of NACEs is also applied from a new perspective. For example, researchers predicted the collision risk based on NACEs through convolutional neural networks (Zhang et al., Reference Zhang, Feng, Goerlandt and Liu2020). The NACEs’ concept was also applied to the bridge alarm to detect the ship collision and take action to eliminate the conflict (Du et al., Reference Du, Valdez Banda, Goerlandt, Huang and Kujala2020b).
In this process, there is a lack of attention to the time variation about NACEs. For example, although some studies have shown that there are some regular fluctuations in the temporal features of NACEs (Kujala et al., Reference Kujala, Hänninen and Arola2009; Chen et al., Reference Chen, Mou and Gelder2019b; Xin et al., Reference Xin, Liu, Yang, Zhang and Wu2021); they only show the primary time characteristics month by month and hour by hour, without further examining their relevant characteristics and explaining the reasons for such phenomenon. As Rawson and Brito (Reference Rawson and Brito2021) mentioned, the application of NACEs is not a purely academic issue but has value to expand the application scope of the NACEs concept for risk assessment in maritime management.
Researchers have paid less attention to traffic and natural environmental conditions than to human factors, which are better understood and controlled (Luo and Shin, Reference Luo and Shin2019). This paper focuses on the time-variation characteristics of NACEs. The features of marine environmental conditions at different times can be used to regulate vessel traffic flow (Jensen et al., Reference Jensen, Hines, Holzman, Moore, Jahncke and Redfern2015; Zhang et al., Reference Zhang, Yin, Wang and Hui2018), better allocate berth positions (Du et al., Reference Du, Chen, Lam, Xu and Cao2015; Zhen et al., Reference Zhen, Liang, Zhuge, Lee and Chew2017) and improve collision probability modelling (Goerlandt and Kujala, Reference Goerlandt and Kujala2011; Yoo and Kim, Reference Yoo and Kim2019). In addition, several studies on oil spills risk assessment have been carried out (Fernandes et al., Reference Fernandes, Braunschweig, Lourenço and Neves2016; Al Shami et al., Reference Al Shami, Harik, Alameddine, Bruschi, Garcia and El-Fadel2017; Wang et al., Reference Wang, Guo, Kong and Xu2020). However, due to the lack of understanding of the feature of a high occurrence of potential accidents, the time of potential accidents evaluated is often set randomly. Furthermore, particle diffusion simulation is based on the flow field at sea, making this approache limited by the occurrence time of the potential accident for large-scale applications, which can be solved by studying the temporal features of NACEs.
Some mega-ports (e.g., Port of Shanghai, Port of Antwerp, and Port of Hamburg) are tidal ports. The unique tidal characteristics of the region make navigation challenging. Large cargo ships can only pass through the entrance channel when the tide is high enough, making them dependent on the tide when entering or leaving the port (Du et al., Reference Du, Chen, Lam, Xu and Cao2015; Zhen et al., Reference Zhen, Liang, Zhuge, Lee and Chew2017). The Ports of Shanghai and Ningbo–Zhoushan on the Yangtze Estuary and adjacent coastal waters are two of the busiest ports in the world. There is abundant data in the Yangtze Estuary, which makes it an ideal place to study the temporal features of NACE, and the results are also instructive for ports affected by tides.
This paper applies the quaternion ship domain method using AIS data to explore the temporal features in NACEs occurrences over time and the impact of tides on NACEs. Understanding the variation of NACEs with tides is valuable for adjusting navigation and reducing collision risk. Otherwise, this paper proposes a structured and systematic research paradigm for NACEs analysis based on data-driven, in which it determines a statistical NACE and tidal state scheme that takes into account the half-tide level and the nearest time. This paper is structured as follows. Section 2 outlines and introduces the methods and data used in this study. Section 3 provides an analysis of the results. Section 4 discusses and assesses the possible uncertainties in the results. Section 5 concludes.
2. Data and method
2.1 Study area and study period
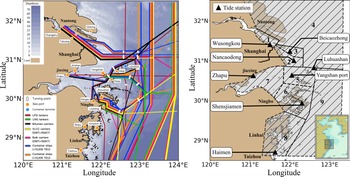
The study area in this paper is from the Yangtze Estuary to the Taizhou shore of the East China Sea. According to the guidelines for major ports, waterways and ship routes (MSA, 2018), the study waters are divided into nine subregions (as shown in Figure 1). Subregion 1 (Wusong), subregion 2 (Nancao Channel) and subregion 3 (Beicao Channel) are the waters of the Yangtze Estuary. The boundaries of three regions, which are subregion 5 (Yangshan), subregion 6 (Zhoushan) and subregion 9 (open waters), are divided based on three recommended routes: from the Yangtze Estuary to the Xiazhimen pilot station, from the Yangtze Estuary to the Yangshan pilot station, and from the Yangtze Estuary to Nanpeng Island.
Map showing the locations mentioned in this paper. (a) The shipping lines base on the traffic flows from the hiFleet (http://www.hifleet.com/). The bathymetry is taken from the general bathymetric chart of the oceans dataset (Weatherall et al., Reference Weatherall, Tozer, Arndt, Bazhenova, Bringensparr, Castro, Dorschel, Ferrini, Hehemann, Jakobsson, Johnson, Ketter, Mackay, Martin, Mayer, McMichael-Phillips, Mohammad, Nitsche, Sandwell and Viquerat2020), (b) Subregions:1. Wusong; 2. Nancao Channel; 3. Beicao Channel; 4. The north of the Yangtze Estuary 5. Yanshan; 6. Zhoushan; 7. Hangzhou Bay; 8. Taizhou 9. OpenWater

We select the data in October to avoid the influence of multi-environmental conditions. Firstly, the ship activities have remained relatively stable in every month, reflecting the slight variance of monthly port throughput. The monthly cargo throughput stands at 150 million tons and the monthly container throughput stands at 5⋅9 million TEU in 2019 (MOT, 2019). Secondly, it is relatively less challenging to study the impact of tides on NACEs because of better weather and calmer sea conditions than in other months. The north-northeast wind is a common wind direction, and the average wind speeds are from 5 to 7 m/s. The waves mainly come from the east-southeast, and the average significant wave height is from 0⋅6 to 0⋅9 m. The study area has a regular semi-diurnal tide, with an average tidal range greater than 2 m. Sea fog and tropical cyclones are generally inactive (Qian et al., Reference Qian, Leung, Chen and Huang2019; Yao et al., Reference Yao, Zhao and Li2020). The extreme cold wave does not occur in October (Ma and Zhu, Reference Ma and Zhu2018). Furthermore, the study period should be at least a whole month because the period of a synodic month is about 29⋅5 days, during which there are two spring tides and neap tides.
2.2 AIS data
The AIS data is global real-time data provided by the Canadian company exactEarth. This data, which is received and stored by satellites and base stations, can automatically provide information for other ships and coastal management departments. Since 31 December 2004, SOLAS Reg19 has required all ships with a gross tonnage of 300 and greater that engage in international voyages, cargo ships with a gross of 500 and greater that do not participate in international voyages, and passenger ships of all sizes to have AIS equipment installed. The AIS should always be kept running (IMO, 2001). The AIS data provides the ship position and navigation status to describe a ship navigation behaviour at sea. In this study, the AIS data is selected according to the type of sailing vessel, including cargo ships, tankers, containers, passenger ships and rescue vessels, which together account for 67⋅5% of all ship collisions (EMSA, 2019). The spatial range of the AIS data selected in this paper is 28⋅50-32⋅50°N, 120⋅50-123⋅50°E, and the period range is 1–31 October 2019. Local time is used in the study, and local time is UTC + 8 h.
2.3 Ship domain method
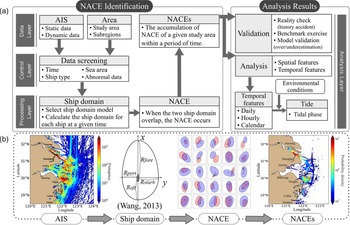
The generalised intelligent quaternion ship domain (GIQSD) model is a generic domain model based on analytical expressions. The shape of the ship domain is determined by the quaternions of 4 radii, namely, fore, aft, starboard and port, shown in Figure 2(b). Operability is considered in addition to the ship length, the ship speed and course. Furthermore, navigators’ nautical skill levels and physical and mental states are also calculated and modified by the blur coefficient (Wang, Reference Wang2013). This adaptive model regulated by the navigational state allows the ship domain to be adjusted for different waters, thereby avoiding severe overestimates of NACEs. The GIQSD model based on the Quaternion ship domain is given by:

where


Framework for research on NACEs

In Equation (2.1), the possibility value r ${\in}$ (0,1) is used to indicate the collision risk of the corresponding fuzzy boundary e fuzzy boundaries. The k is the shape index of the GIQSD related to the state of the navigator.
In practice, r is usually set to 0⋅5, and the fuzzy rule of shape index k is mentioned in the literature (Wang, Reference Wang2013). In this paper, the shape index k is set to 2 because the state of the navigator cannot be obtained from AIS data. In Equation (2.2), ${R_{\text{fore}}}$ , ${R_{\text{aft}}}$
 , ${R_{\text{starb}}}$
 and ${R_{\text{port}}}$
 represent the forward, aft, starboard and port radii of the quaternion given by:

where L is the ship length,$\; {k_{\text{AD}}}$ and ${k_{\text{DT}}}$
 represent gains of the advance, ${A_D}$
 , and the tactical diameter, ${D_T}$
 , and can be calculated as follows: where ${V_{\text{own}}}$
 is the ship speed in knots:

2.4 Tide data
The hourly water level data were collected from the tidal table released by the National Marine Data and Information Service. The location of tidal stations is shown in Figure 1. The representative tidal stations for each subregion are matched as follows: Wusong Port for Wusong waters, Nancaodong station for Nancao Channel, Beicaozhong station for Beicao Channel waters, Luhuashan station for the northern Yangtze Estuary, Xiaoyangshan station for Yangshan waters, Shenjiaman station for Zhoushan water and open sea, Zhapu station for Hangzhou Bay waters, and Haimen station for Taizhou waters.
2.5 Research framework
The research framework of NACEs (Figure 2) comprises two parts. These two parts are divided into four layers. Moreover, the layer processing is to be more structured in the program to achieve modular processing.
Part 1 Research framework starts with the first phase in which NACEs are identified from AIS data, using the ship domain method. In this process, data and study area should be preprocessed firstly, including data selection, time standardisation and elimination of abnormal data. Then, the NACEs identification is performed using the ship domain model based on the cleaned AIS data.
Part 2 Analyse the results of NACEs identified in Part (i). Specifically, verify the validity of the results as much as possible and then conduct a spatiotemporal analysis of the results. Next, the temporal characteristics of NACEs are discussed focusing on the relationship between NACE and tide.
2.5.1 Part 1: NACEs identification
2.5.1.1 AIS data preprocessing
After reading the ship information, data preprocessing is required. The preprocessing is based on type of ship. This study selects cargo ships, tankers, containers, passenger ships and rescue vessels as the research objects. Although fishing vessels also account for a certain proportion in the collision, the navigation behaviour of fishing vessels is related to the fishing area, which is not considered in this study. This study selects the ship data in the study area and excludes the ship data equipped with AIS in inland rivers and lakes. It should be noted that AIS data will be temporarily missing or have a large blank section due to occasional interference or artificial shutdown of AIS signal. This article focuses on the macro collision risk research, and the data used is about 20 million or more. Given the actual calculation efficiency, this study does not interpolate the ship trajectory to supplement the missing data.
For the abnormal data, (1) according to the ratio of ship length to ship width, this paper selects the ship data whose ratio of ship length-to-ship width is between 2⋅2 and 9⋅3. Since the ship length and width data are input artificially by AIS equipment, there is the phenomenon of human error recording or intentional error recording. The intentional error recording is due to some nearshore ship captains inputting oversize data to avoid nearby ships. (2) According to ship ground speed, firstly, the data of ship speed equal to 0 knots are eliminated; secondly, the data of ship speed greater than 50 knots were eliminated, which is caused by the noise of sensors and data ships.
2.5.1.2 Regional division data
The study area is drawn as a closed curve using the Google Earth Tool and exported to KML format. When using AIS data with large area, the data need to be screened because the range includes inland rivers and lakes. Then, when analysing potential ship collisions according to the subregion, we can get more detailed information, which helps understand the change characteristics.
2.5.1.3 Identify NACEs
This study aims to provide a simple, fast and efficient algorithm for identifying NACEs in a target area over a period of time. The algorithm can be summarised as follows (as shown in Figure 2(b)):
Step (i): Time-standardised processing. The first step determines the calculation start and end time, while all times are adjusted to the UTC. Then it is necessary to standardise the data time and process every single ship according to the MMSI number: the standard time $\text{tim}{\text{e}_{\text{sta}}}$ , determines the information collection of the ship in the $\text{tim}{\text{e}_{\text{sta}}} \pm \varDelta t/2$
 according to the calculation time interval and finds the information of AIS data of the ship closest to the $\text{tim}{\text{e}_{\text{sta}}}$
 at that time. After processing, the cycle was performed at the calculated time, with Steps (ii-v) performed each time.
The calculated number of cycles is the order of the standard time multiplied by the number of vessels at that time. We compromise between the computer computational efficiency, the data quantity, the accuracy requirements of the results, and the calculation time. The computation time interval is finally set at 2 min.
Step (ii) : Single-ship ship domain calculation. According to the parameters required in the ship domain, the ship domain at the current time is calculated, and the data is converted from the relative coordinates centred on the ship to the geodetic coordinate system, and the third step is calculated by longitude and latitude.
Step (iii): NACE identification. Determining safety criteria is key to calculating potential collision events with four safety criteria (Szlapczynski and Szlapczynska, Reference Szlapczynski and Szlapczynska2017): (a) The ship field is not violated by the target ship; (b) Target ship field is not violated by its own ship; (c) Neither ship field is violated by each other; (d) The two-ship fields do not overlap. In general, the four criteria are safe for both ships and are in line with traditional domain definitions. This paper focuses on the fourth one, which is the overlap between two ship domains that triggers a potential collision event to compute NACEs as many as possible. The safety criteria of two ship domains overlap is also widely used (Rawson et al., Reference Rawson, Rogers, Foster and Phillips2014; Wang and Chin, Reference Wang and Chin2016).
Step (iv): Macro perspective. When a potential collision event is identified, save the ship information for both parties. It must be noted that the calculation must identify the most dangerous moment that two ships will encounter. By comparing the MMSI of the two ships in the event with the previously recognised record results, the closest moment within this time period was found, and the information at this moment was recorded as the most dangerous moment. At the same time, we assume that the two ships will not meet again within 30 min. If the two ships meet in more than 30 min, it is regarded as a new ship encounter process. Considering that the time scale of this study is one month, the potential collision event that the two ships meet again is avoided.
Step (v): Record the initial result. When the non-accident approaching events of the two ships were identified, the static information and the dynamic information of the two ships were recorded separately at the time of the potential collision.
2.5.2 Part2: Results analysis
The analysis of the potential collision calculation results is to identify the spatial and temporal characteristics of NACEs, and determine the ship characteristics and navigation status involving the ship potential collision events. Spatial analysis refers to grid the calculated results to further analysing features. Time analysis means analysing the results on different time scales, combined with natural conditional tides.
2.5.2.1 Results test
Validated information has the value of analysis. Du et al. (Reference Du, Goerlandt and Kujala2020a) summarised the generic approaches to establish validity, including (i) benchmark exercise, (ii) reality check, (iii) quality assurance and (iv) independent peer review. This paper validates the clustered results with historical accidents and compares them with other studies. Finally, it discusses the over/underestimation of outcomes in open and restricted waters.
2.5.2.2 Tidal perspective analysis
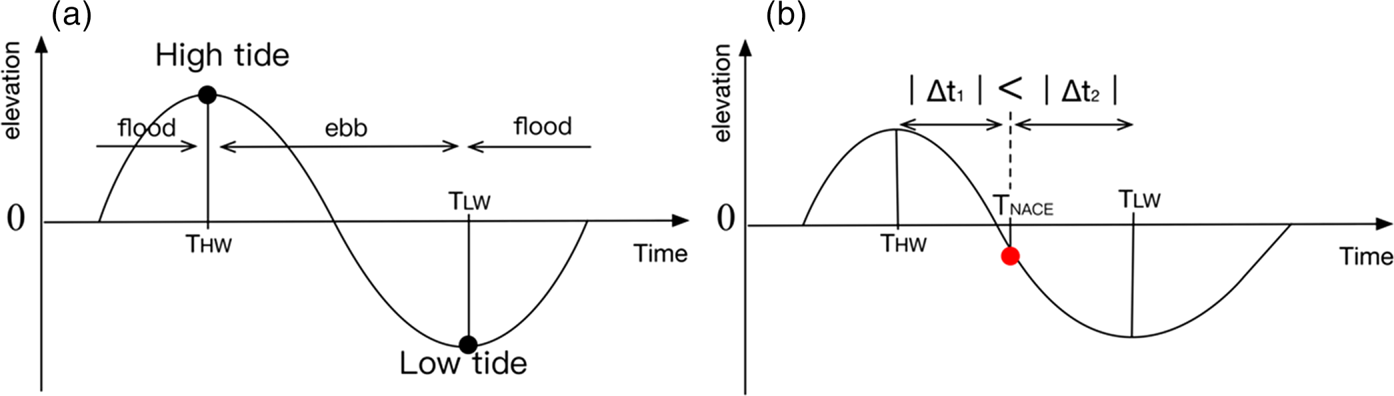
Figure 3(a) shows a schematic diagram of a tide cycle. ${T_{\text{HW}}}$ indicates the time of the high tide and ${T_{\text{LW}}}$
 indicates the time at the low tide. The duration of rising is the time during which the tide level rises in a tidal cycle. Similarly, the duration of ebb is the time during a tidal cycle when the tide level falls.
Schematic of tidal state

The tidal state of the data in the tidal table is first marked by Equation 2.8, and ${\zeta _n}$ indicates the tide level at the n moment:

Considering the case where the tide is an irregular semidiurnal tide, such a situation exists in Figure 3(b). When NACE occurs at the time of ${T_{\text{NACE}}}$ , the tide level is at a low water level (ζ < 0), where the water level is under the half-tide level. Although ${T_{\text{NACE}}}$
 is closer to the high tide ${T_{\text{HW}}}$
 , in terms of the time interval between $\varDelta {t_1}$
 = ${T_{\text{NACE}}}$
 -${T_{\text{HW}}}$
 and $\varDelta {t_2}$
 = ${T_{\text{LW}}}$
 -${T_{\text{NACE}}}$
 , since it occurs at low water level, the NACE at that moment should be recorded as the first $\varDelta {t_2}$
 hour of the low tide rather than the second $\varDelta {t_1}$
 hours of the high tide. Because the actual tide has unequal flood and ebb tide, and the tide level of 0 m is a standard point to distinguish a certain tidal moment close to high/low tide. Here we consider the nearest time statistics method of zero water level. It is more appropriate to use the half-tide level to distinguish the statistical range belonging to high/low tide.
Firstly, we select the high/low tide as the standard time (${T_{\text{standard}}}$ ), when the tide level of NACE occurrence time (${T_{\text{NACE}}}$
 ) is greater/less than 0 m. Then, we calculate the time interval (${T_{\text{ref}}}$
 ) between the NACE occurrence time and the nearest high/low tide. Finally, plotting the distributions of NACEs under different tidal states:

where ${T_{\text{standard}}}$ can be expressed:

3. Results
3.1 General temporal features of NACEs
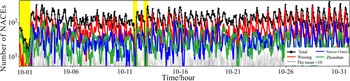
In total, 105,598 cases of NACEs have been identified in this study area in October 2019. The spatial distribution of NACEs is shown in Figure 2(b). NACEs mostly occurred in three subregions, Wusong waters (45%), Nancao Channel (22%) and Zhoushan waters (20%), which account for approximately 87% in total. NACEs that occurred in Yangshan waters accounted for only 6% in total. All the other subregions accounted for only 7% of all NACEs. The temporal change of NACEs occurred in each subregion is shown in Figure 4. The periodic oscillation of NACEs almost has two crests and troughs each day. The monthly mean of crests is 445 pcs/h and of troughs is about 45 pcs/h. The overall mean of NACEs in Wusong waters, Nancao Channel, and Zhoushan waters are 67 ± 45 pcs/h, 33 ± 21 pcs/h, 30 ± 20 pcs/h, respectively, while the means of crests are 306 pcs/h, 121 pcs/h and 118 pcs/h.
Time series of potential ship collisions(UTC+8). Black denotes NACEs in all study areas, and grey denotes the area where the average number of NACEs is less than 10. The yellow shaded area is temporarily unclear and may be related to the original data

3.2 Temporal variation of hourly NACEs
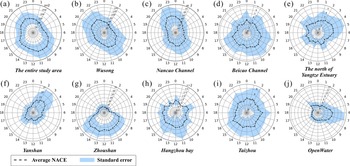
The rose diagram shows a symmetrical distribution of high occurrence periods of NACEs, as shown in Figure 5(a). The primary NACEs occurrence time is about 200 pcs/h from 0900 to 1100, and about 160 pcs/h from 2000 to 2300. The minimum NACEs is as less as 50 pcs/h from 0300 to 0500. The rose diagram of NACEs in Wusong waters and Nancao Channel shows a more symmetrical pattern. The primary NACEs in Wusong waters are about 80 pcs/h from 0900 to 1100 and 90 pcs/h from 2000 to 2200, while the minimum is only about 40 pcs/h from 0200 to 0400, as shown in Figure 5(b). However, the primary NACEs in Nancao Channel are about 80 pcs/h from 0800 to 1200 and 2200 to 2400, with about 1 h lag from that in Wusong waters, while the minimum is only 25 pcs/h from 1700 to 1800, as shown in Figure 5(c). The primary NACEs in Zhoushan is about 50 pcs/h from 0700 to 1700, all during the daytime, as shown in Figure 5(g). The primary NACEs in Yangshan waters are only about 15 pcs/h from 0200 to 0400, as shown in Figure 5(f).
Hourly statistics of NACEs(UTC+8)

3.3 Temporal variation of NACEs on calendar view
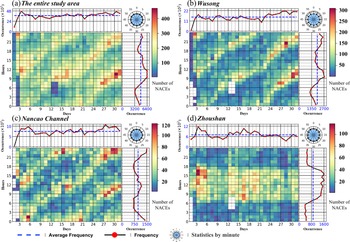
The hourly NACEs of the one month are shown in Figure 6. The appearance of a striped pattern combined with light yellow and red blocks in the main part of each subpanel represents high frequency and evolution pattern of the occurrences of NACEs.
Calendar graph of NACEs(UTC+8). The main part of each subpanel of Figure 6 shows the hourly NACEs occurrences in each day. The top part of each subpanel is the daily accumulated occurrences of NACEs for each day. The right part of each subpanel is the monthly accumulated occurrences of NACEs for every hour in October

The daily NACEs occurrences of the entire study area are roughly between 2900 and 4600 pcs/day with the mean of 3700 pcs/day in the top panel of Figure 6(a). All of the monthly accumulated NACEs occurrences for each hour show a periodic oscillation pattern, with the maximum at 6400 pcs/h from 0900 to 1200 and the minimum at 3200 pcs/h from 0300 to 0600 and the mean is about of 4800 pcs/h. Temporal variation of NACEs in Wusong waters and Nancao Channel presents similar patterns as Figures 6(b) and 6(c). There are two main NACEs period occurrences (light yellow and red blocks) in each day column and the period occurrences become later by approximately one hour day by day. Variation of total NACEs occurrences for the daily column are shown in the top panel of Figures 5(b) and 5(c) with a mean value of 1500 pcs/day, 750 pcs/day for Wusong waters and Nancao Channel, respectively. The total of monthly NACEs over each hourly row is in the right panel of Figures 6(b) and 6(c). The major NACEs happen around 0900 to 1100 with 2600 pcs/h and minor NACEs from 2000 to 2200 with 2400 pcs/h for Wusong waters. The major NACEs happen from 2200 to 2400 with 1400 pcs/h and minor NACEs from 0800 to 1200 with 1000 pcs/h for Nancao Channel. However, the temporal variation of NACEs occurrence in Zhoushan waters is different from that in Wusong waters and Nancao Channel in Figure 6(d). More than 70% of NACEs occurred during the daytime between 0700 and 1700.
3.4 Correlation between NACEs and tidal phase
The researchers pay attention to human error at present, while the natural environment is a major factor in the causes of maritime accidents (Luo and Shin, Reference Luo and Shin2019). As mentioned, the main NACEs occurrences periodically lag about one hour day by day, and the feature is similar to the tidal change. Therefore, it is necessary to analyse the tidal phase and NACEs Anomaly. NACEs Anomaly is the difference between the actually occurring and the average of NACEs over one tidal cycle:

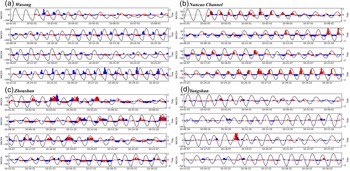
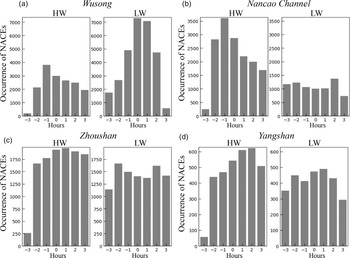
Both the NACEs Anomaly and tidal oscillation are shown in Figure 7. The primary NACEs occur at the low tide in Wusong waters, rather than the slack tide before high tide in Nancao Channel. In the Zhoushan and Yangshan regions, the variation of NACEs is not consistent with tidal oscillation. To understand the correlation between the tide and NACEs, the distribution of the occurrence time of NACEs is related to the tides, as shown in Figure 8. About 52% of NACEs occurred during the short period from 1 h before low tide to 2 h after that in Wusong waters, while about 63% of NACEs occurred at 2 h before and 3 h after high tide in Nancao Channel. By comparison, there is no prominent period for NACEs in the tide cycle in Zhoushan waters and Yangshan.
NACEs anomaly (red and blue bar) and tide time-series (black line). When the water level is higher(lower) than 0 meters, NACEs shows in the red (blue) bar; NACEA: NACEs anomaly

Histogram of the occurrence time of NACEs. High water (HW), Low water (LW)

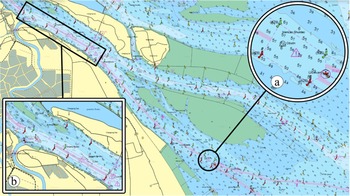
The influence of tides on ship collision is not clear in the present research. The statistics reported show that environmental conditions have weak effects as accident factors (Bakdi et al., Reference Bakdi, Glad, Vanem and Engelhardtsen2019), but some studies found that environmental conditions are essential factors in the navigational risk model (Zhang et al., Reference Zhang, Yan, Yang, Wall and Wang2013; Bye and Aalberg, Reference Bye and Aalberg2018). Indirectly, incorrect assessment of current and tide effects is a significant reason for the collision (Arici et al., Reference Arici, Akyuz and Arslan2020). The influence of tides on NACEs should be worthy of attention, because the tidal change makes the navigational environment complicated. The relationships between NACEs and tide could be carefully explained with water depth and topography. The water depth limits the size of the ship passing through the channel. Meanwhile, the topography causes the tide deformation, manifesting the difference of tidal epochs between upstream and downstream (Lu et al., Reference Lu, Tong, Lee, Zheng, Shen, Zhang and Yan2015). In the shallow water channel, the tide imposes the feasible time windows for navigation. As ships pass through the location in shallow waters during high tide, the ship-encounter situation would eventually increase. Therefore, NACEs mainly occur at high-water level, as shown in Nancao Channel (Figure 9a). The difference is that NACEs mainly occur during low tide in Wusong waters, which is located in the upstream of Nancao Channel, with a water depth greater than 10 meters (Figure 9b). The ship starts moving ahead of schedule to catch up with the high-water level of Nancao Channel, at the same time the tide in Wusong waters is at low tide because of the tide deformation. In Zhoushan waters, in which there are deep waterways, the NACEs occur mainly during the day. While it is difficult to determine the exact cause for such, a proposed explanation attributes the reason for daily berth planning and tidal current. The port does not carry out pilotage services for ships at night, except for the liners and oil tankers, because of adequate berth and anchorage. Meanwhile, the risk of navigating at night is higher because of strong tidal currents and restricted visibility.
The electronic chart of Yangtze Estuary

4. Discussion
4.1 NACEs validation
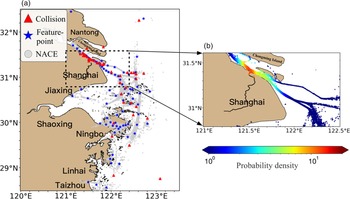
The validation work should check the adequacy of the correlation between NACEs and other information (Du et al., Reference Du, Goerlandt and Kujala2020a). The cluster analysis is performed on the position of NACEs to get feature points, using k-means clustering. The clustered NACEs results correspond rather well with the location of collisions that have occurred between 2013 and 2020, registered and maintained by the China Maritime Administration, as shown in Figure 10(a). The validation method is in line with previous study results (Zhang et al., Reference Zhang, Goerlandt, Montewka and Kujala2015). The high-density distribution of NACEs is similar to previous studies in the region (Weng et al., Reference Weng, Liao, Wu and Yang2020) study, as shown in Figure 10(b). Therefore, the identified NACEs are reliable and useful for analysis.
The concurrent validity test

4.2 NACEs and tide
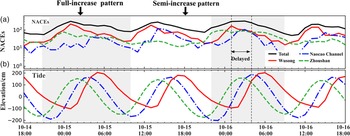
The previous sections analysed the general temporal variation of NACEs occurrence. The periodical fluctuation of NACEs within the timespan is similar to the finding in other regions (Goerlandt and Kujala, Reference Goerlandt and Kujala2011; Chen et al., Reference Chen, Mou and Gelder2019b) findings which. To display the temporal variation of NACEs with the tide in detail, this study chose the time series of NACEs in two days, shown in Figure 11. NACEs periodically evolved following the tidal oscillation in Wusong waters and Nancao Channel with a one-hour lag. The major NACEs in Wusong waters increased accompanying the fulling tide, while in Nancao, NACEs increased with the rising tide. The temporal variation of NACEs in Zhoushan waters oscillated with time rather than the tide.
The time series of NACEs and tide for each subregion (UTC+8). The time period was from 18:00 on 14 October to 18:00 on 16 October 2019

In sections 3.3 and 3.4, NACEs shows the patterns as: (1) NACEs in Wusong and Nancao Channel are correlated to the tide phase; (2) NACEs in each subregion are unique; (3) NACEs in Zhoushan waters are related to the daytime. This study also finds two patterns in the NACEs series, named ‘full-increase’ and ‘semi-increase’, which are shown as the grey and white areas in Figure 11. The full-increase pattern displays that NACEs are in high value and represent the high-risk potential in the three subregions. This pattern occurs when it is close to the low tide in Wusong and the high tide in Nancao during the daytime. The semi-increase pattern shows that NACEs are high in Wusong and Nancao, while the occurrence of NACEs in Zhoushan is low. This pattern displays a relatively lower risk potential in the study area. Thus, the stakeholders should pay particular attention when the semi-increase pattern appears.
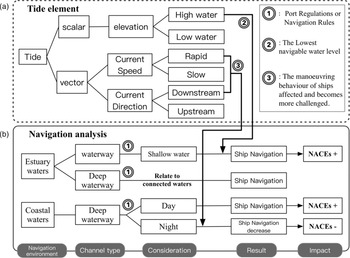
The tide level and the speed and direction of tidal currents are significant for the safe navigation of ships in channels and ports. Figure 12 shows a schematic of the tide impact on NACEs, reflecting the impact of the relationship between tide, channel and local characteristics on NACEs. The temporal characteristics of NACE can only be reflected from one time period and are related to the periodic fluctuation characteristics of the tide. They are next distinguished by the elements in the tide:
(1) The tide level is scalar. The change of tide level can ensure the minimum navigable water level to maintain sufficient clearance water level under the ship keel. Thus, the tide increases the navigable time for ships. At the shallow water point in the channel, when the tide is at high tide, the number of ships passing through increases, and then the density of ships increases, resulting in more encounters. NACEs will increase under this circumstance. The deep-water channel is not affected by the tide level, so the analysis of the deep-water channel must be combined with the navigational environment.
(2) The strength and direction of tidal current are vectors. When the ship runs downstream, and the tide current is rapid, manoeuvring the ship is much more challenging. Therefore, ships choose to dock and leave the wharf with no tide or even choose a counter-current to control the ship against the current. In the deep-water channel of coastal waters, there are usually complex islands, artificial facilities and sufficient anchorage. Due to the island topography, the currents between islands are rapid. The local maritime bureau will reduce night navigation, and the port will reduce pilotage services to avoid increased navigational risk. Therefore, NACEs occur mainly during the day and less at night. It is worth mentioning that although the deep-water port can operate all day, which includes ships docked at the port loading and unloading goods all day. This is not contradictory to the decline of ship traffic in the channel at night. In the deep-water channel at the estuary, the tide does not directly affect ship activities. The characteristics of ship activities are related to the characteristics of adjacent waters. When there are shallow water points in adjacent waters, to catch up with the tide and pass through the shallow water points, the activity characteristics of ships will also be reflected in tide-related fluctuations. At the same time, due to solid tidal deformation in the estuary, the characteristics of NACEs will have a specific time difference compared with those in adjacent waters.
The schematic of the tide impact on NACEs

4.3 Ship flow
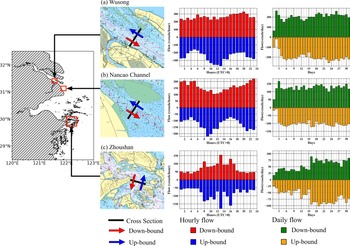
The ship flow analysis is a powerful tool for studying the channel efficiency, ship characteristics and ship accident types in small areas. In the Yangtze Estuary, some cross-section analysis has been used for research (Chai et al., Reference Chai, Weng and Li2020; Weng et al., Reference Weng, Liao, Wu and Yang2020), and the ship characteristics of its research waters have been further defined. To further understand the relationship between NACEs and tidal changes, we conducted the cross-sectional analysis of Wusong, Nancao waterway and Zhoushan.
Three sections are set up in Wusong, Nancao Channel and Zhoushan water. The results are shown in Figure 13. From the daily vessel traffic flow, the up-bound and down-bound ships in Wusong waters are 200 vessels/day, and the up-bound and down-bound ships in the Nancao Channel are 120 vessels/day. Overall, the upstream and downstream pattern of the vessel traffic flow in Wusong and Nancao Channel is similar. From the hourly vessel traffic flow, the number of down-bound ships varies evenly, ranging from 200 to 300 vessels/hour, while the number of up-bound ships has apparent fluctuations. Because the water depth in Wusong is greater than 10 meters, the ships do not need to consider the water depth conditions to sail and start moving ahead of schedule to catch up with the high-water level of Nancao Channel. The hourly vessel traffic flow in the Nancao Channel exhibits similar volatility because ships must enter and exit the channel by the tide. These characteristics are reflected in Figures 13(a) and 13(b). The Zhoushan waters are different from the others (Figure 13c). From the daily vessel traffic flow, the up-bound and down-bound ships are equivalent every day. From the hourly vessel traffic flow, the activities of ships during the day are significantly more active. Therefore, the ship flow results from the section analysis can further support the changing relationship between NACEs and tide.
Vessel traffic flow

4.4 Uncertainties of the data and limitations of the method
Due to the over/underestimation of the results by identification method on NACE (Chen et al., Reference Chen, Huang, Mou and Gelder2019a), the uncertainty of the analysis model is indispensable for understanding the applicability and defects of the results. The AIS data includes regular sailing ships, fishing vessels and other fixed or mobile installations equipped with AIS equipment. In this study, only cargo ships, tankers, containers, passenger ships and rescue vessels in the AIS were analysed, in total 14,687 ships. Many collision accidents involve fishing vessels, which could be included in the future NACEs study.
Because the GIQSD method can lead to the over/underestimation of NACEs, the distance between two ships could be added as one of the safety criteria in the ship domain. Two spatial distances are defined in a ship collision study: the ‘affirmative distance’ and the ‘critical distance’. The affirmative distance means that a NACE will be identified if the distance between the two ships is within a threshold distance, and the critical distance means that a NACE will not be identified if the distance between the two ships is outside this threshold distance. NACEs related to ships of different sizes would be over/underestimated in different waters, especially in restricted waters. The speed of a ship involved in a potential collision is assumed with an average speed of 8 knots. Since there is no direct consideration of collision avoidance rules in Nancao Channel, the affirmative distance is chosen with the actual width of 0⋅55–0⋅8 nm. In the GIQSD method, the affirmative distance for most ships is below 0⋅5 nm, which means there will be no severe overestimation in areas where ships are dense, such as anchorages and restricted waters. In open waters, the maximum upper-limit distance does not exceed 1⋅7 nm, while the distance between any two ships should be greater than 2 nautical miles in reality. It should be noted that the estimated mean speed of the ship used in this study is 8 knots, while according to the statistics, the speed varies mainly from 8 to 14 knots for ships longer than 150 m in open water. Therefore, the results of NACEs will likely cause an overestimation in restricted waters or anchorages and an underestimation in open waters.
5. Conclusions
This paper identified NACEs from 14,687 ships around the Yangtze Estuary and adjacent coastal waters, with the quaternion ship domain method based on AIS data in October 2019. We established a statistical method for the occurrence time of NACEs and the state of tides according to the half-tide level and the nearest time, and analysed the NACEs occurrence with tide state from the tidal chart in subregions. The major NACEs in Wusong, Nancao Channel and Zhoushan region occurred during the low-tide period, the high-tide period and daytime, respectively. The analysis shows that it is valuable to connect NACEs with tides. An improved understanding of the impact of tides on NACEs is useful for regulation of navigation and reducing the collision risk. The temporal features of NACEs are also useful for preparing for potential environmental pollution by ship collision. In this study, neither fishing vessel activities nor other environmental conditions were considered, especially extreme weather: fog, tropical cyclone, cold wave.
Further work should collect more AIS data and accident reports to infer detailed temporal features of NACEs. The long-term NACEs series would present its relationship to more complicate marine and weather conditions. The additional incident data would further verify the relationship between tides and NACEs. The study would be valuable for exploring the influence on NACEs from different factors, such as weather conditions, ocean current and daily berth planning. Considering the NACEs occurrence in improving the risk assessment of potential oil spill from ship collision is proposed as a joint research project with the Maritime Safety Administration, the Oceanic Administration and the Environmental Protection Agency.
Acknowledgments
This study is supported by the Social Development Science and Technology Field Projects of Shanghai Science and Technology (Research on and Demonstration of Key Technologies of Intelligent Maritime Search and Rescue System, grant no. 18DZ1206300).